
 Facebook
 X
X
 Pinterest
 Copy Link
Fort Lauderdale February 2026 Area Report

Fort Lauderdale February 2026 real estate statistics have been published.
Fort Lauderdale Area Reports
Single Family Homes
Condominium & Townhouses
Fort Lauderdale Real Estate Market — February 2026
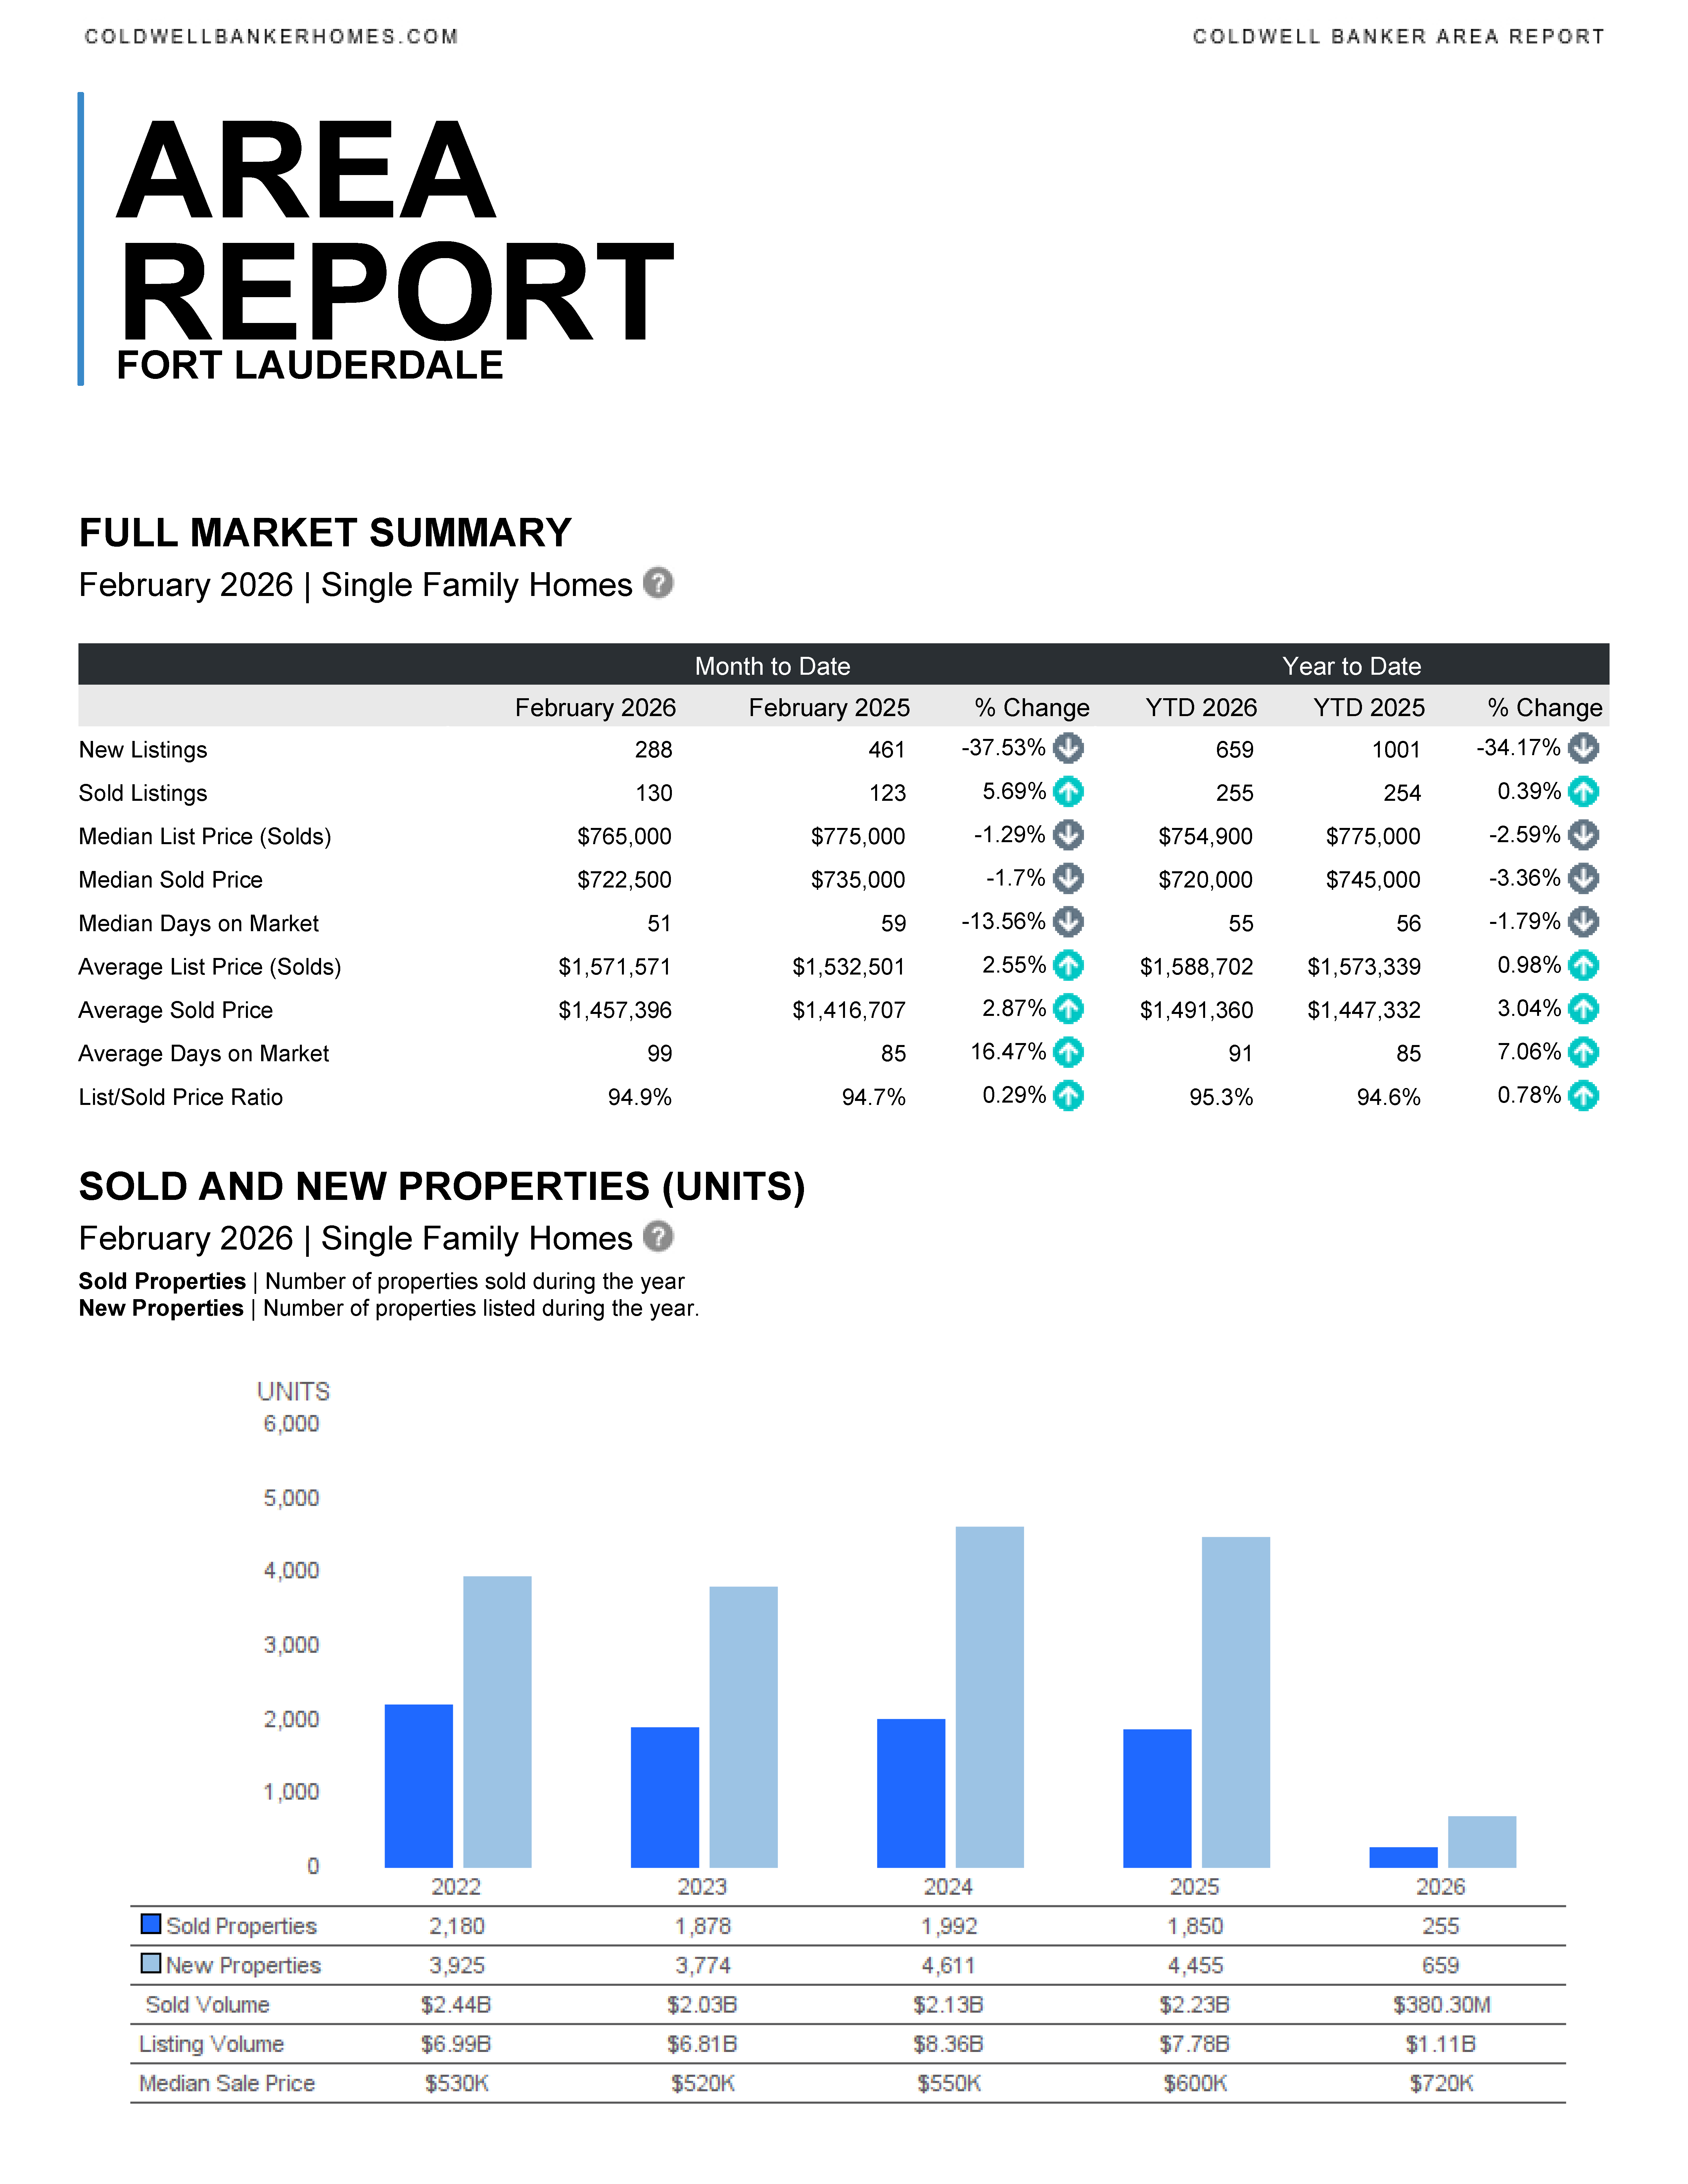
The February 2026 Fort Lauderdale real estate market shows contrasting trends between single-family homes and condos/townhomes, driven by declining inventory, shifting buyer behavior, and price stabilization.
Single-Family Homes
Inventory continues tightening, with new listings down 37.5% year-over-year (288 vs. 461). Despite fewer homes available, closed sales increased 5.7%, signaling strong buyer demand. Prices remained relatively stable:
- Median sold price: $722,500 (↓1.7%)
- Average sold price: $1.46M (↑2.87%)
- Median days on market: 51 (↓13.6%)
Sellers maintain an advantage in the mid‑to‑high‑end market, with a 94.9% list-to-sold ratio.
Condo / Townhome Market
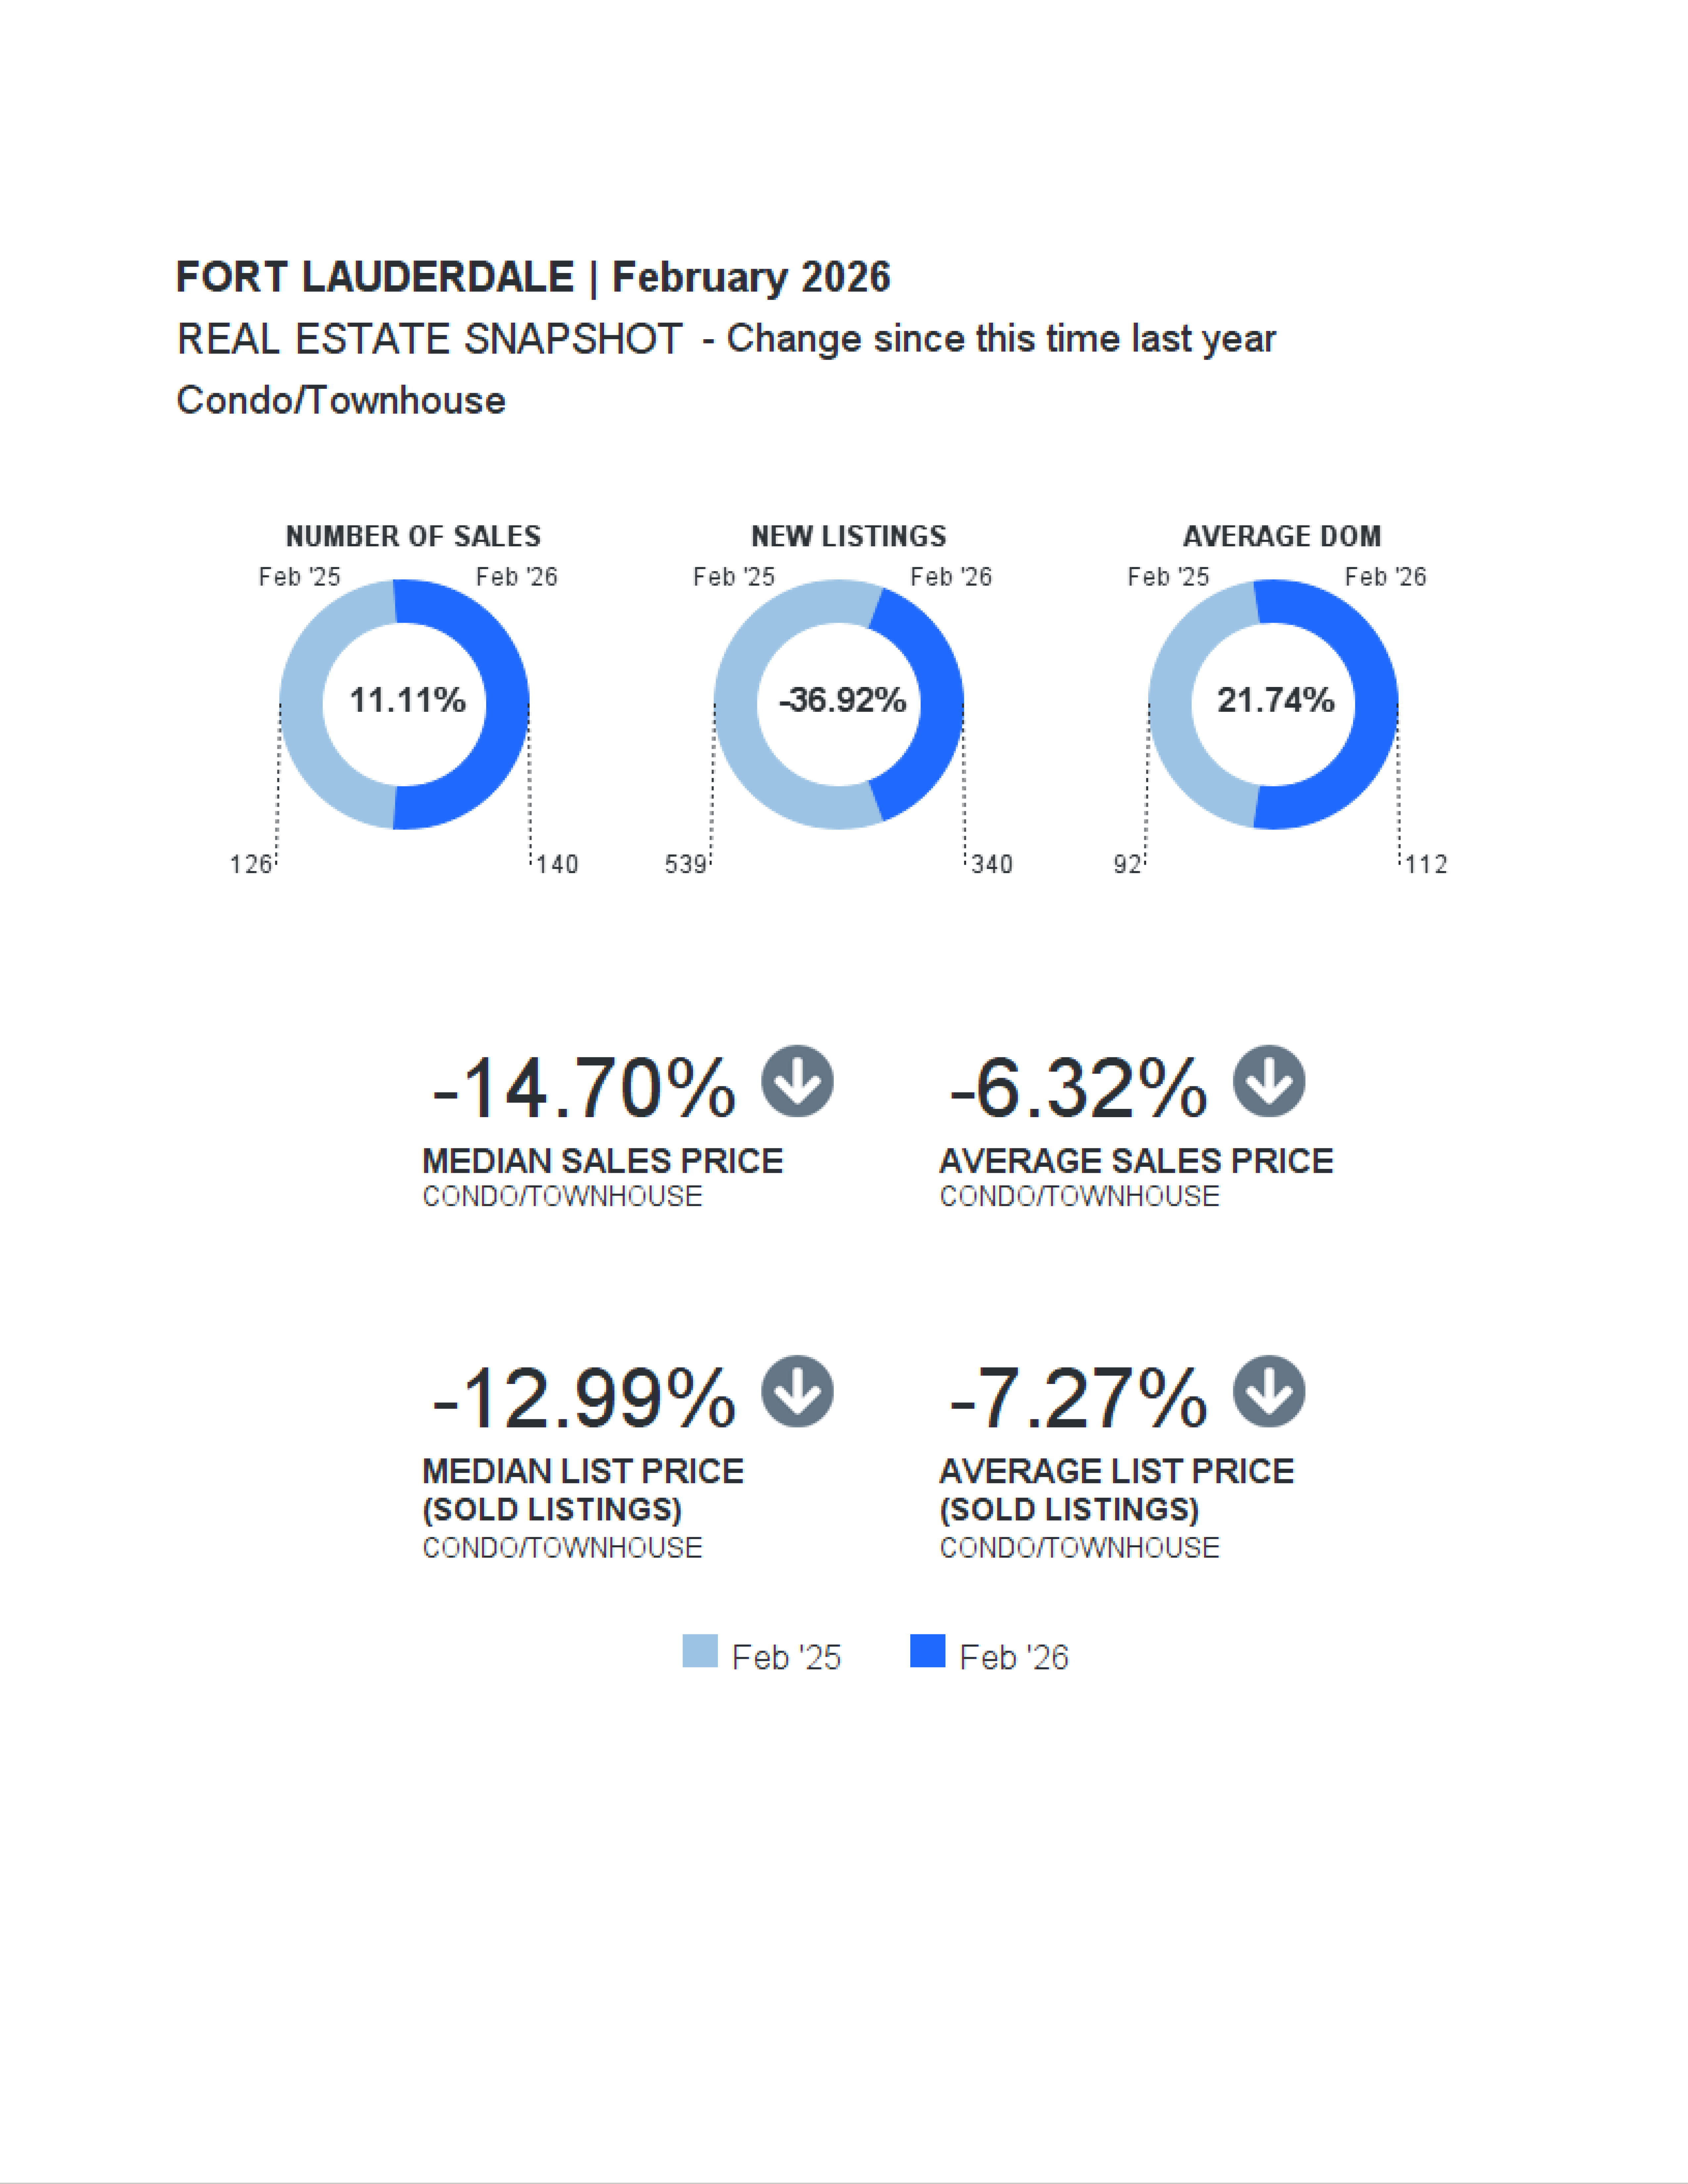
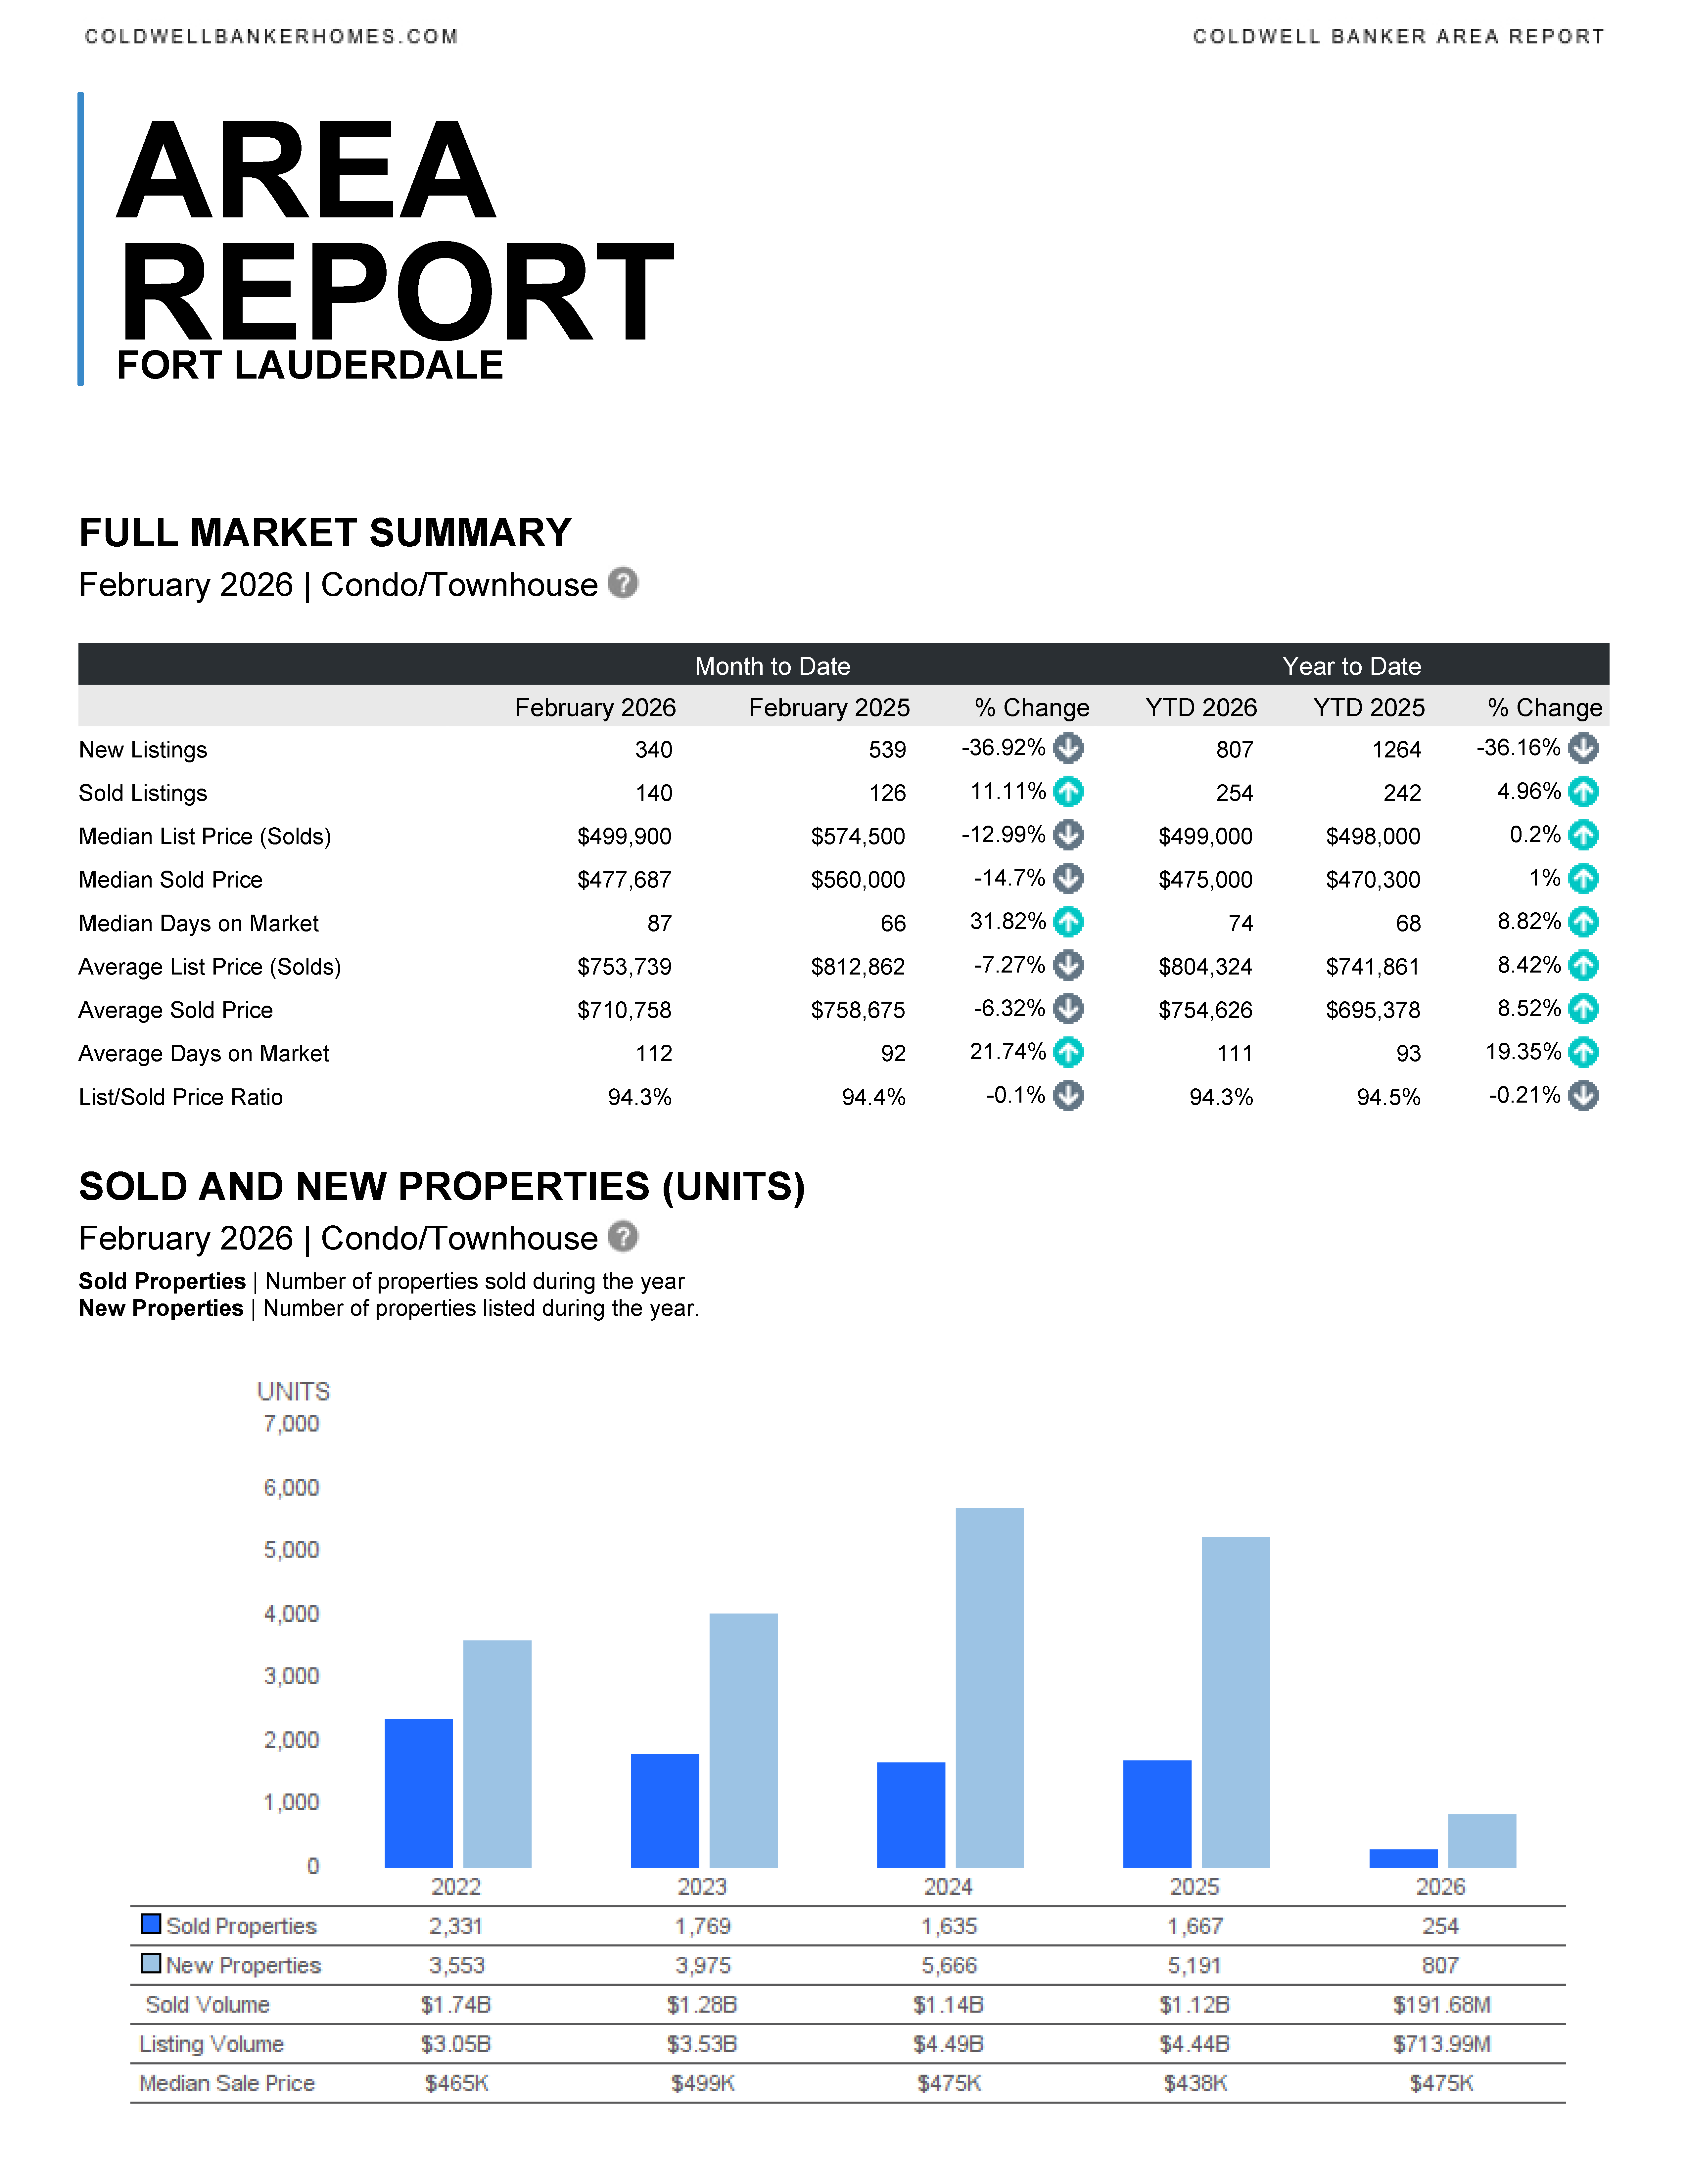
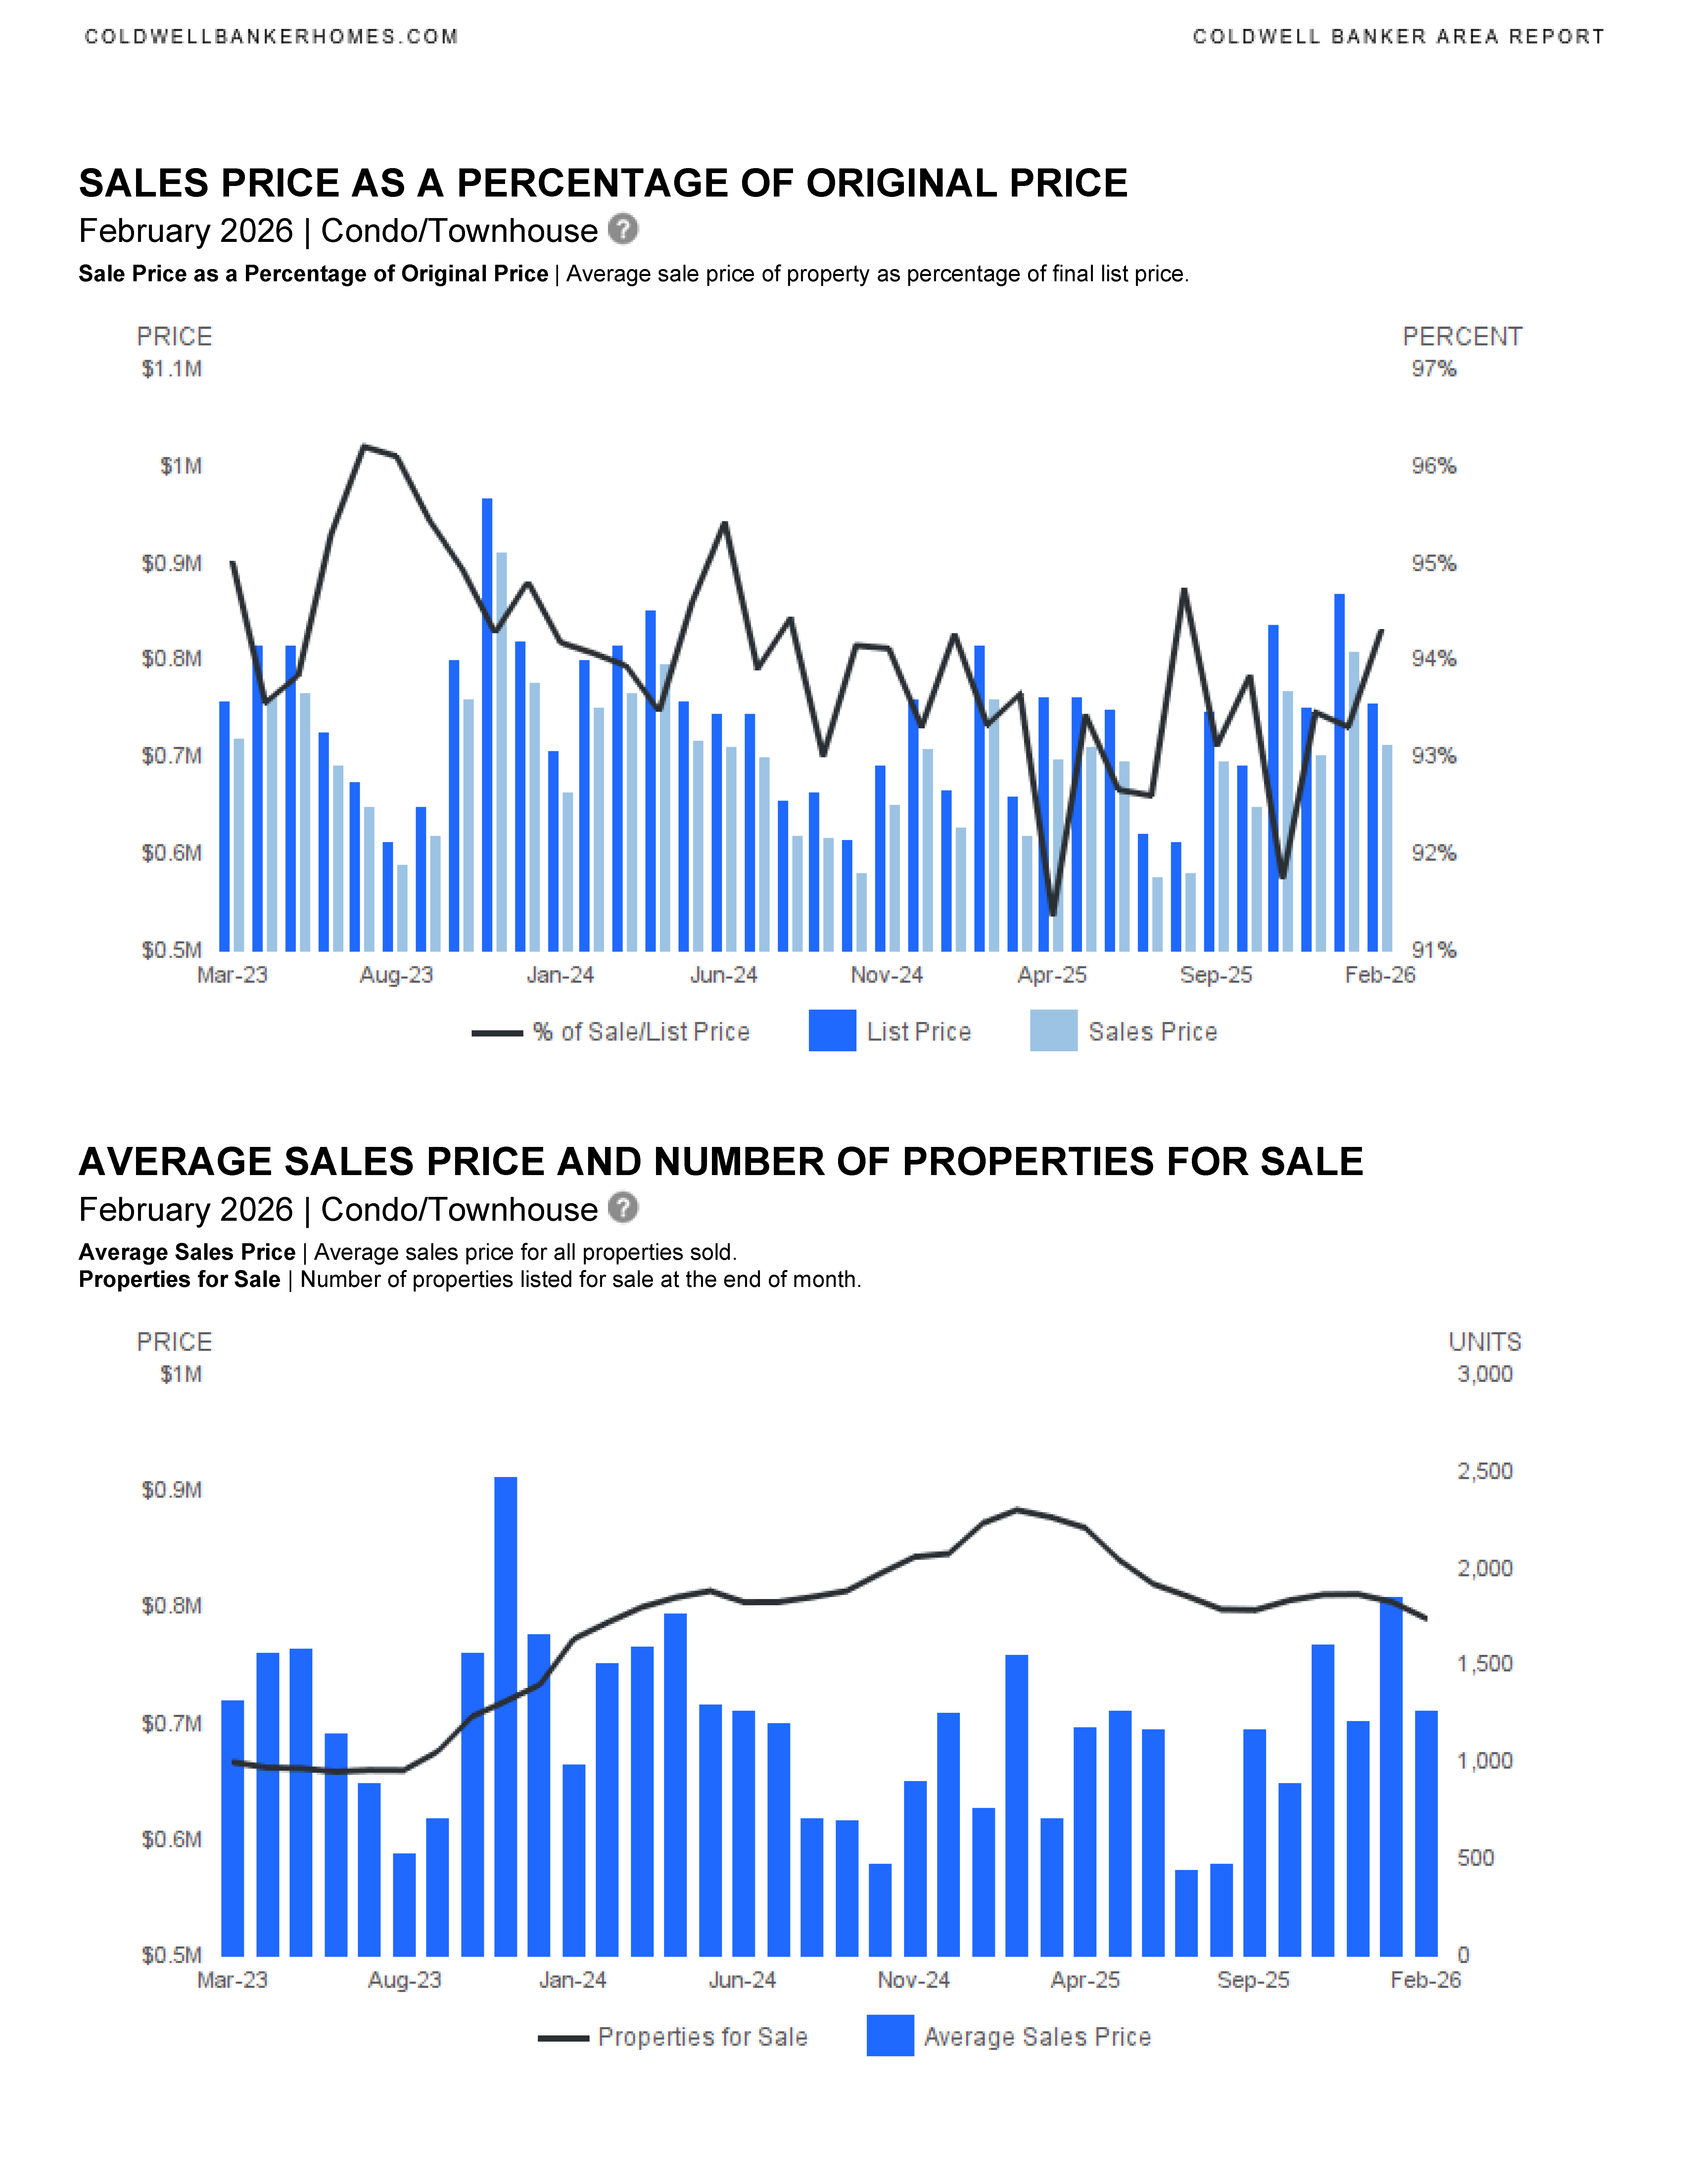
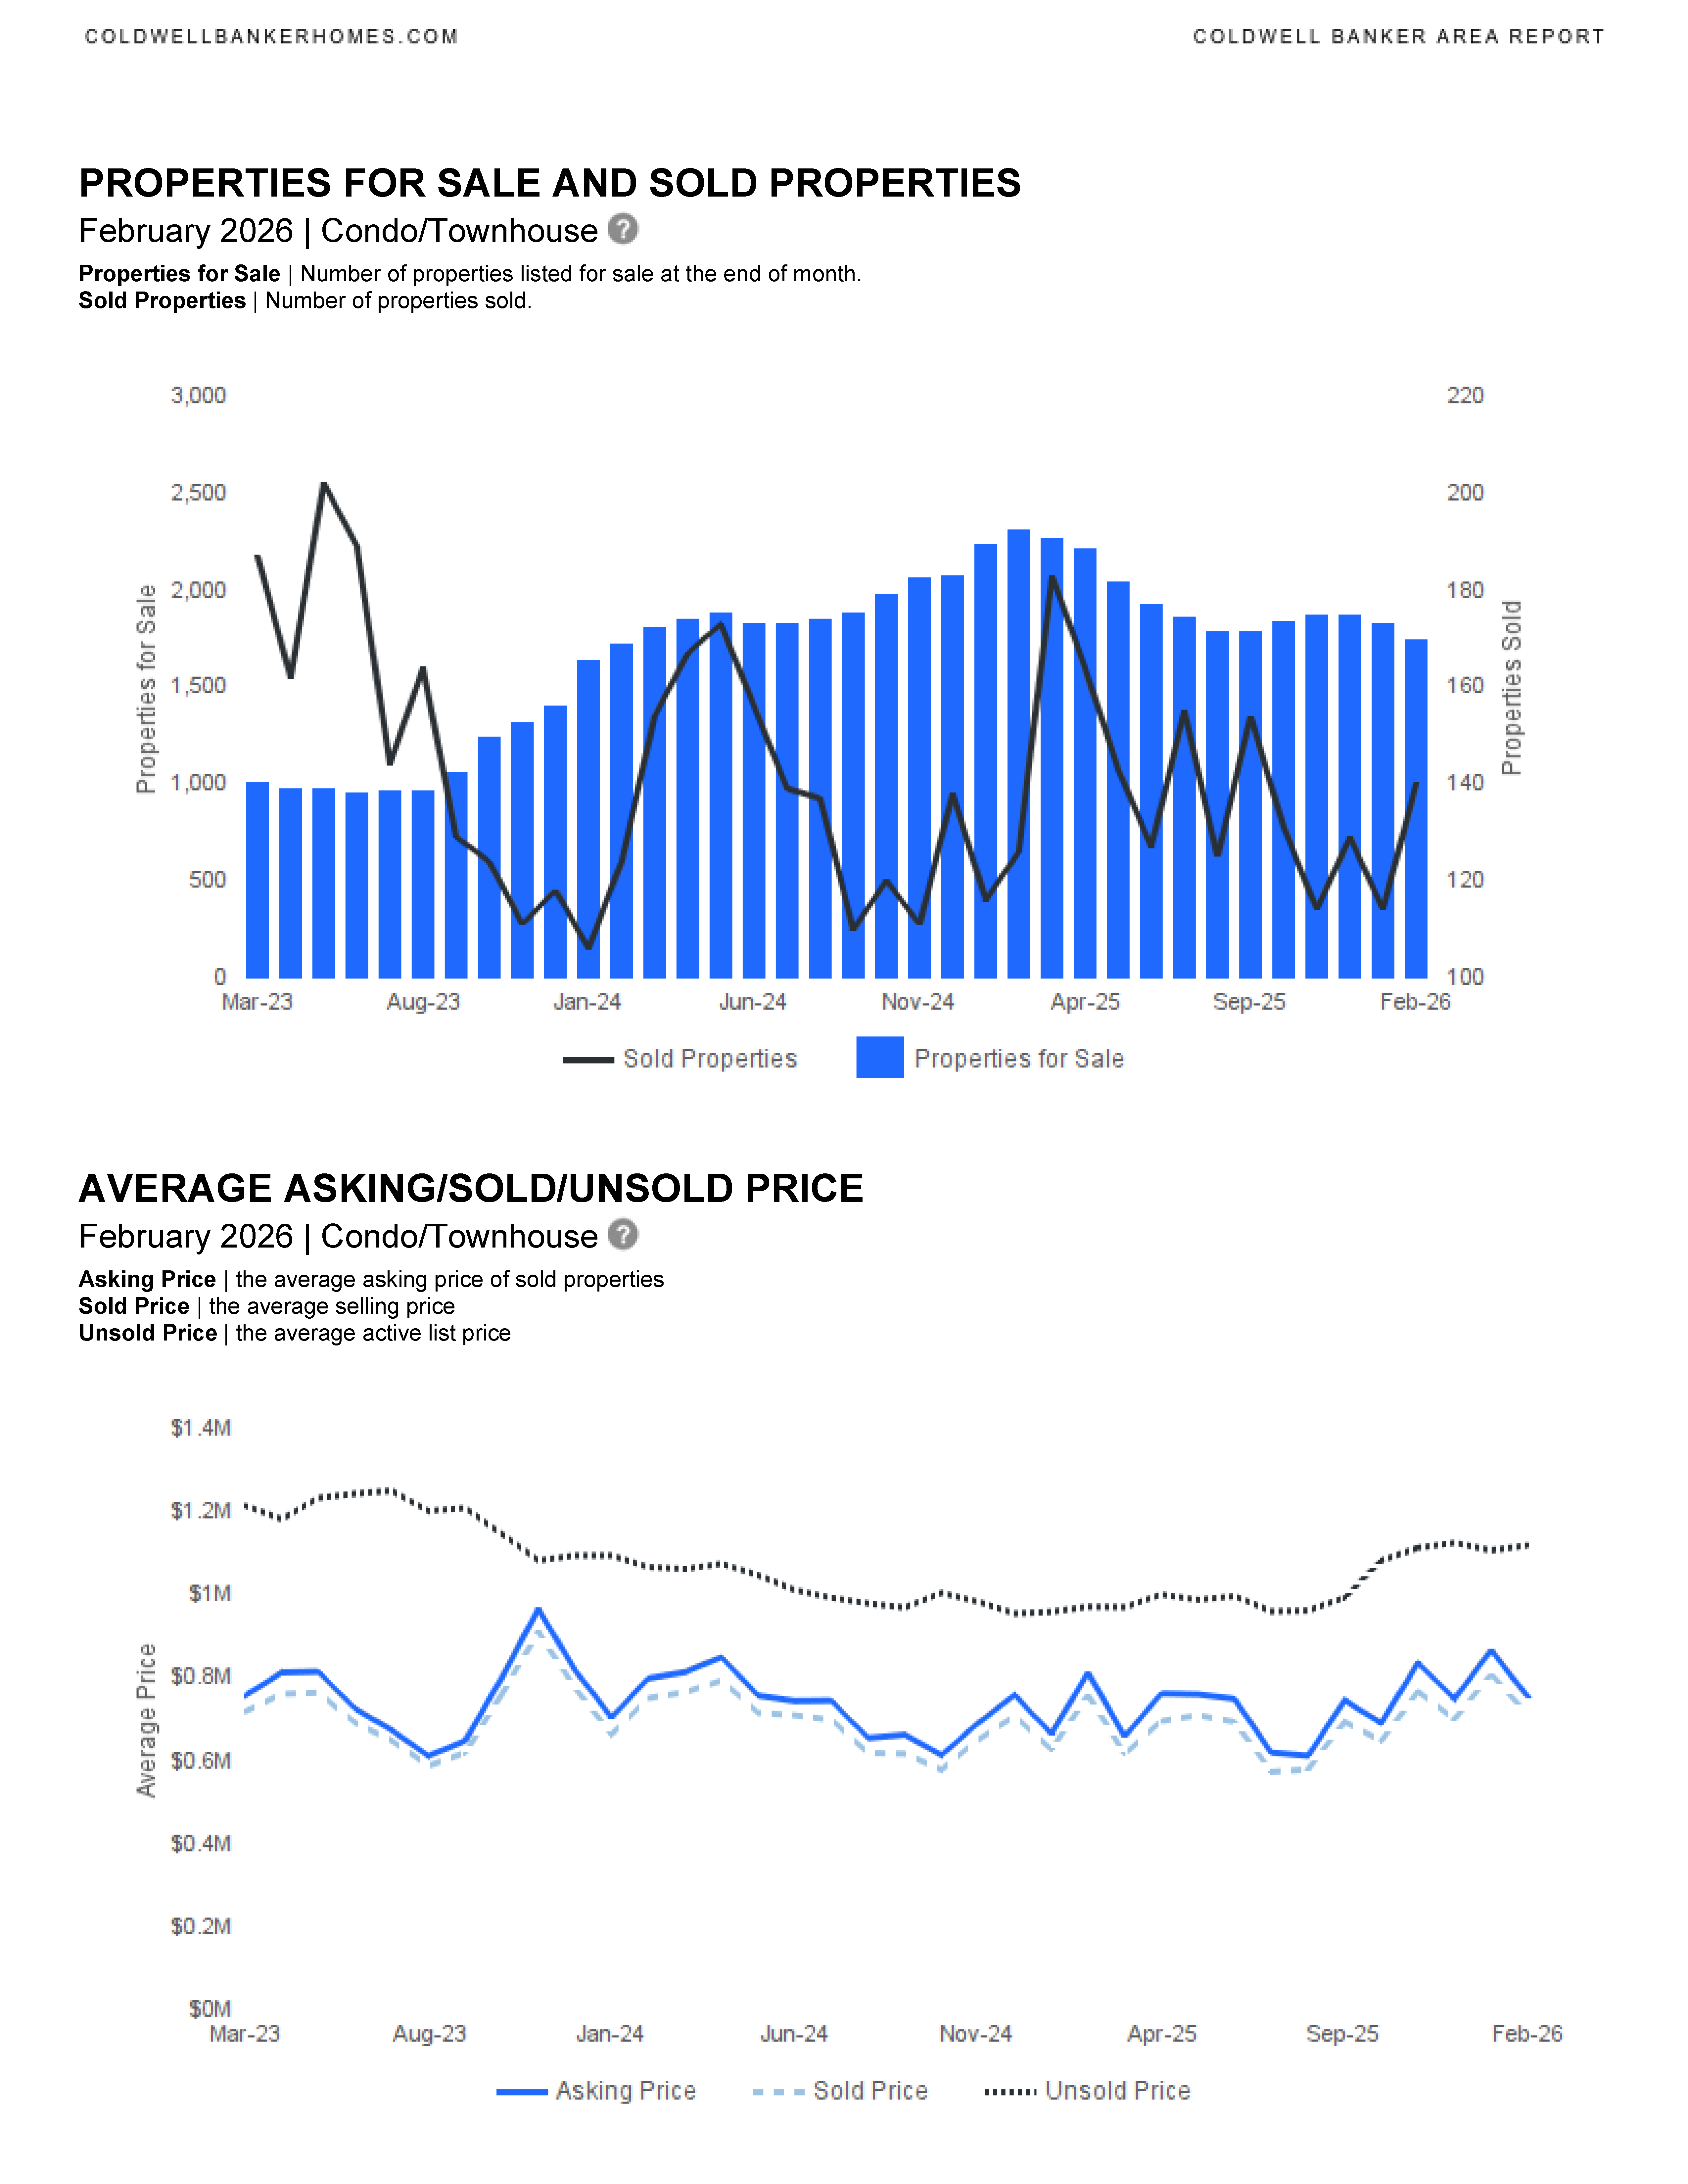
The condo market also experienced a sharp decline in new listings (down 36.9%), but sales jumped 11.1% year-over-year, creating upward pressure in certain sub‑markets. Price activity was mixed:
- Median sold price: $477,687 (↓14.7%)
- Average sold price: $710,758 (↓6.3%)
- Days on market: 87 (↑31.8%)
While buyers have more negotiation power due to increasing DOM, the overall reduction in new listings indicates demand remains solid.
Market Snapshot
Across both segments, reduced inventory and consistent buyer activity are creating a competitive landscape, especially for well‑priced, turnkey properties. Luxury and waterfront listings in Fort Lauderdale continue to attract strong interest.
Commonly asked questions while reviewing the reports:
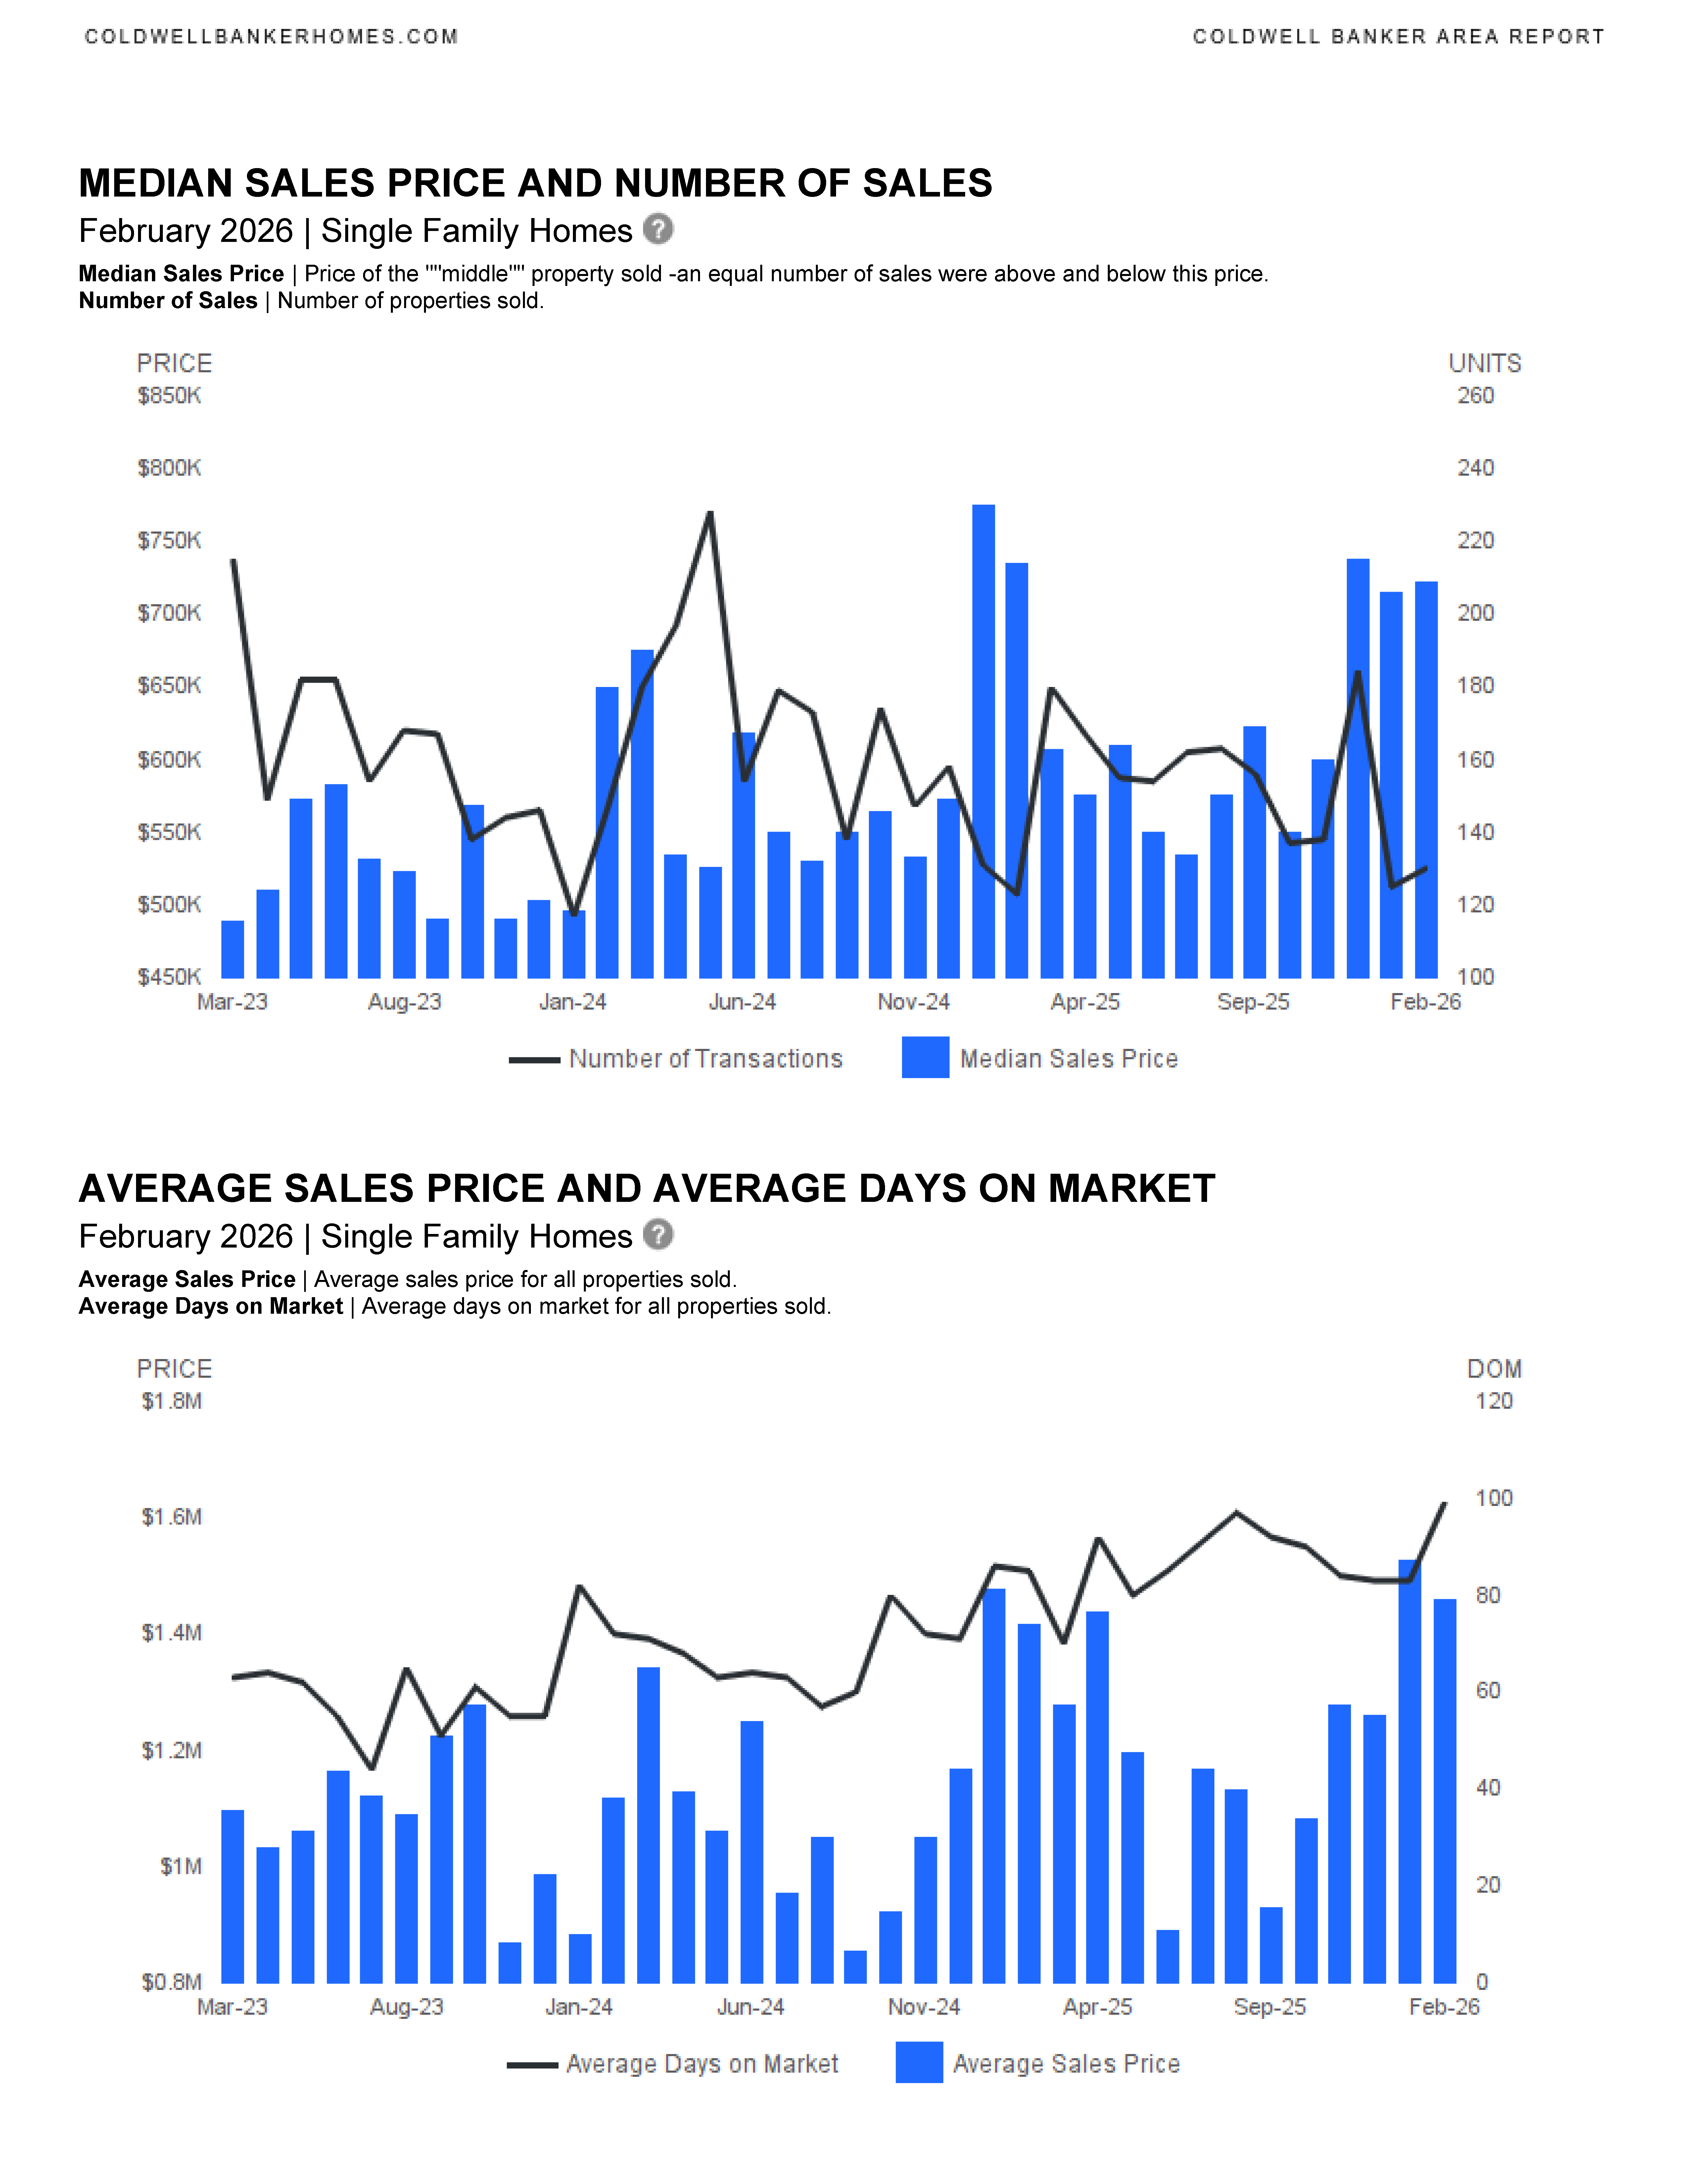
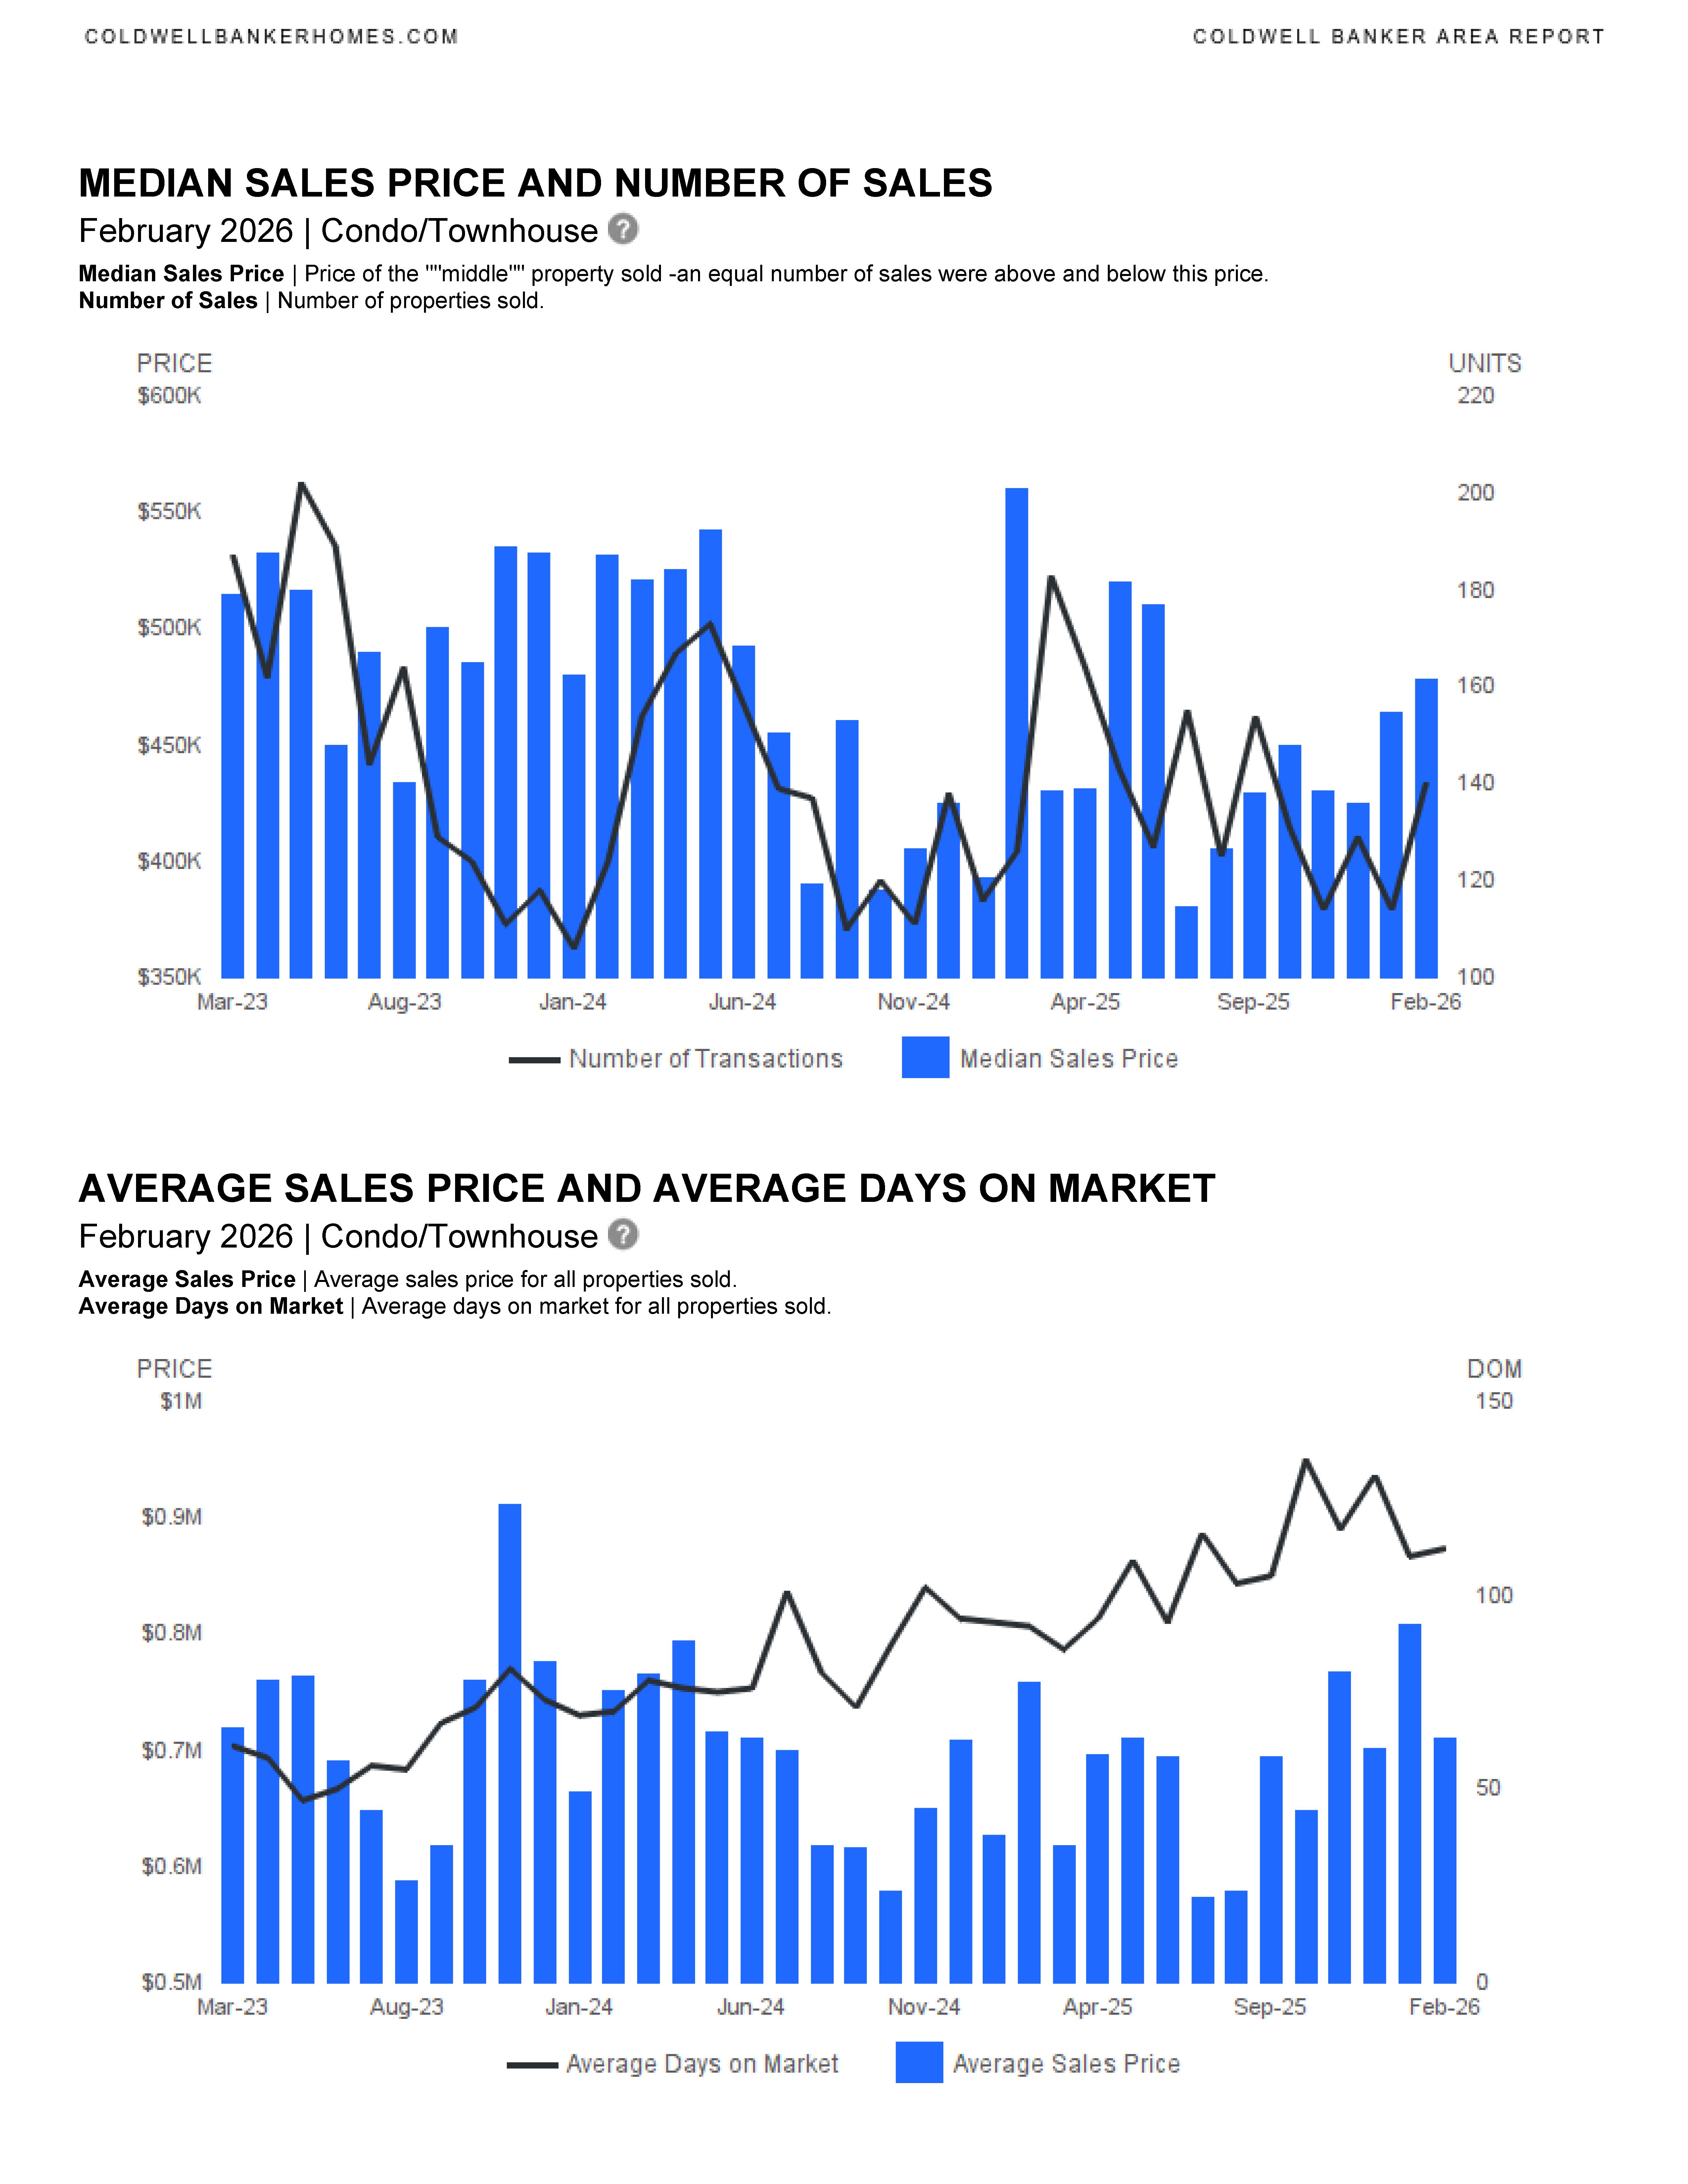
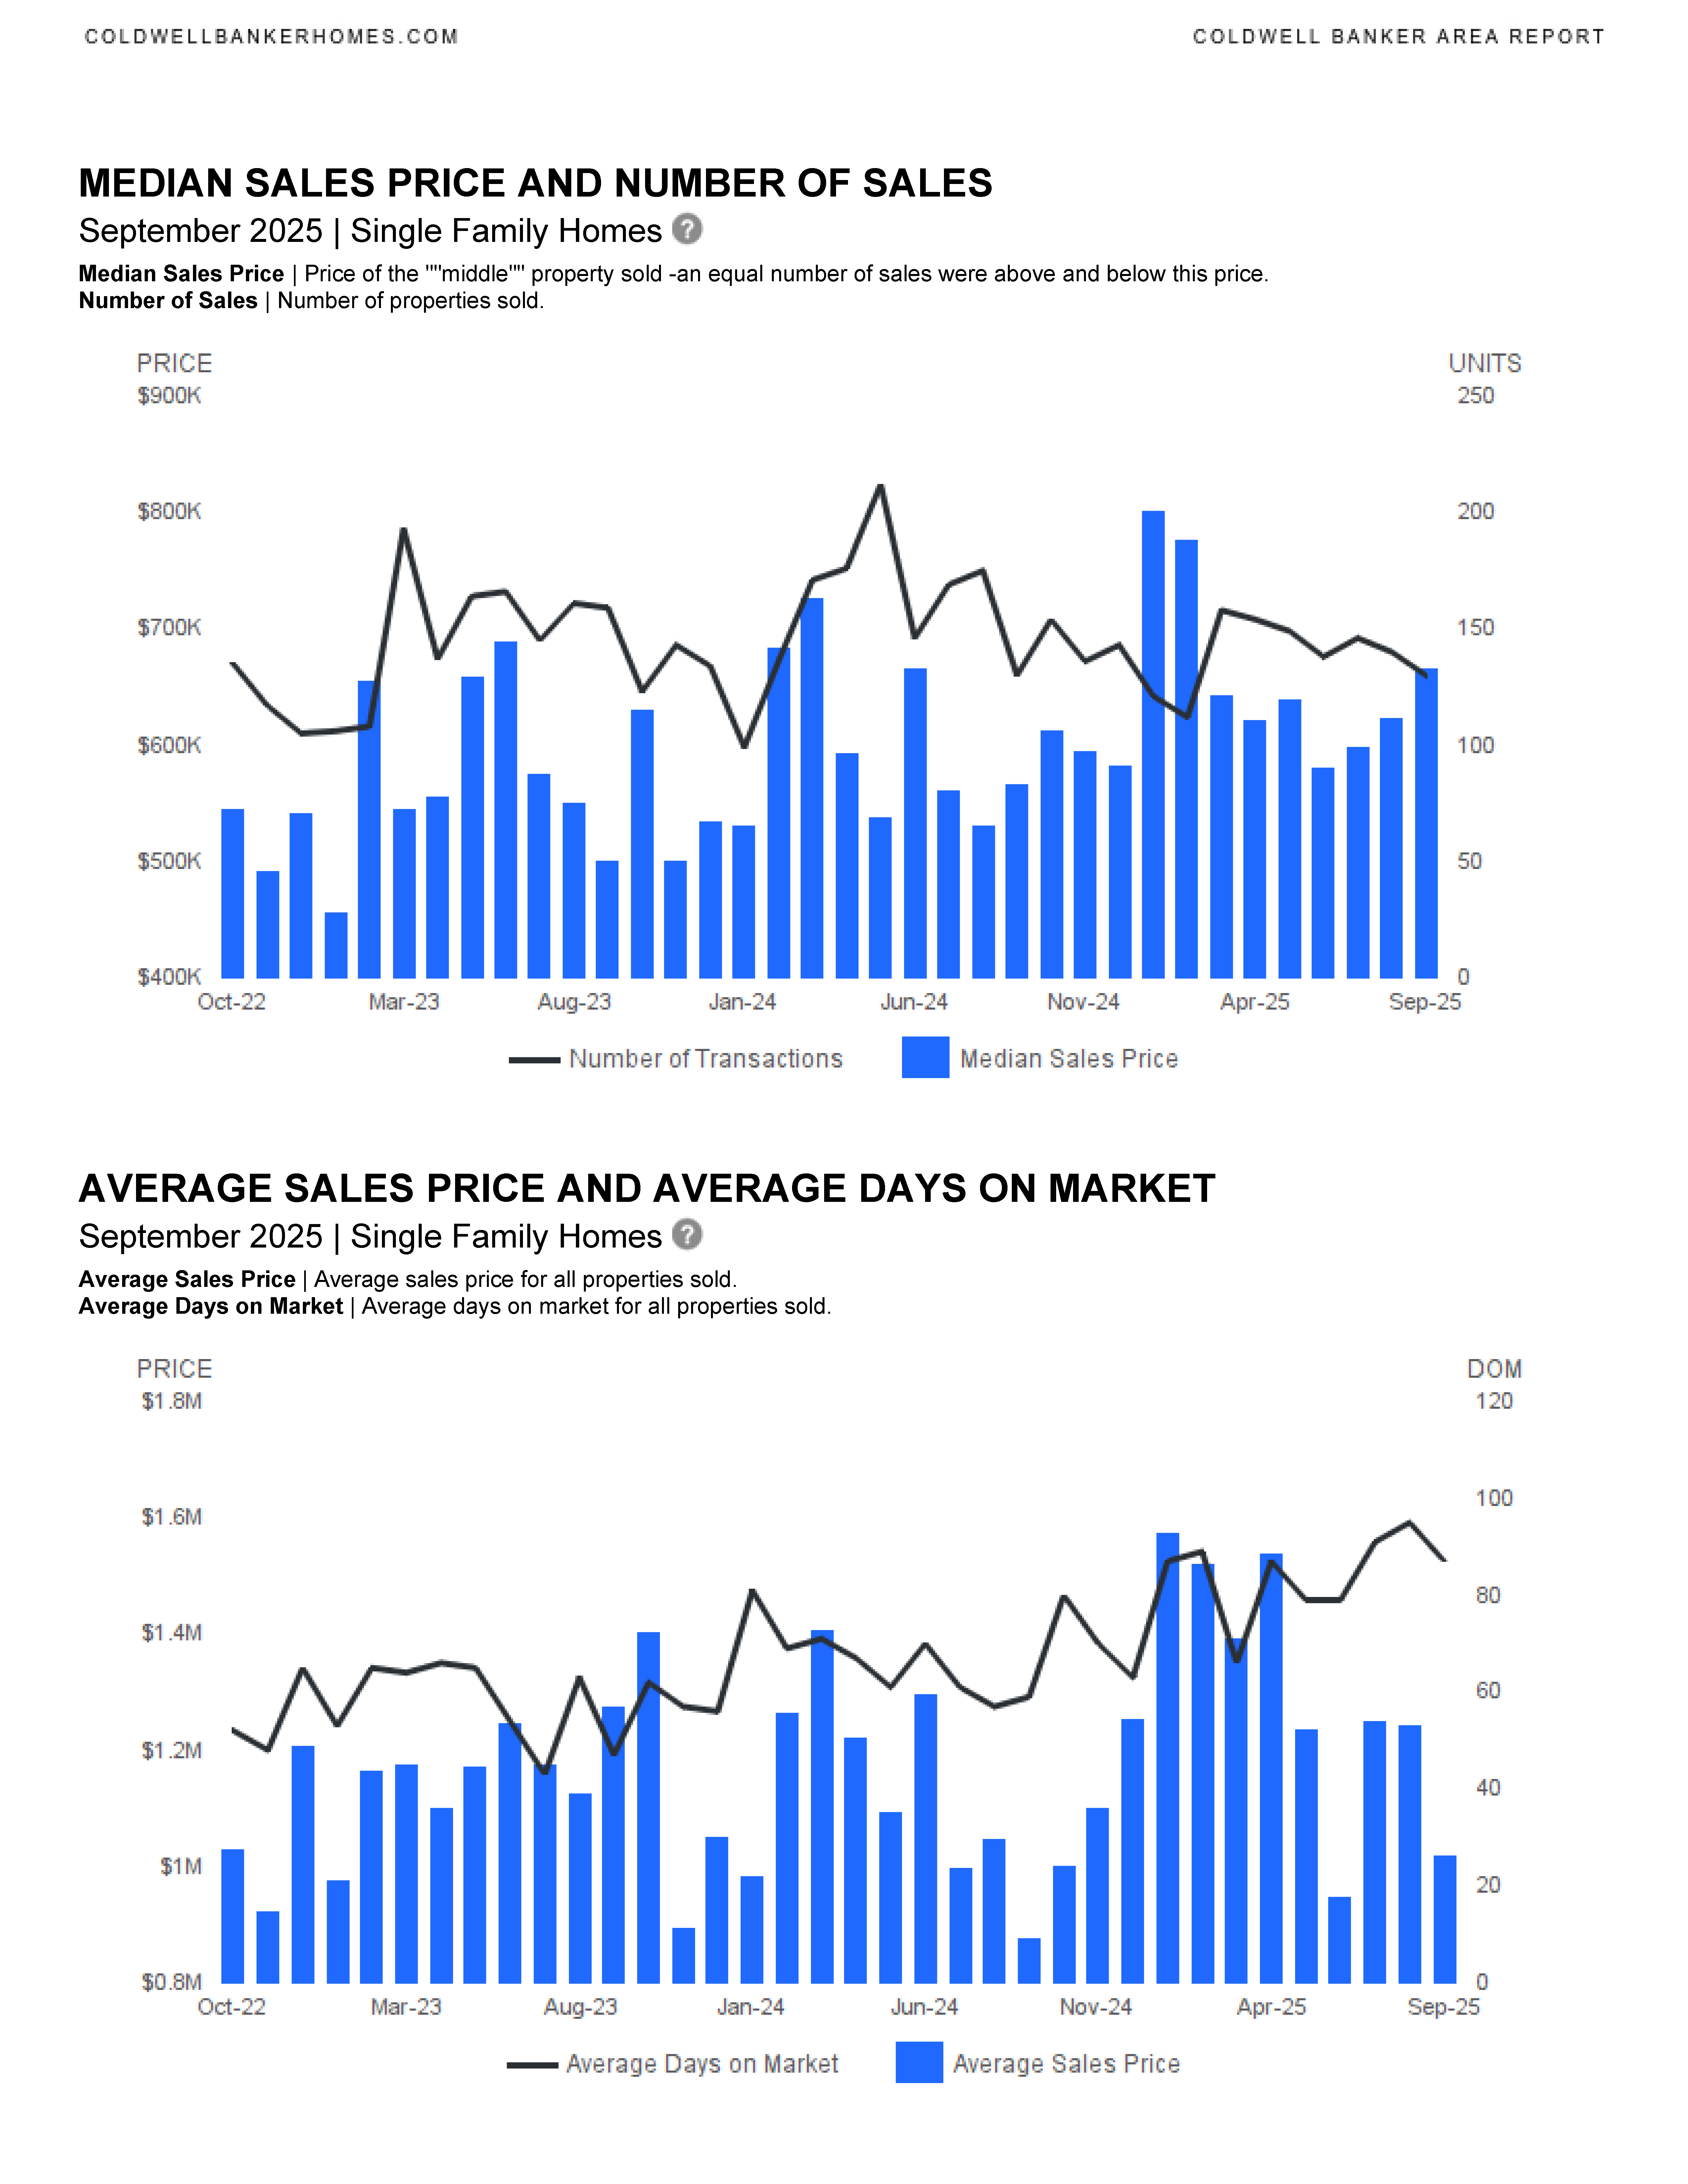
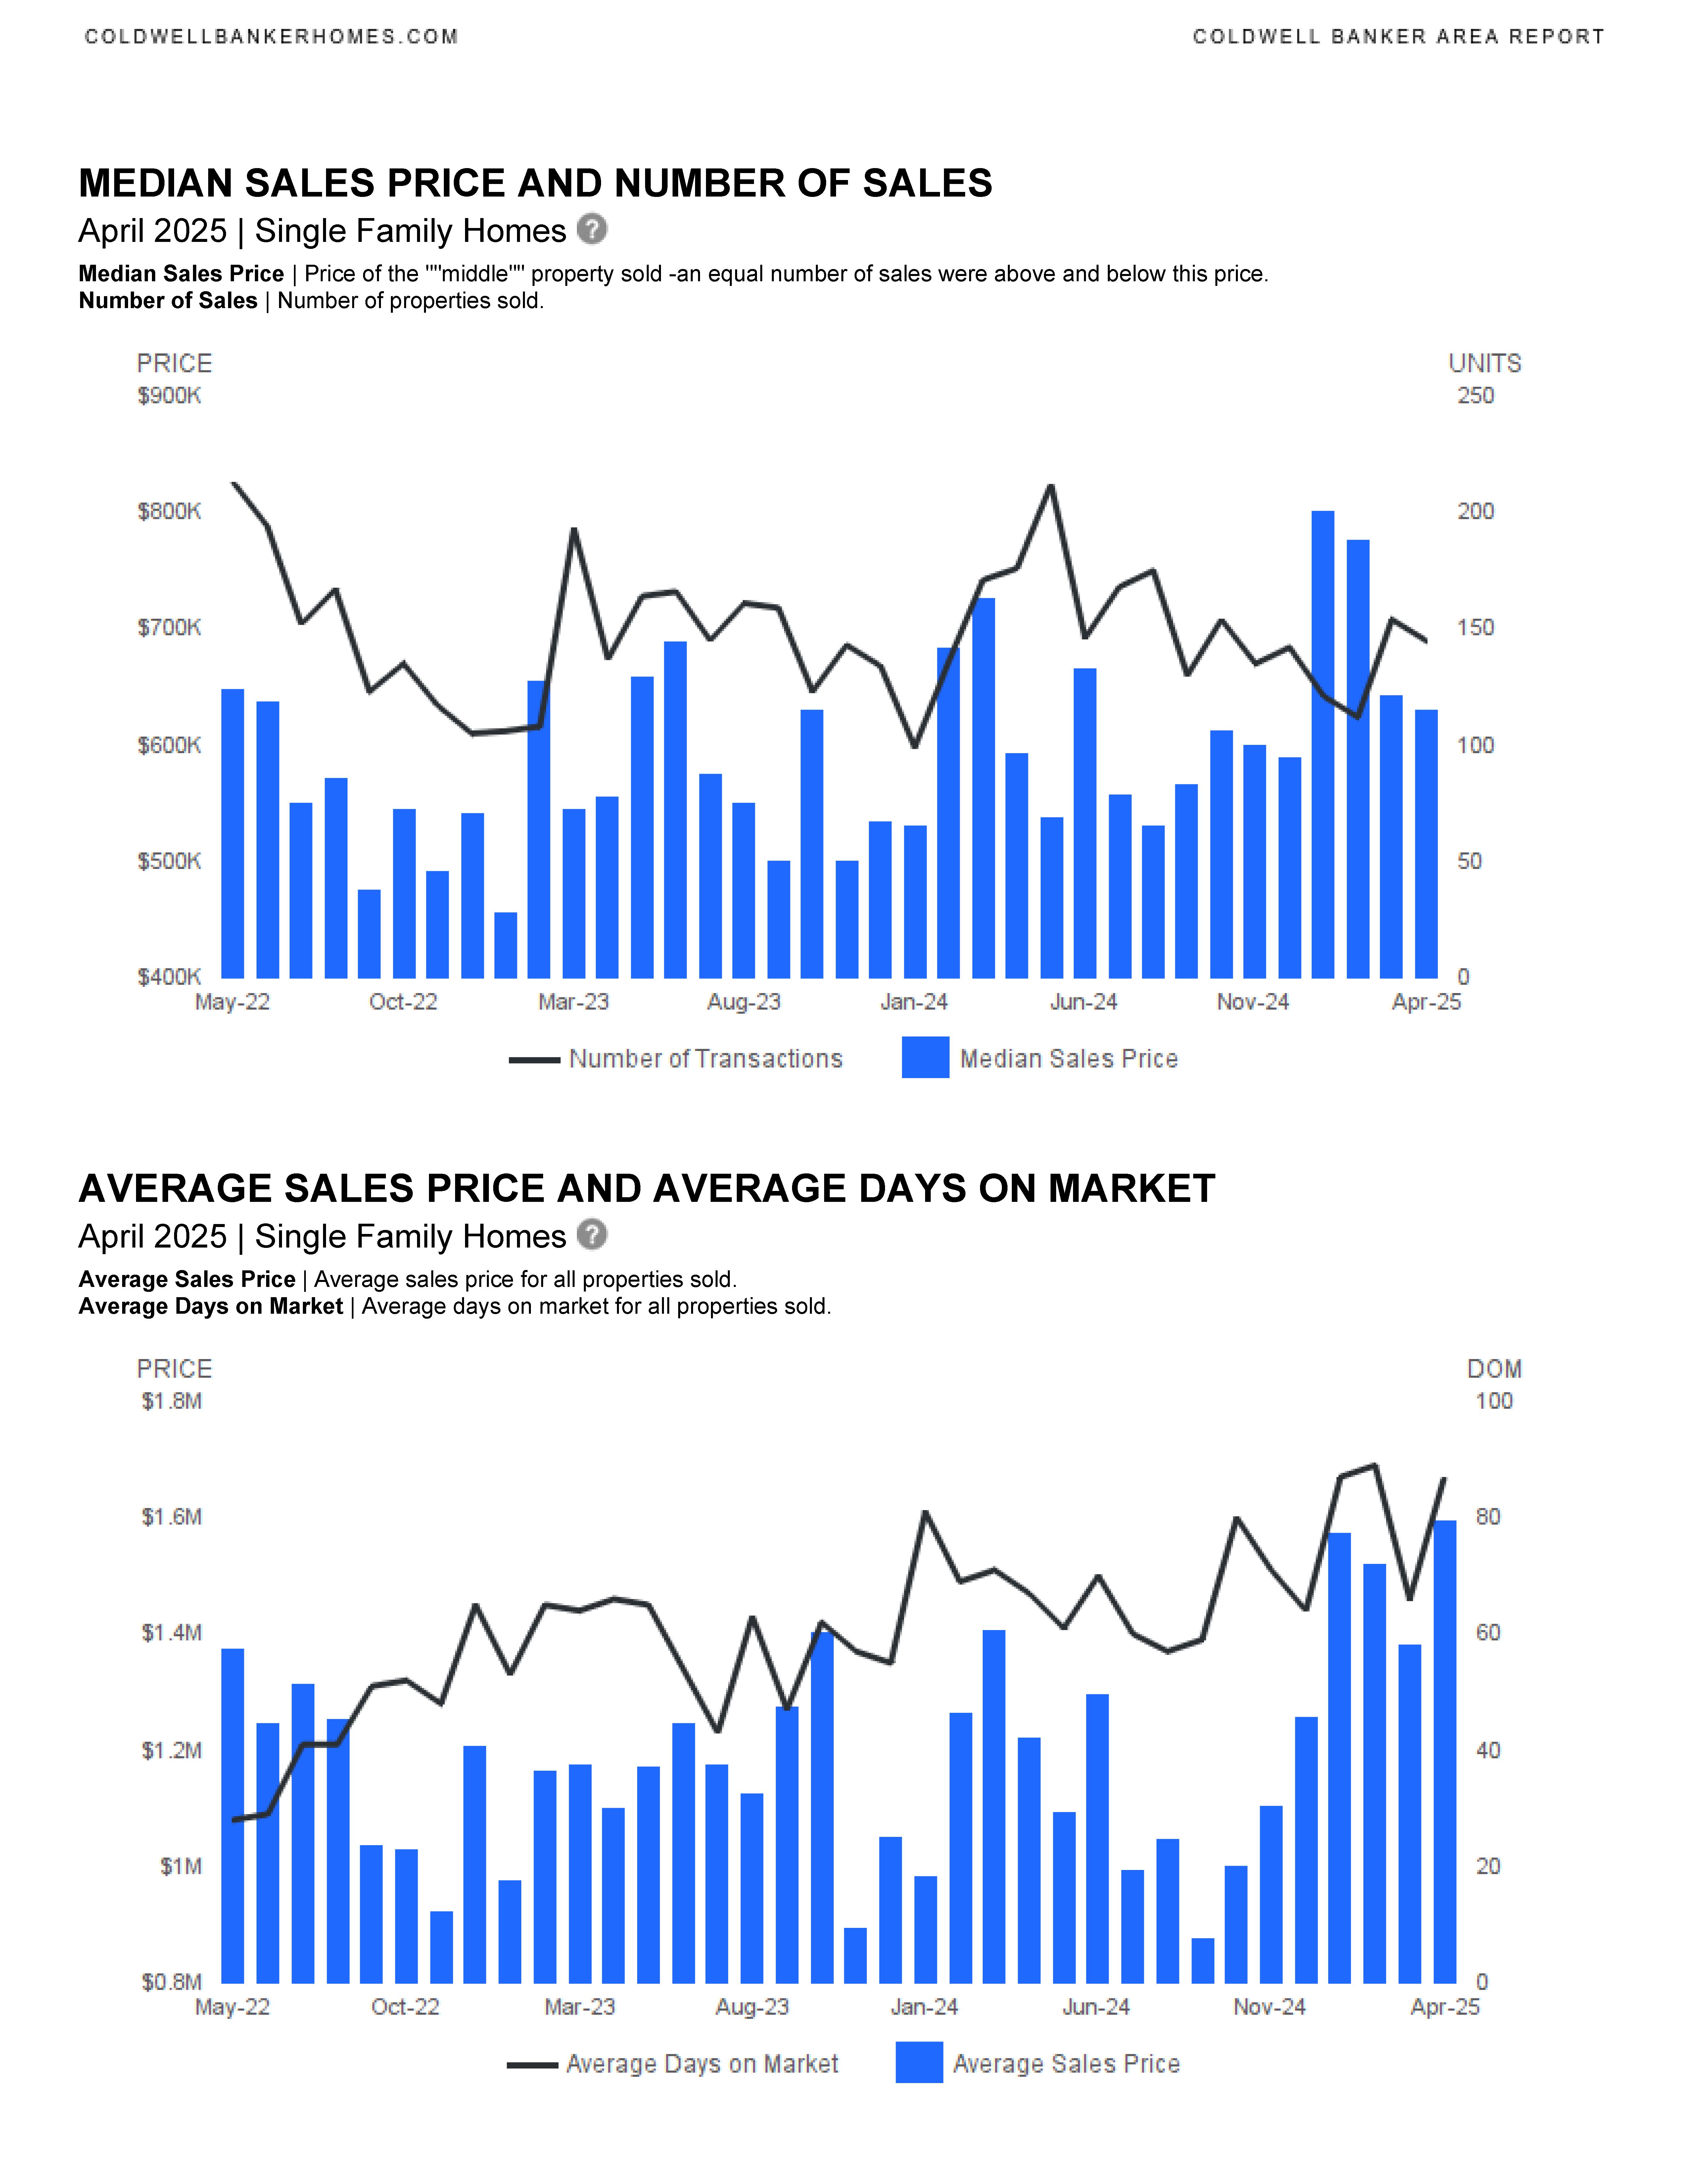
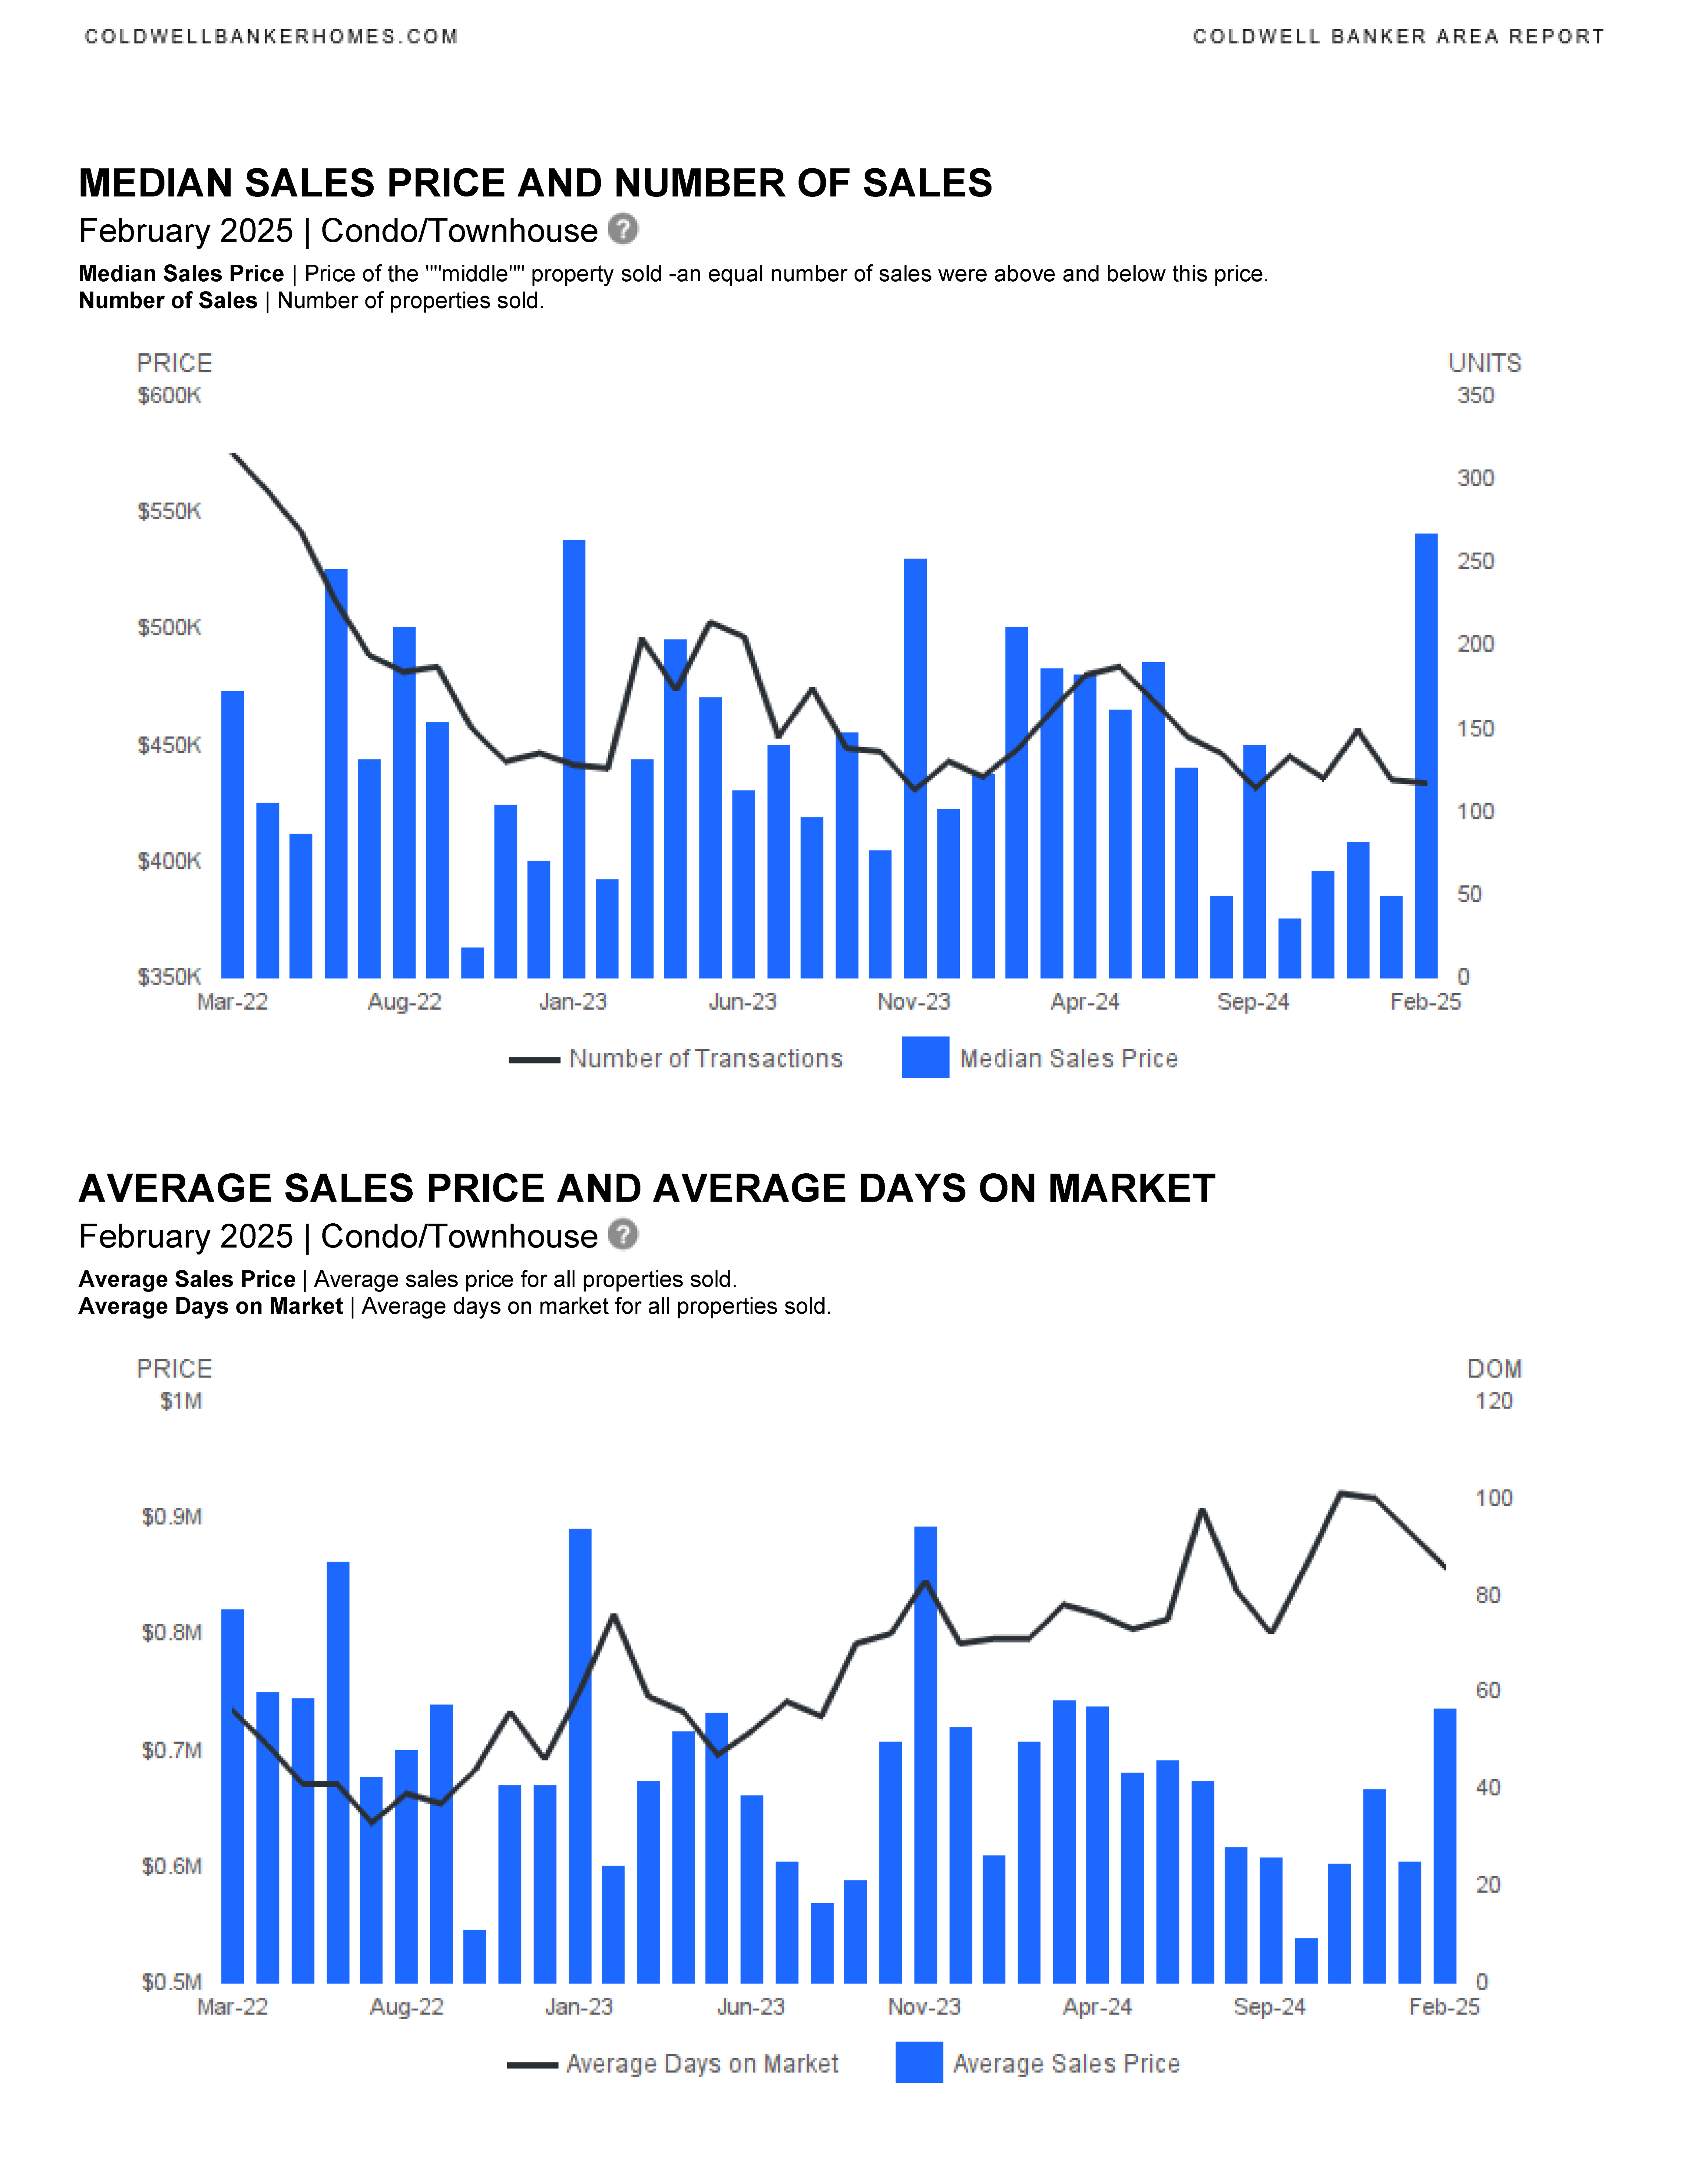
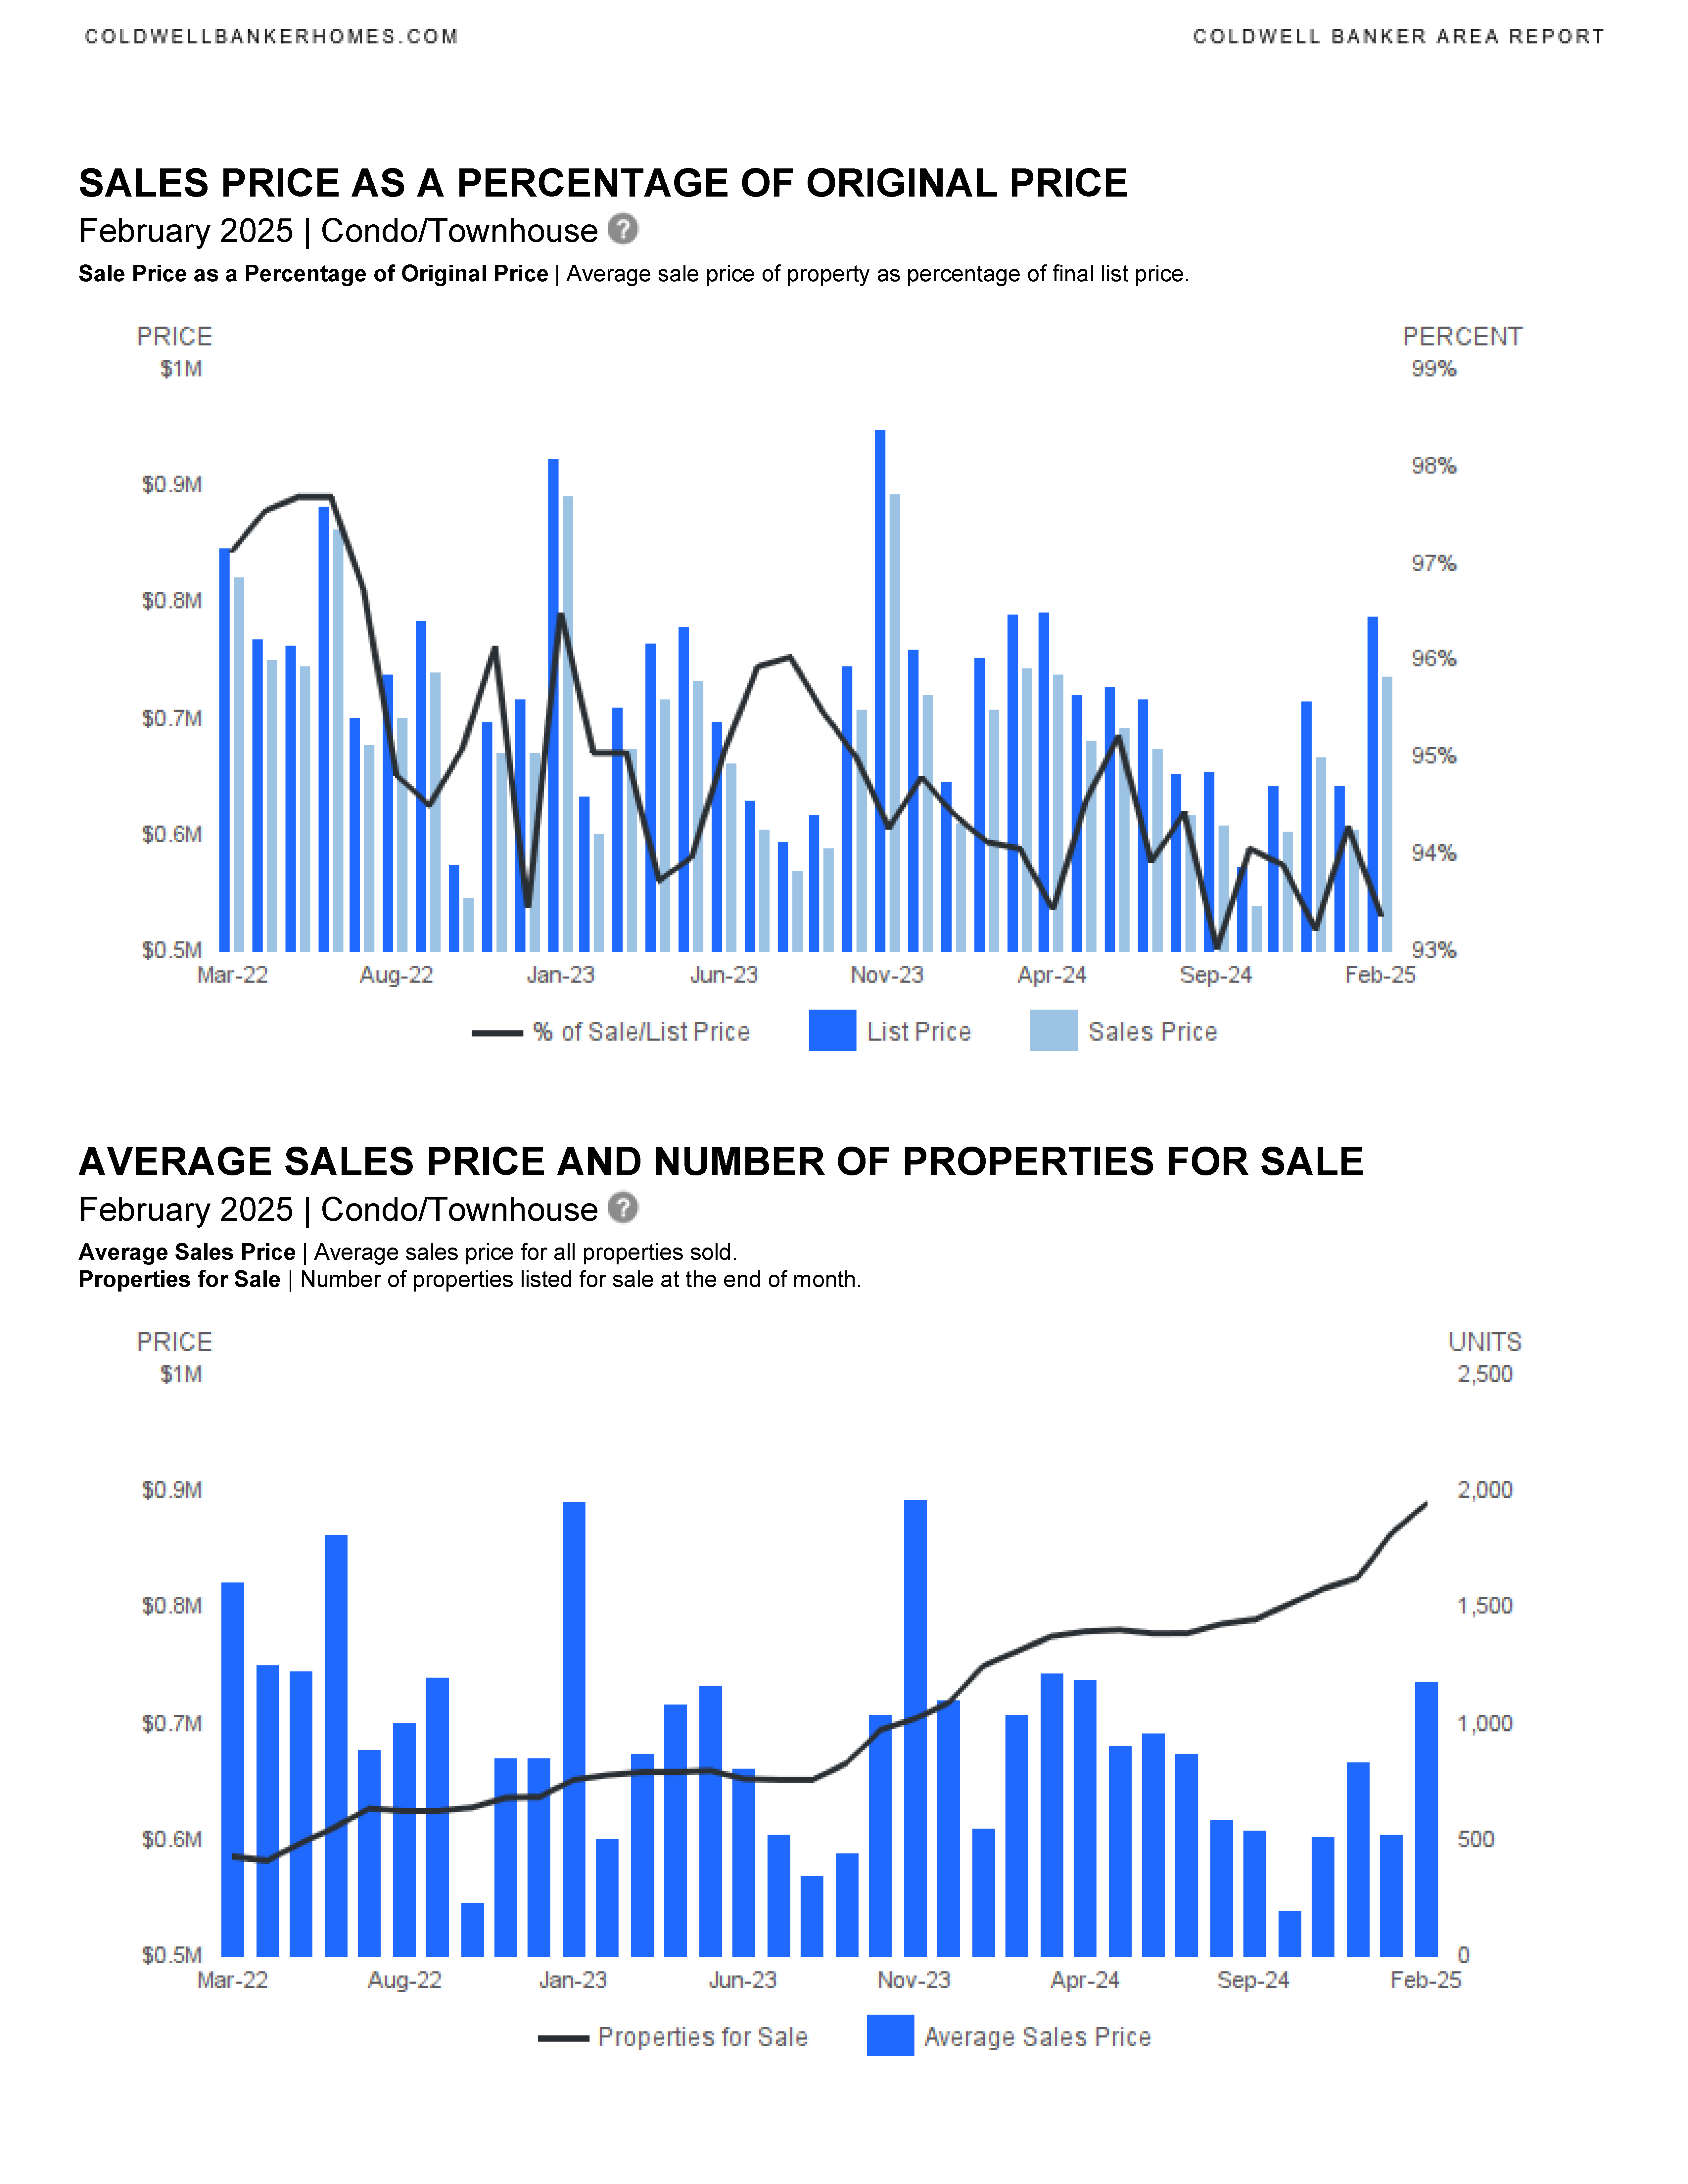
What is the difference between “Median Sales Price” and “Average Sales Price”?
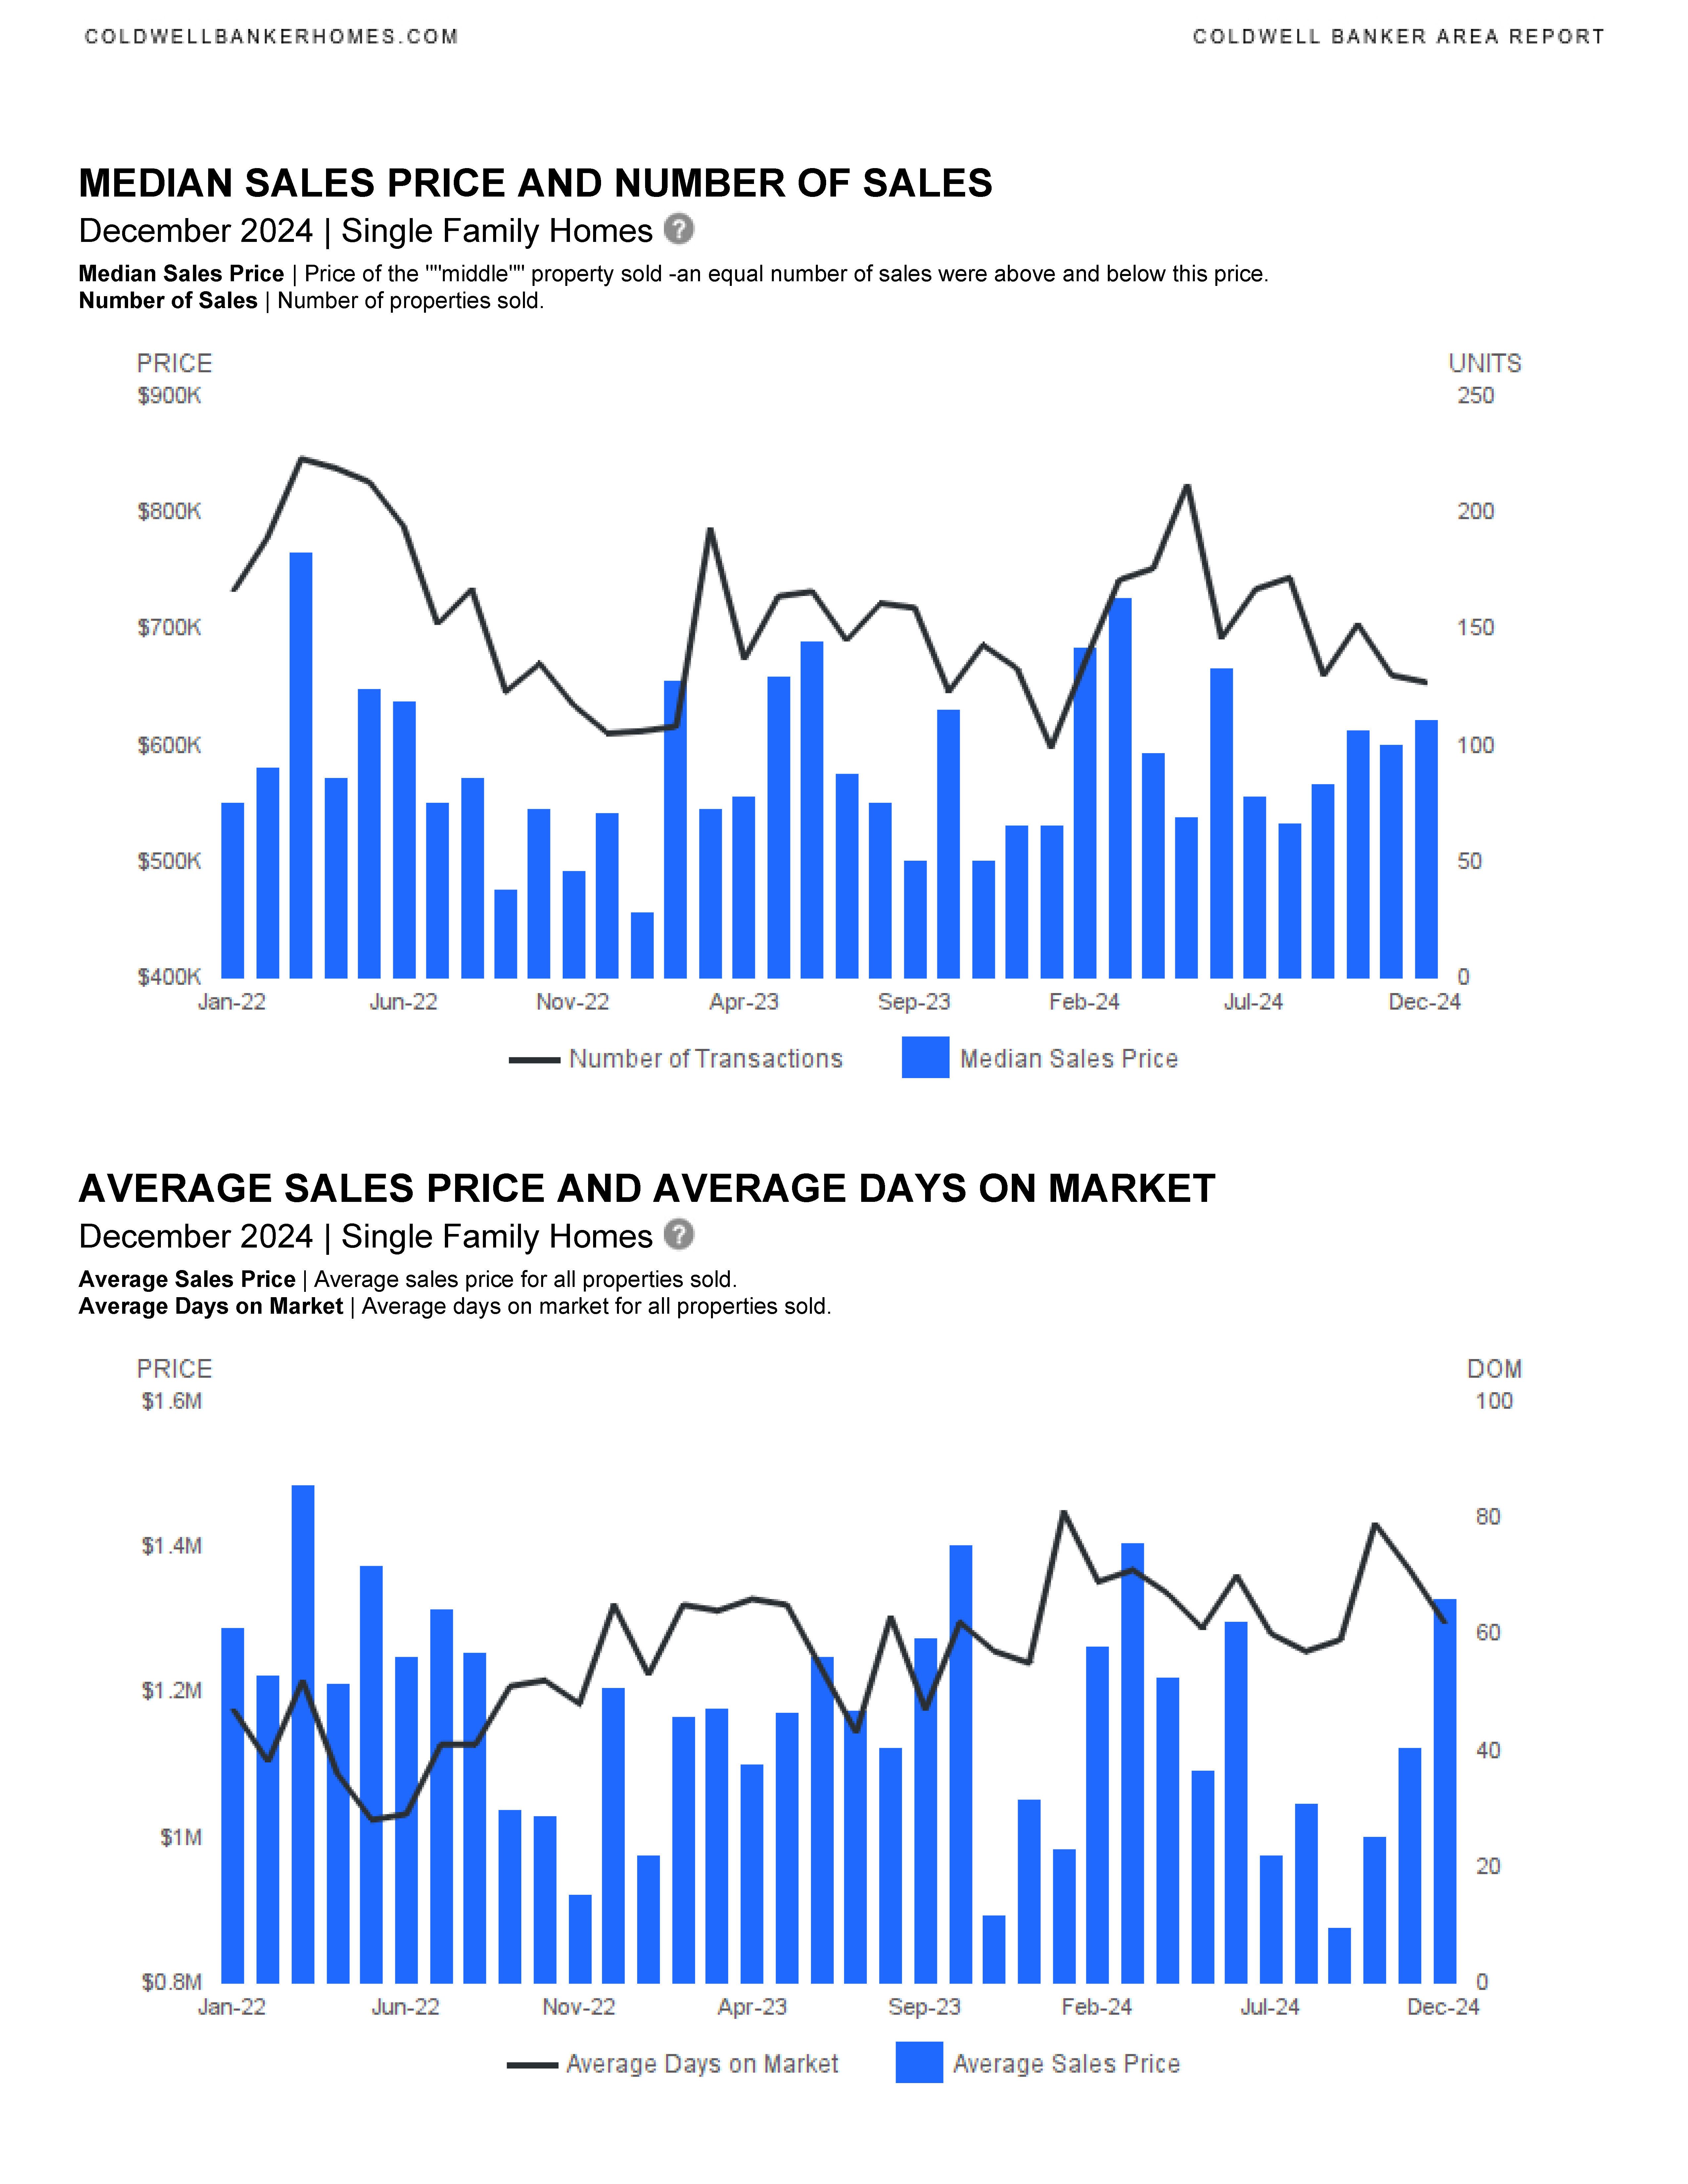
Median Sales Price | Price of the “”middle”” property sold -an equal number of sales were above and below this price.
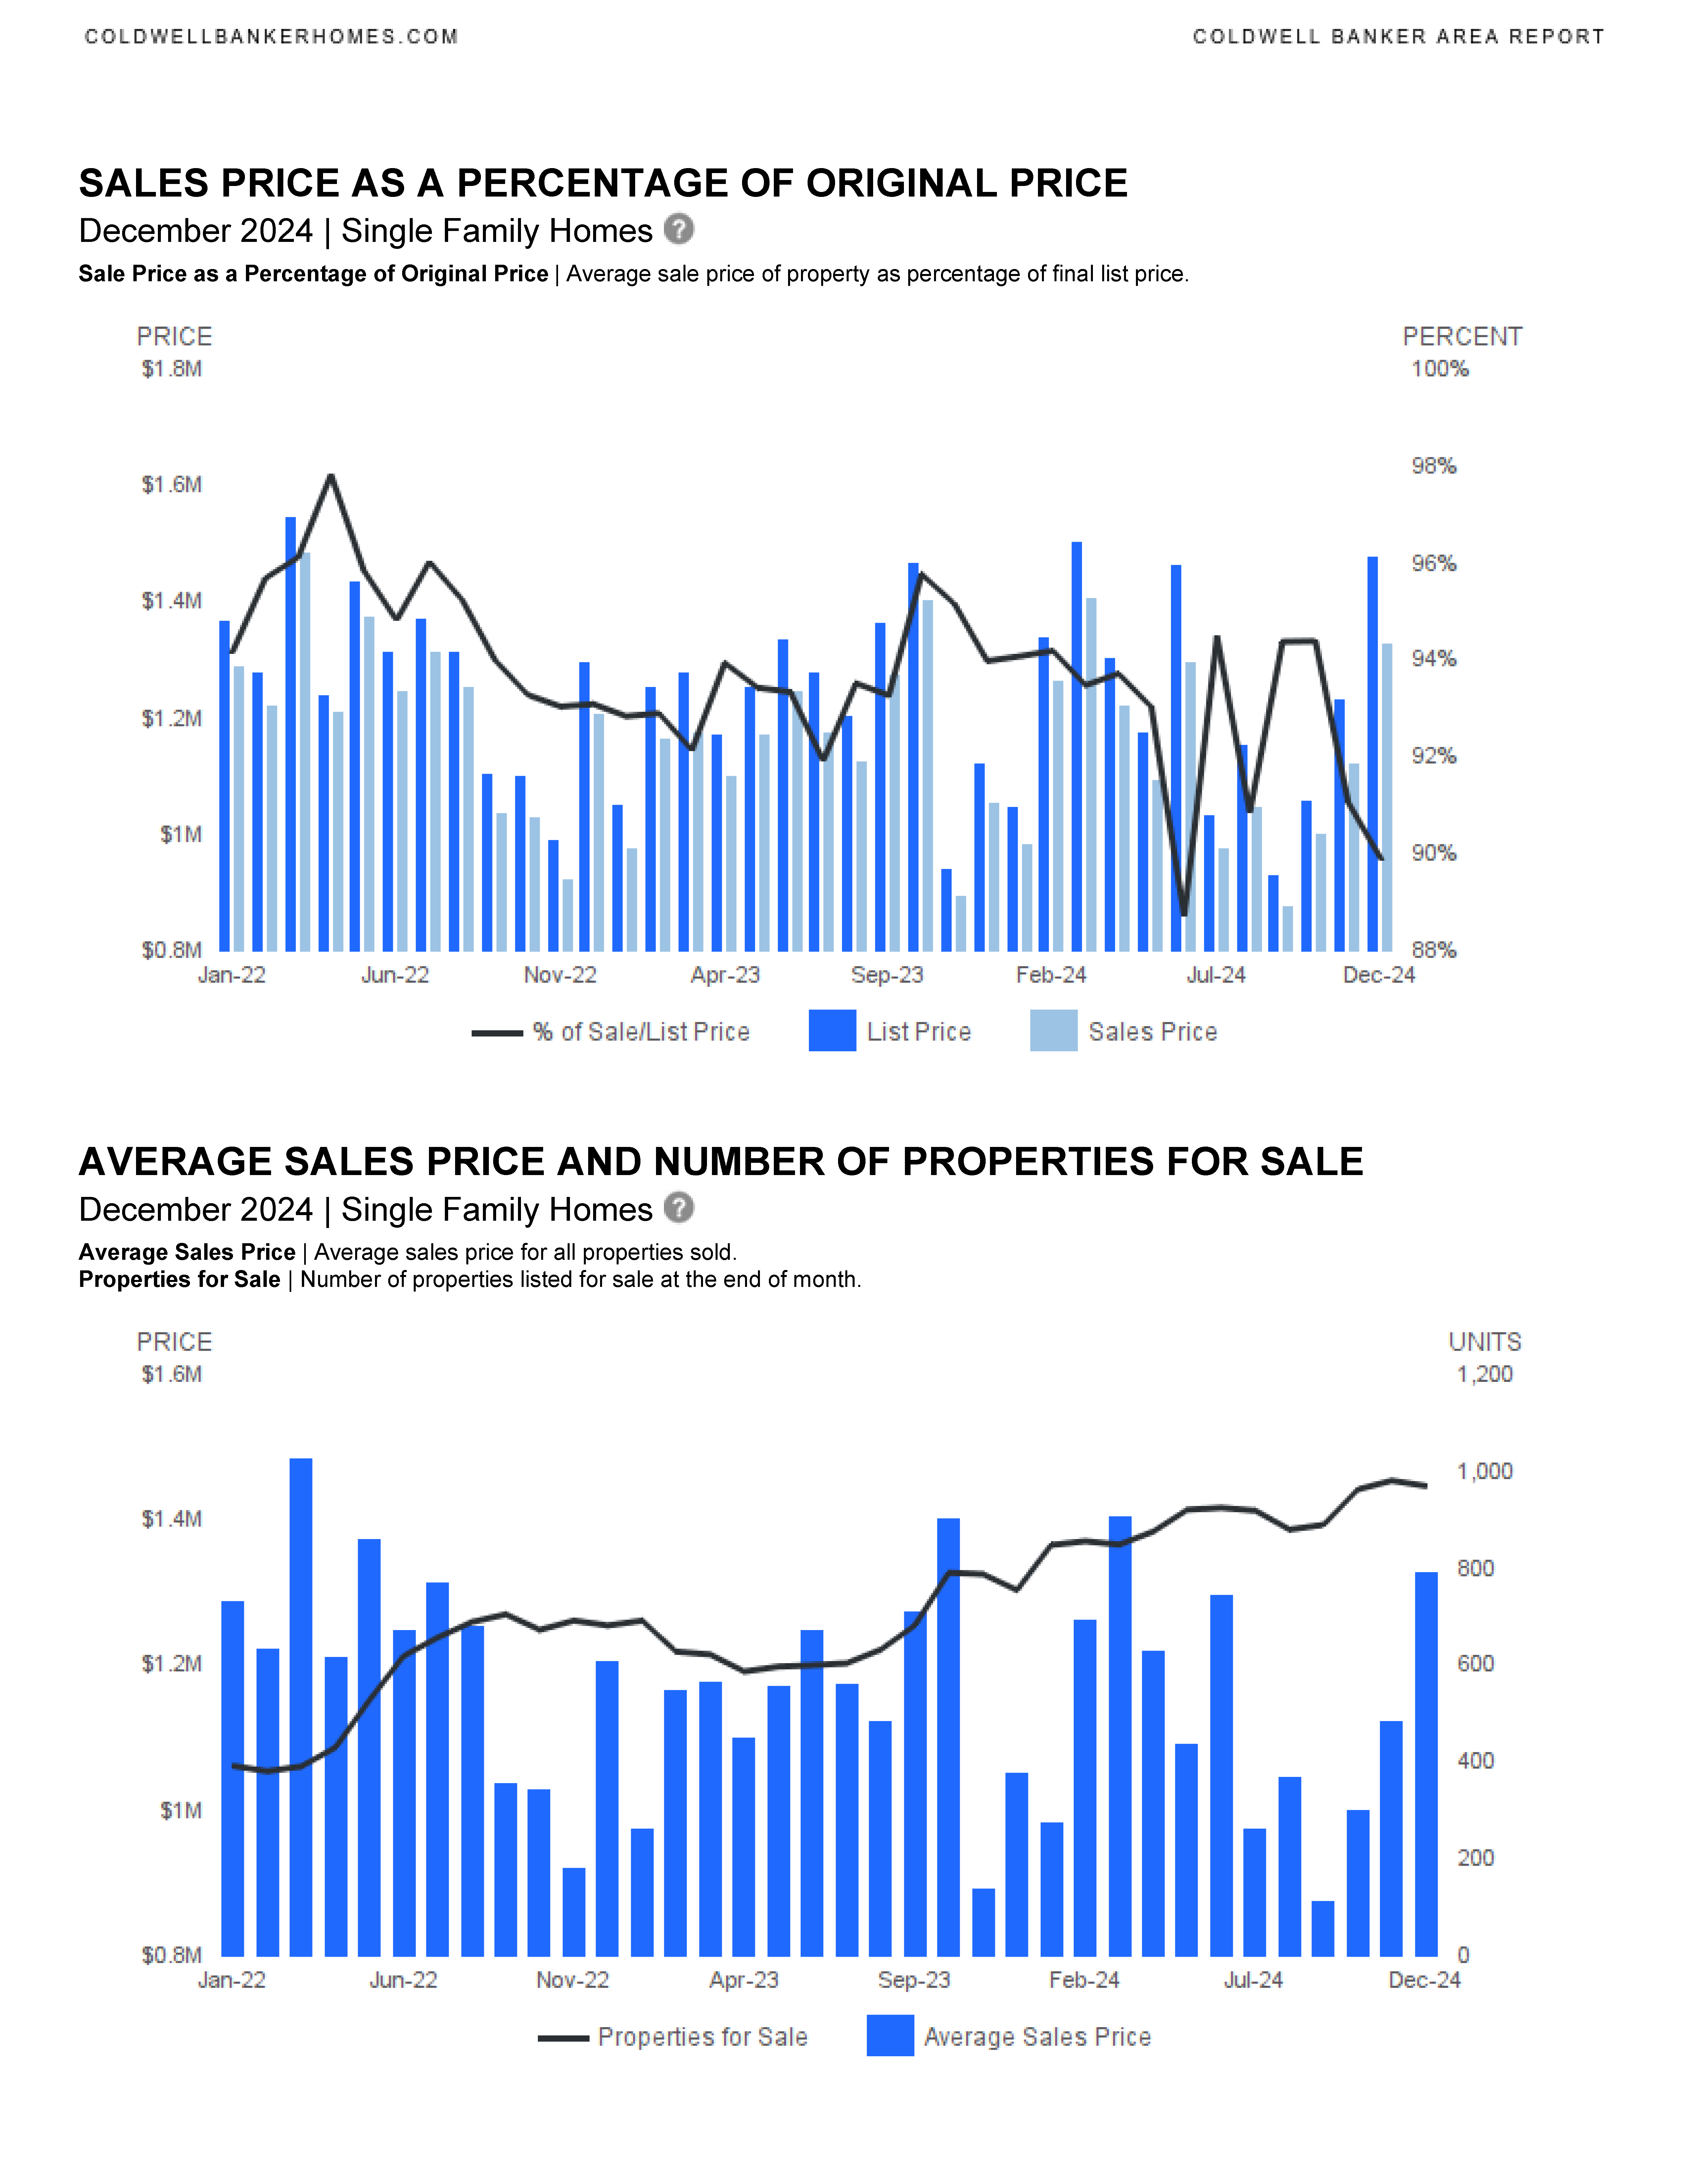
Average Sales Price | Average sales price for all properties sold.
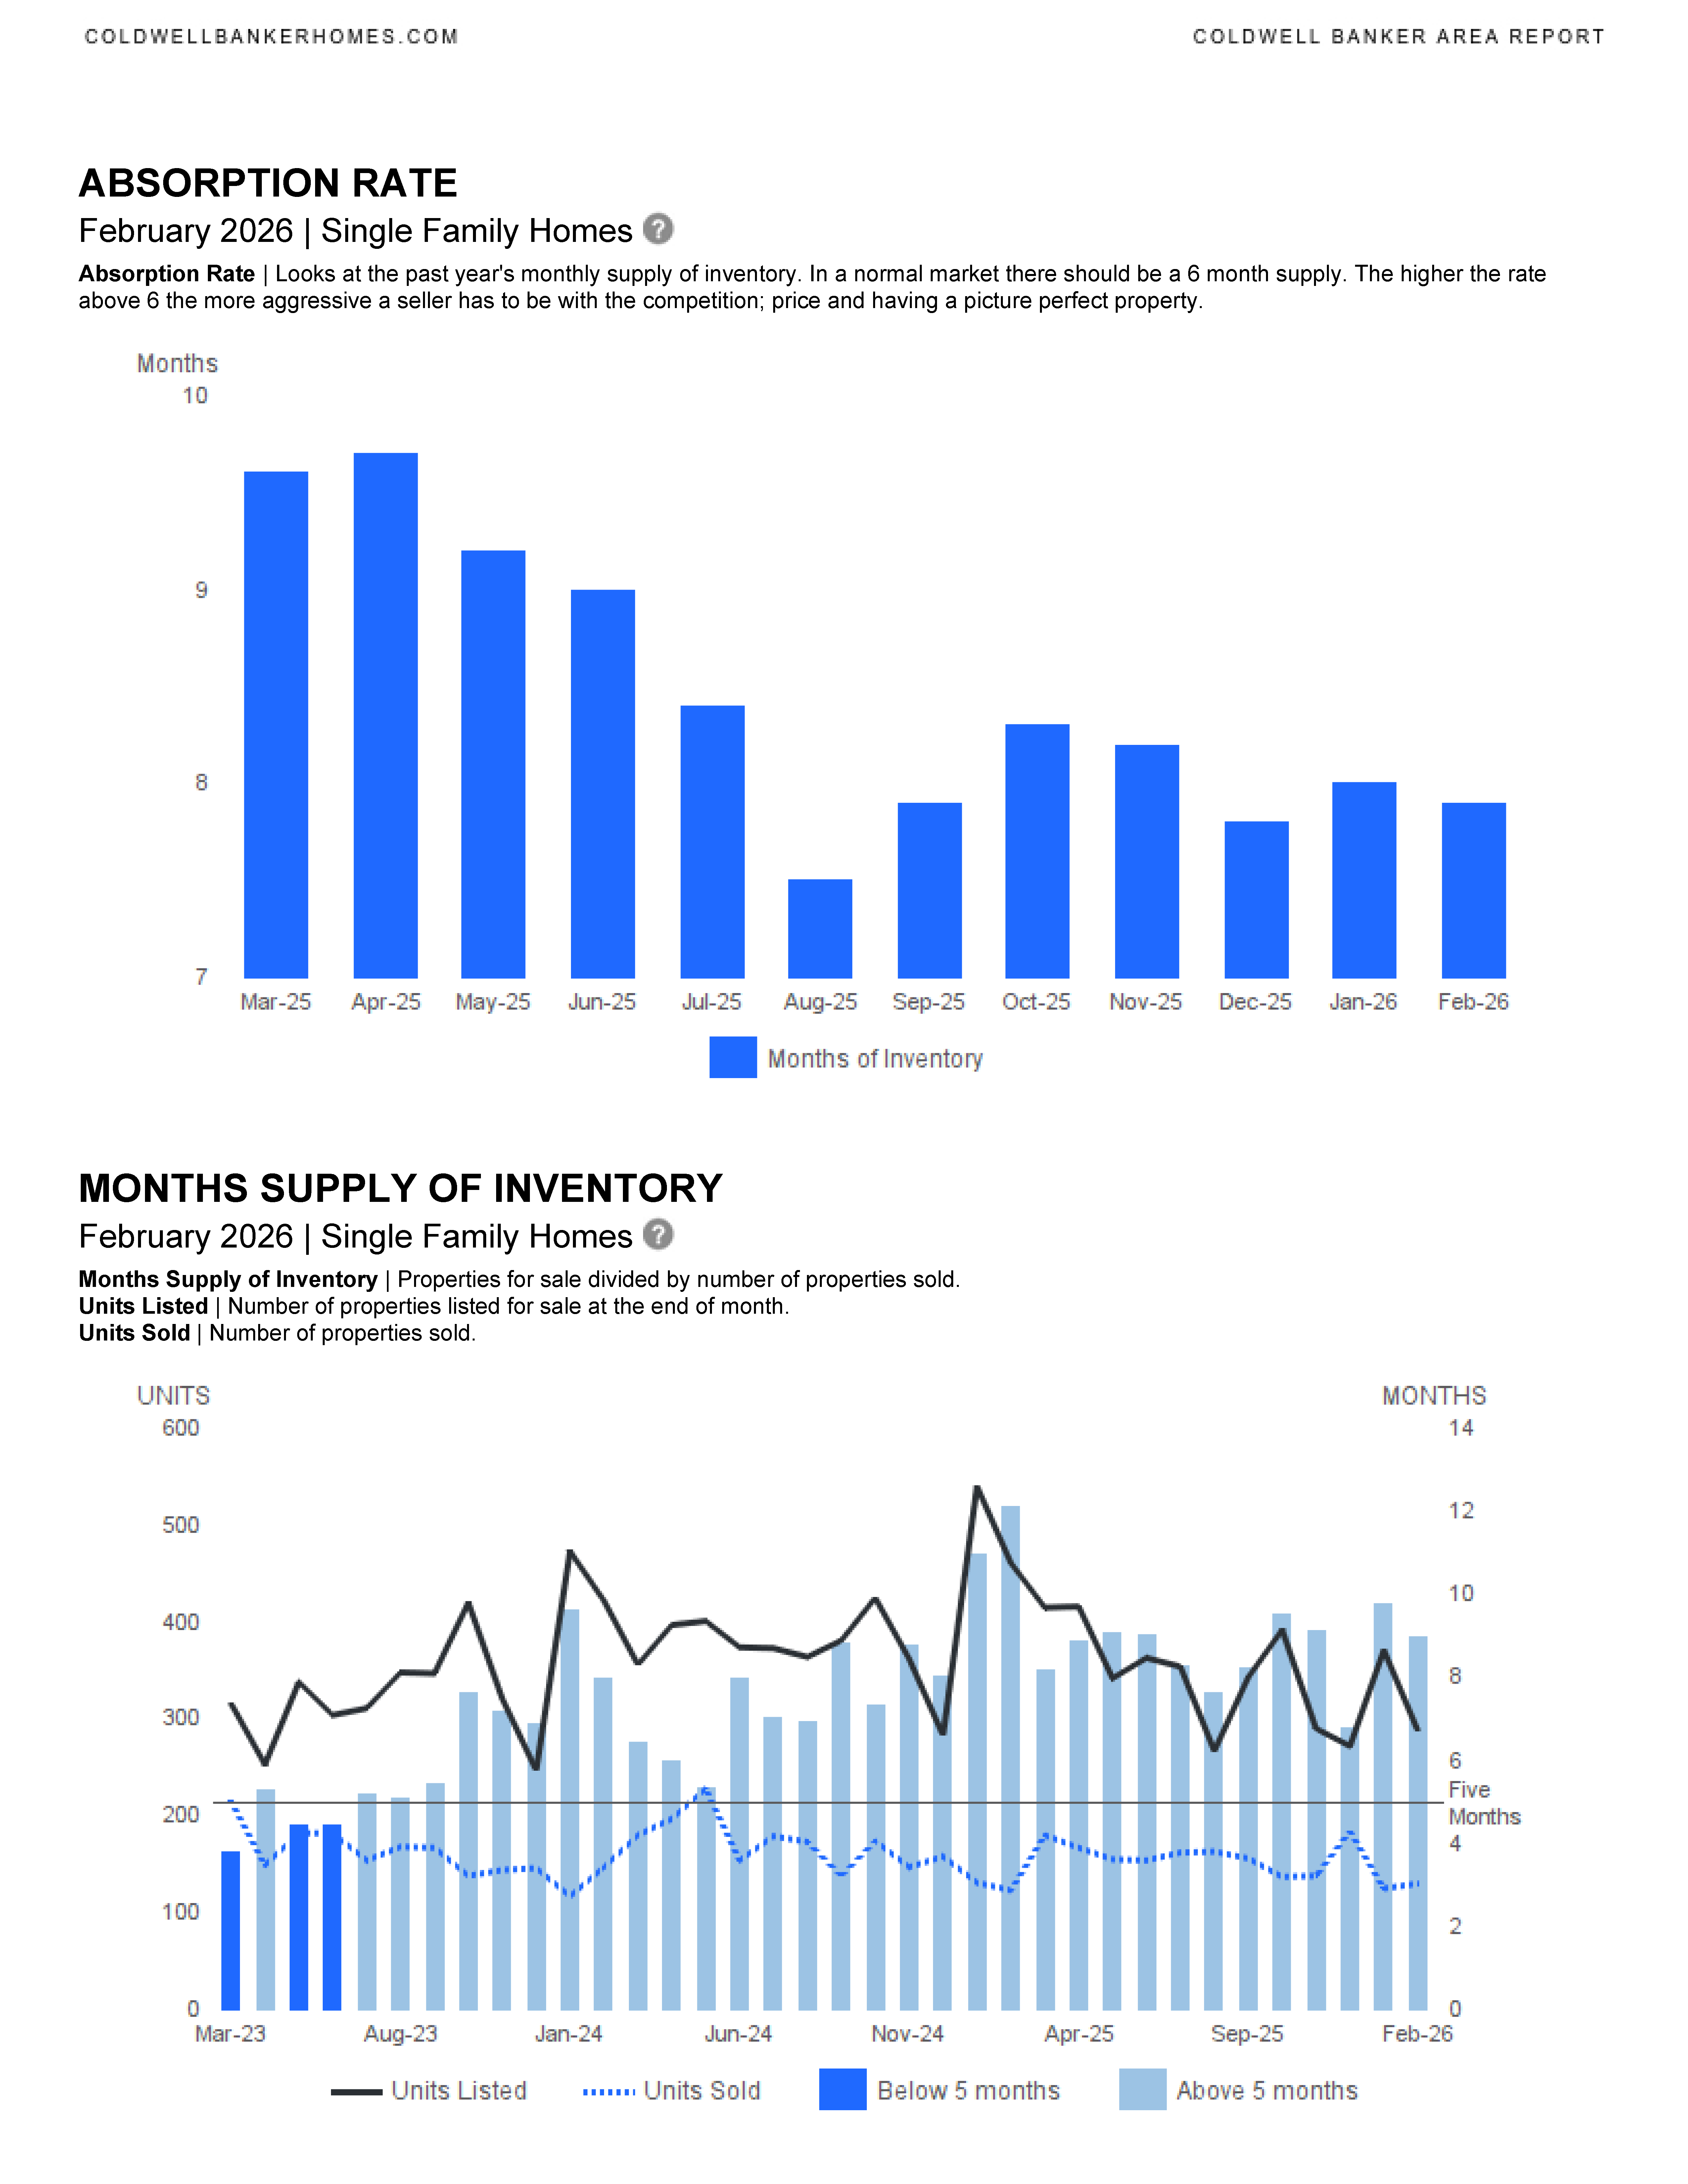
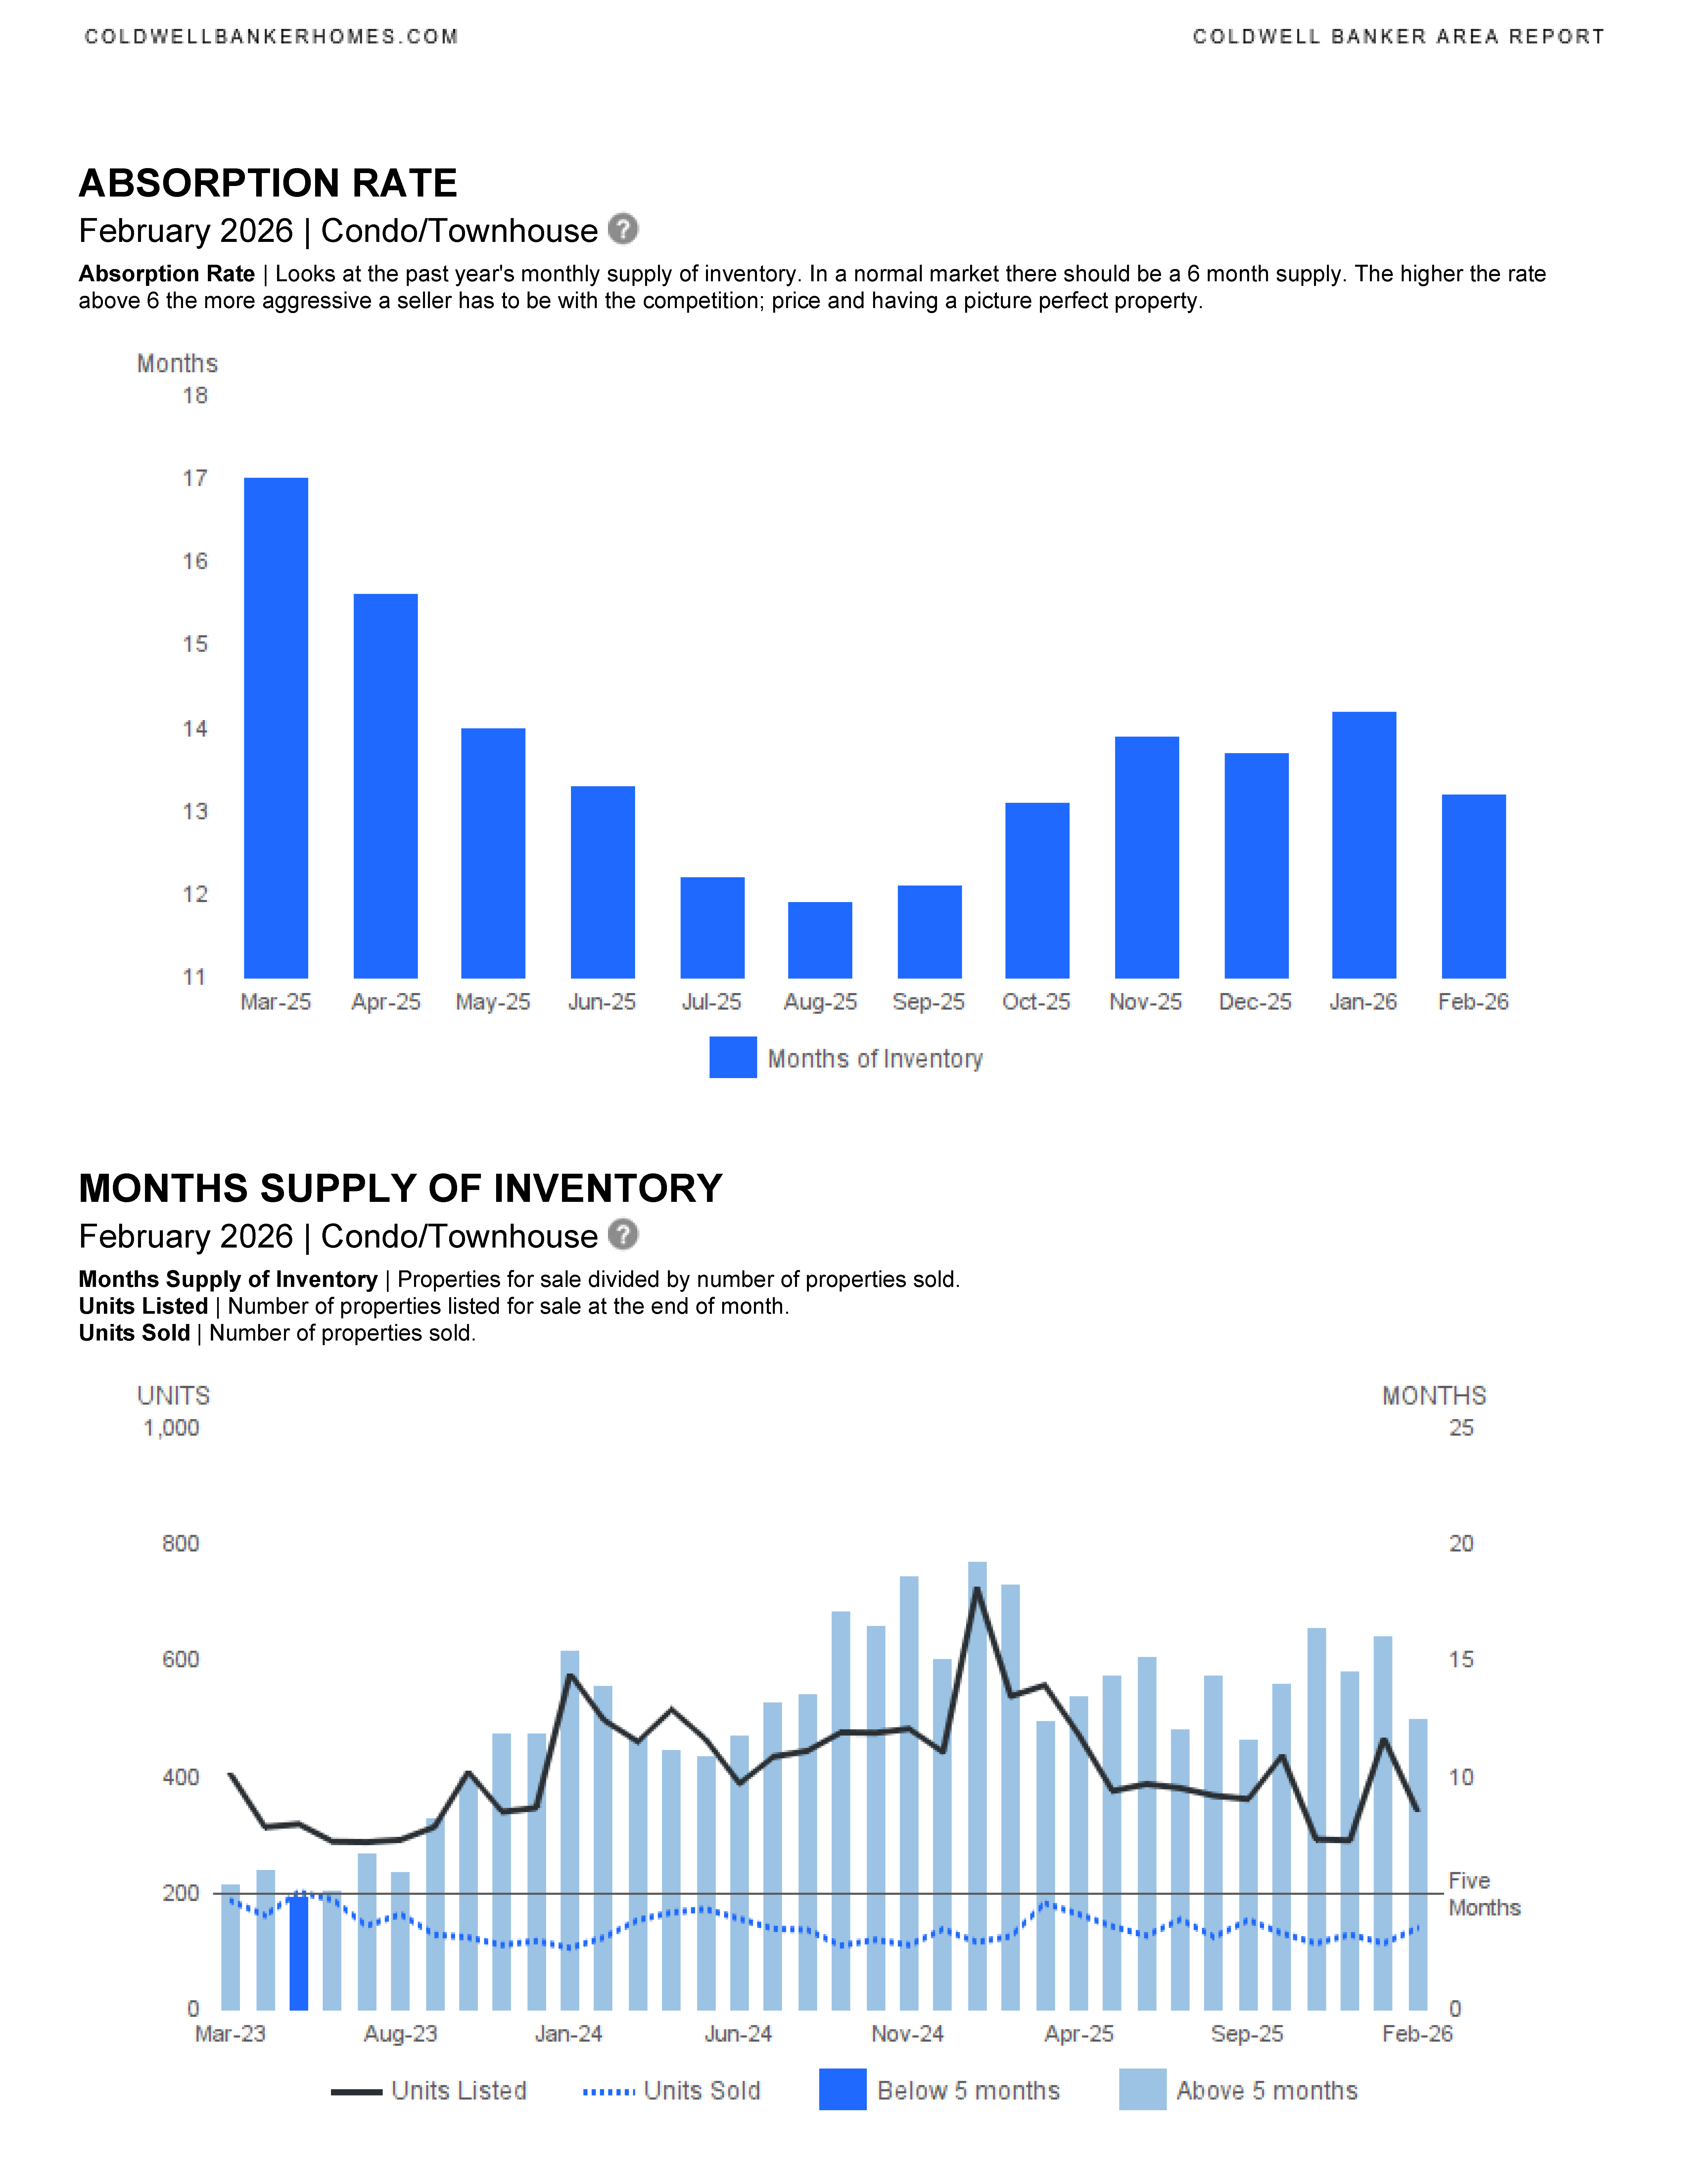
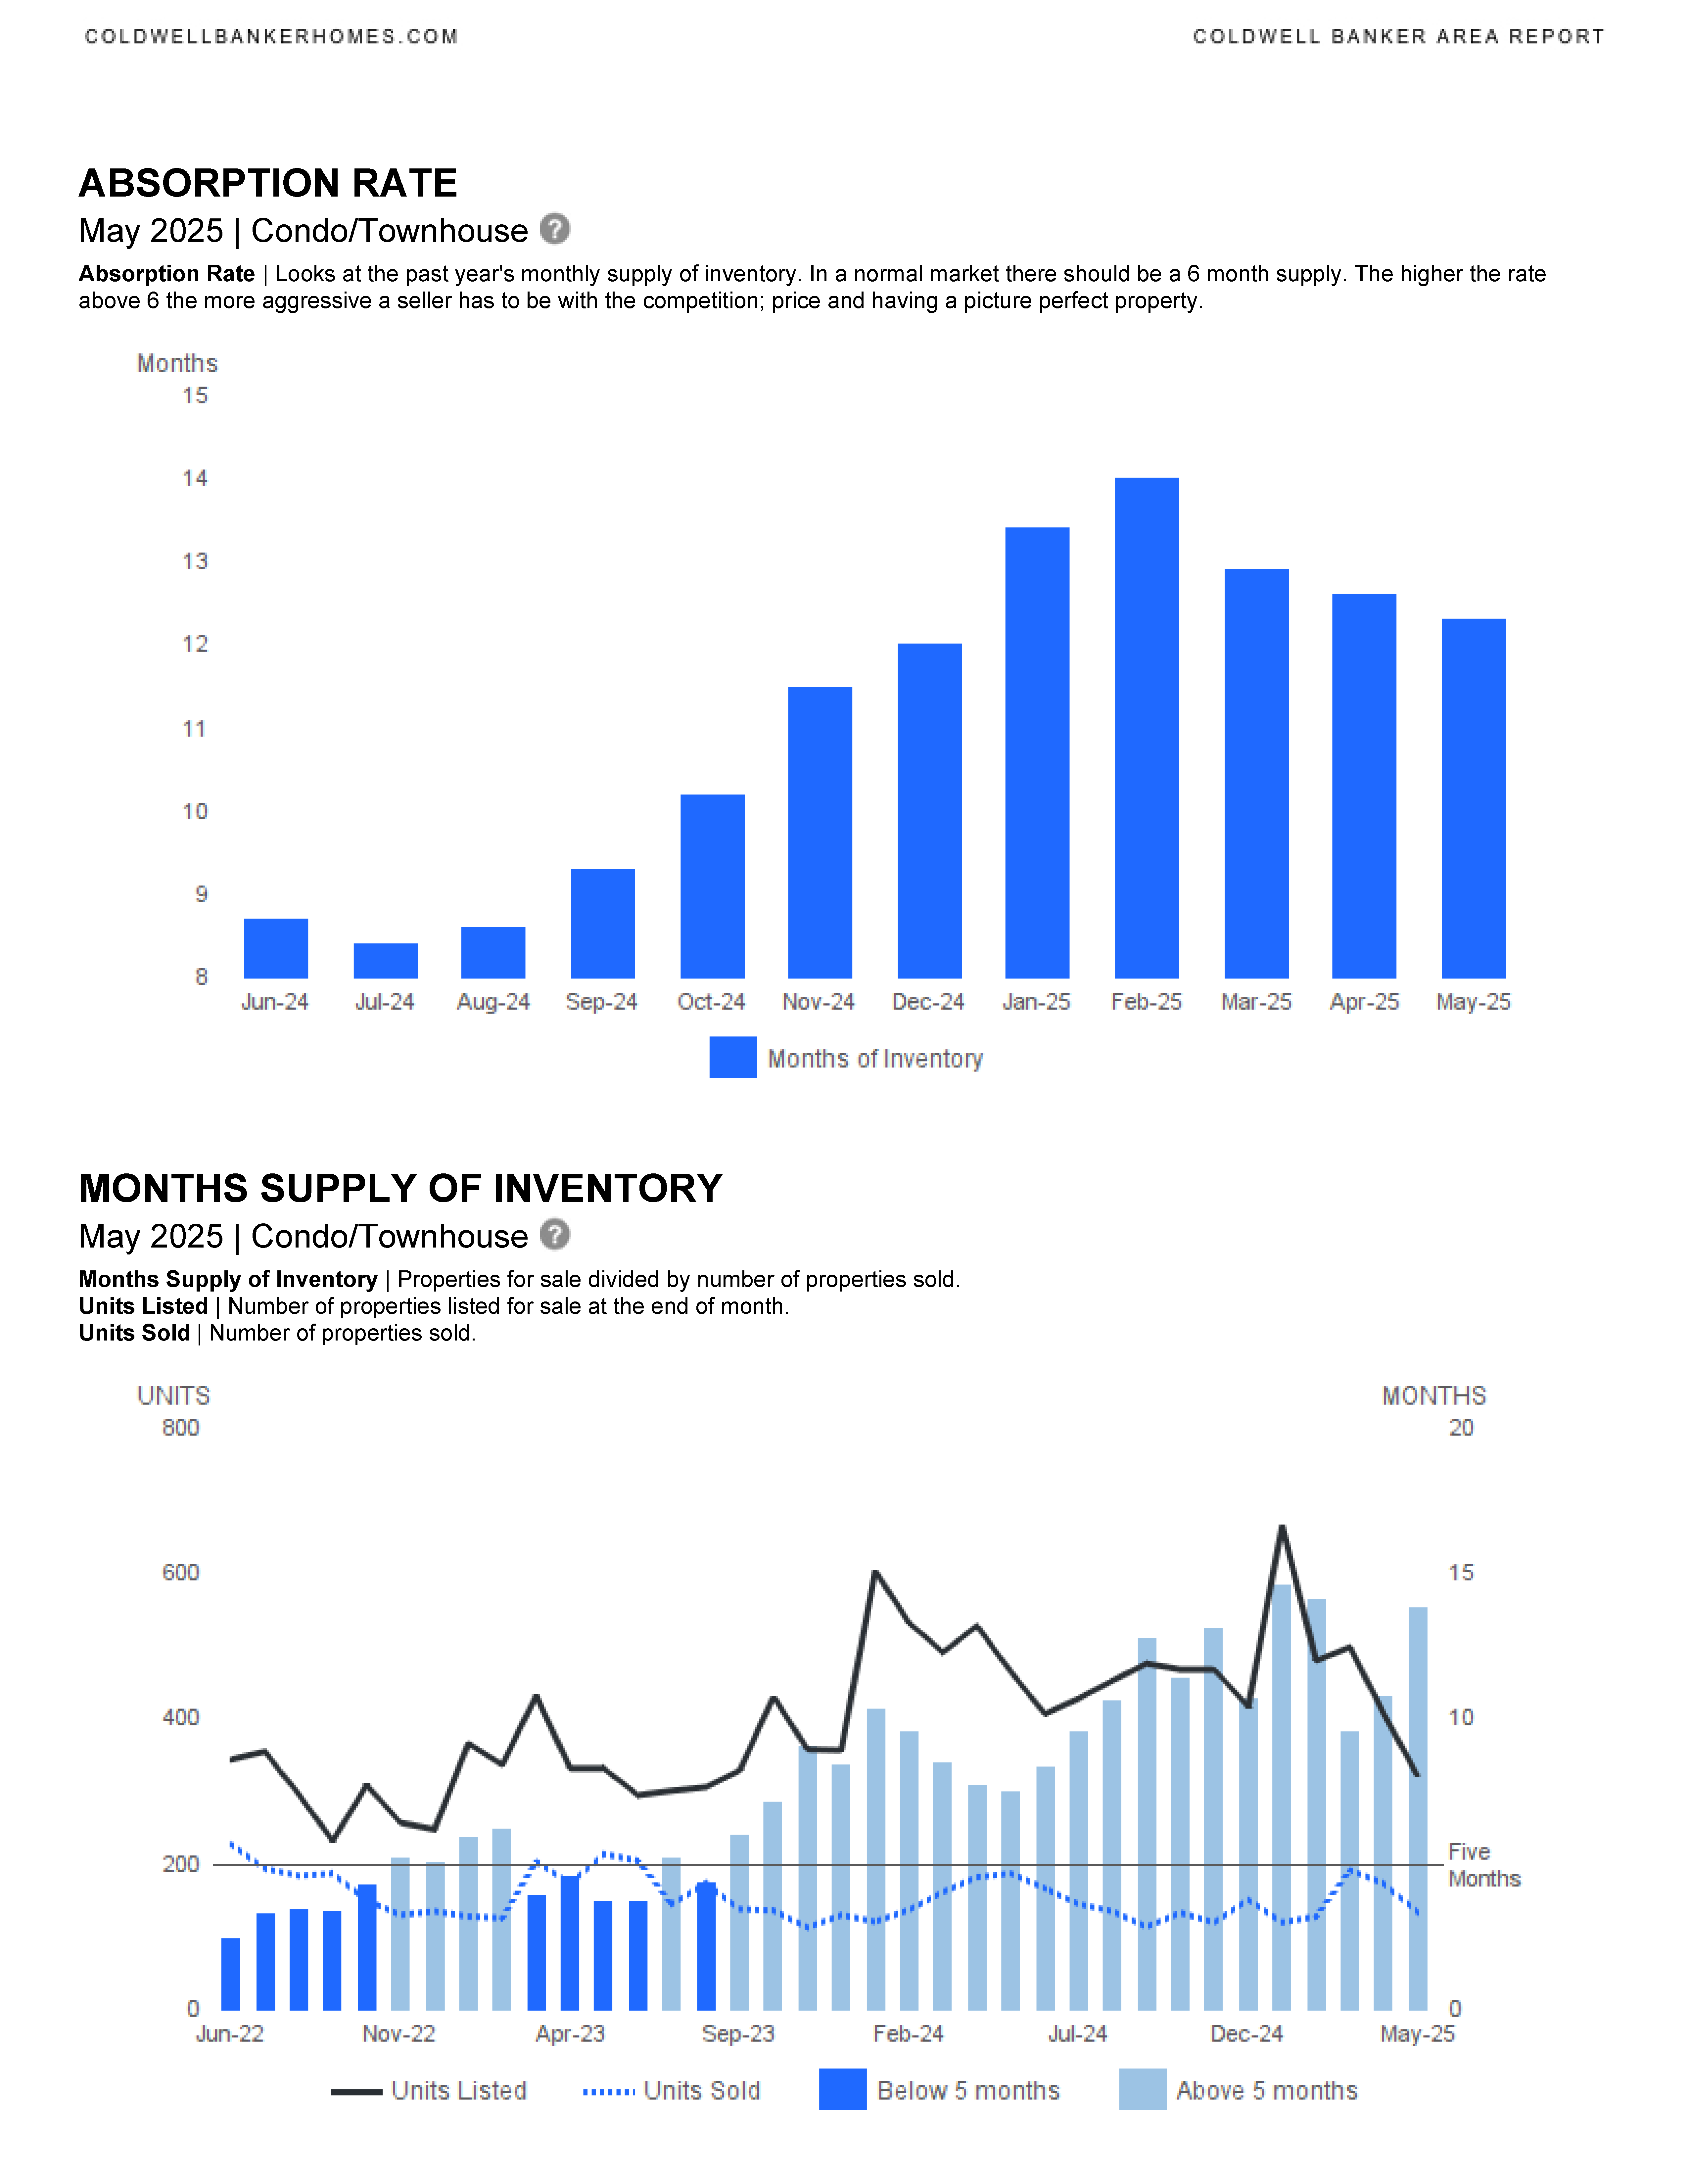
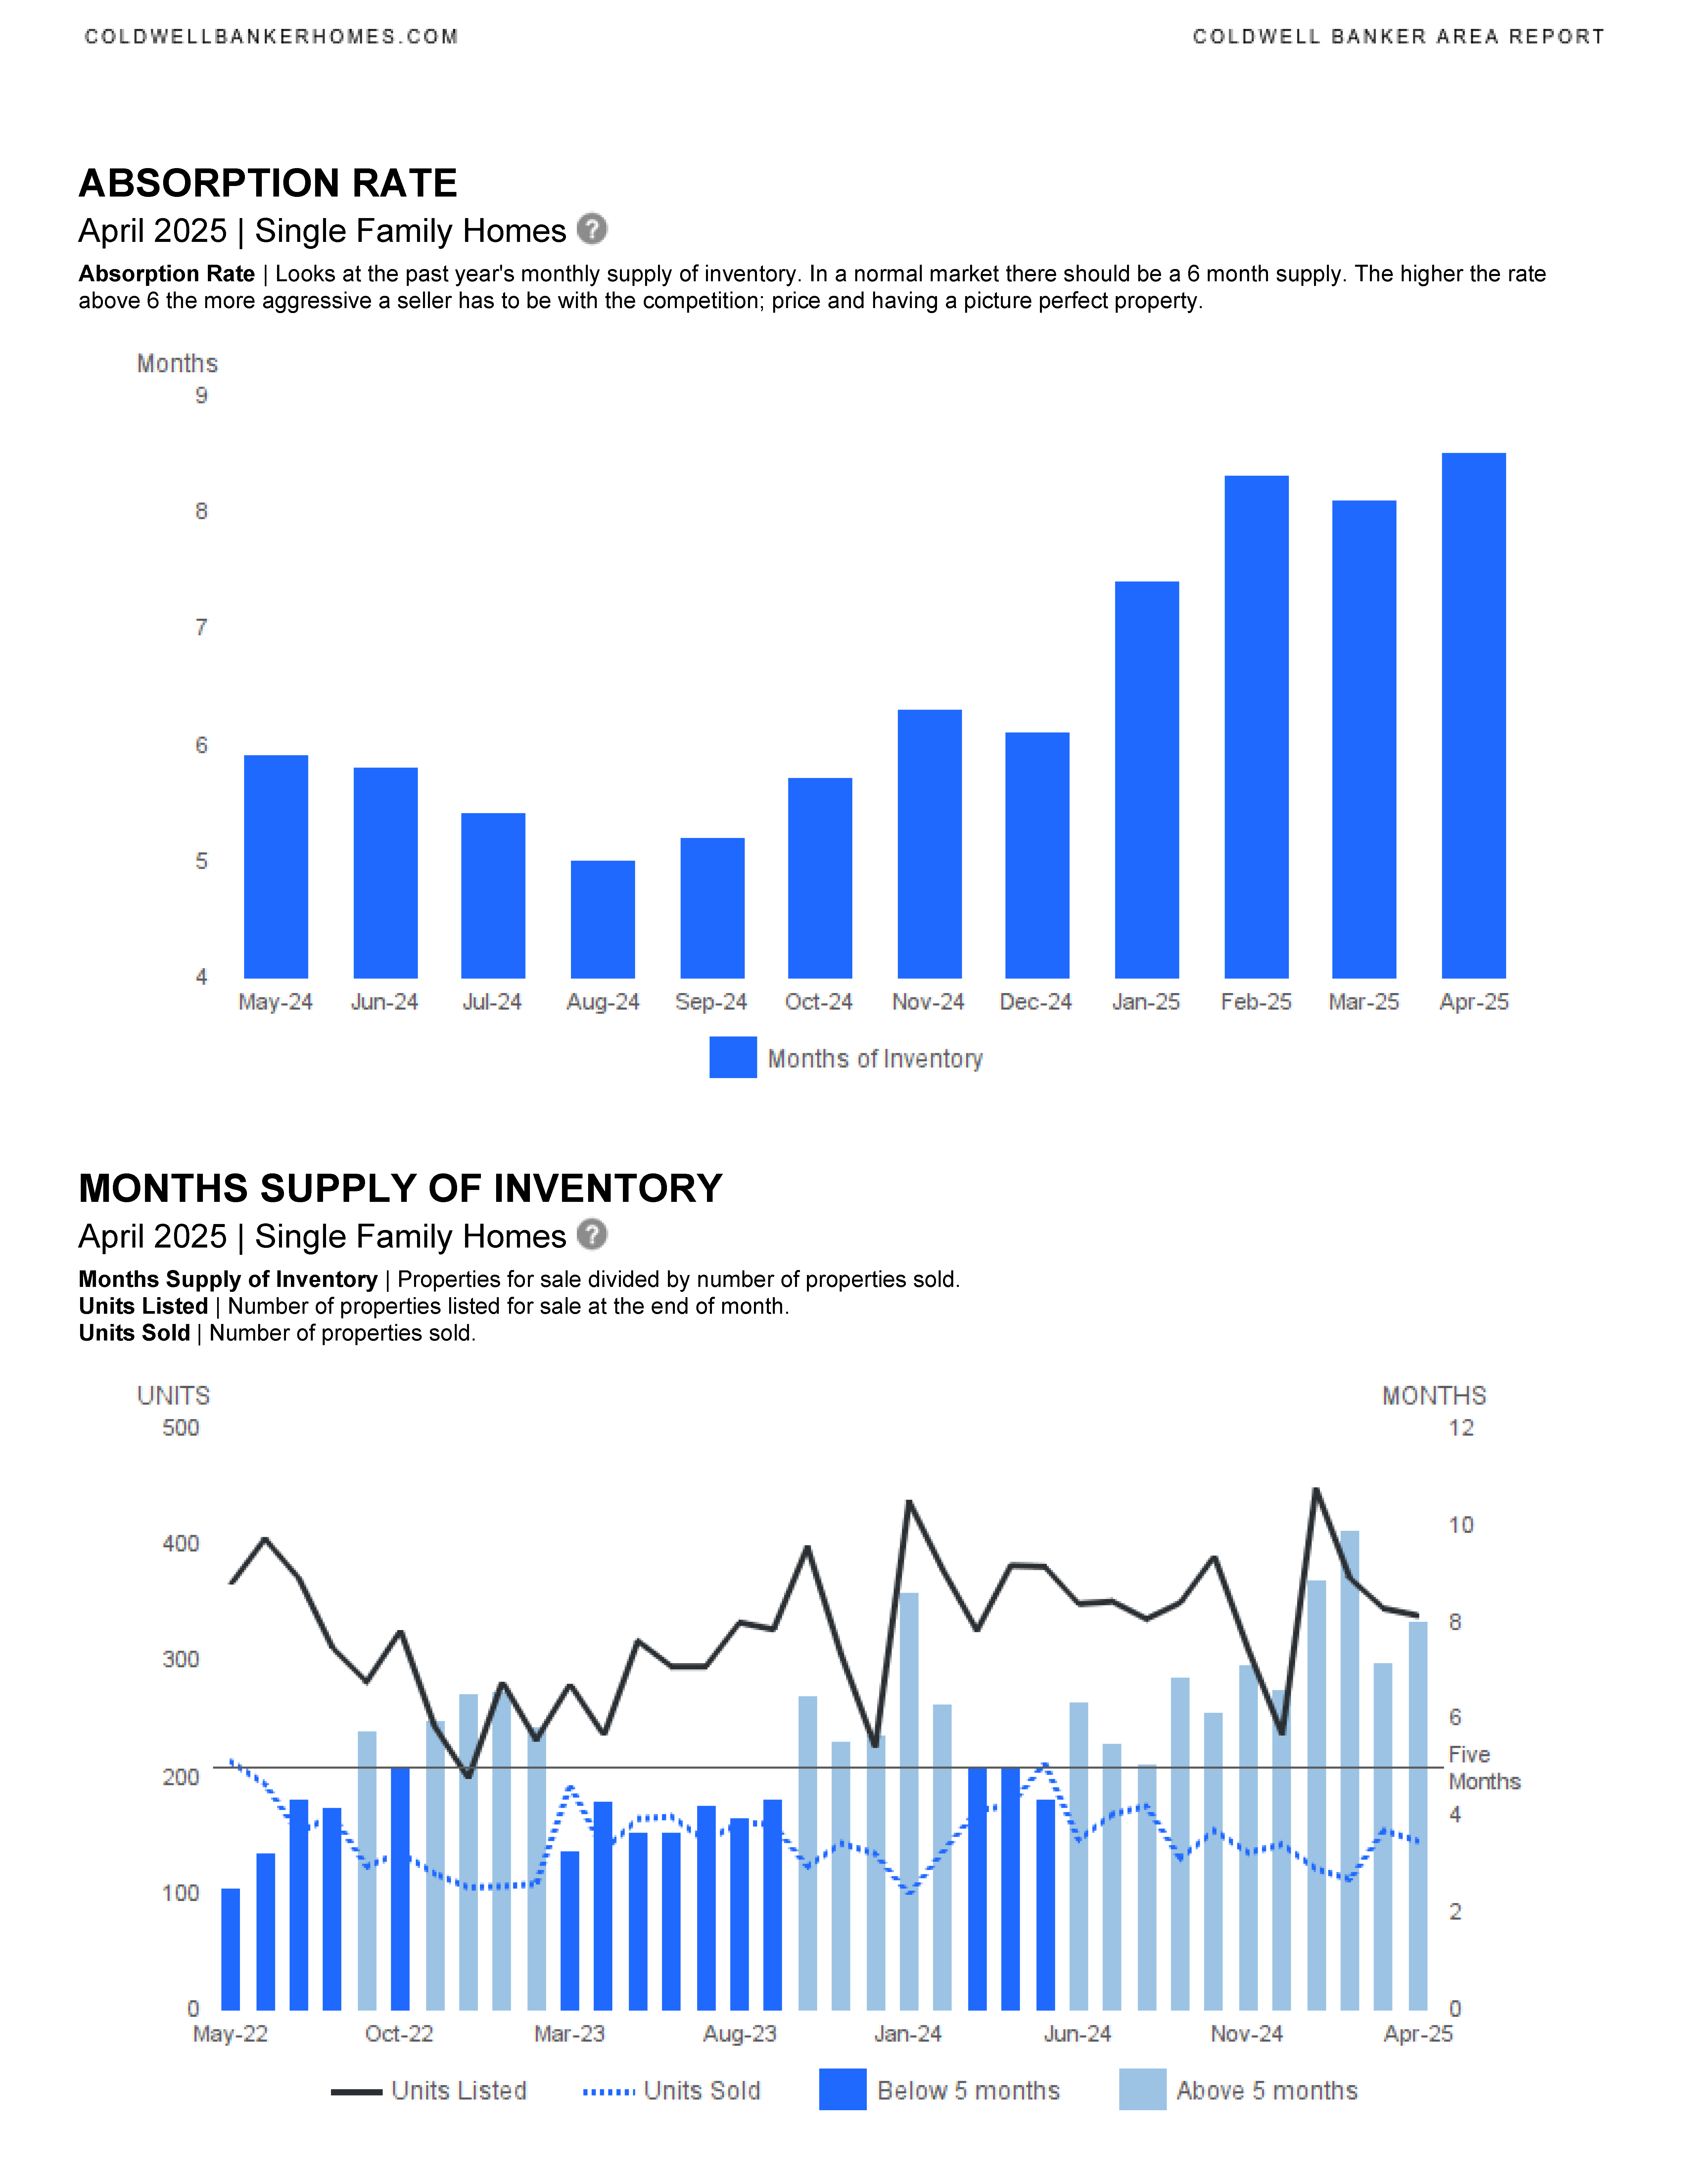
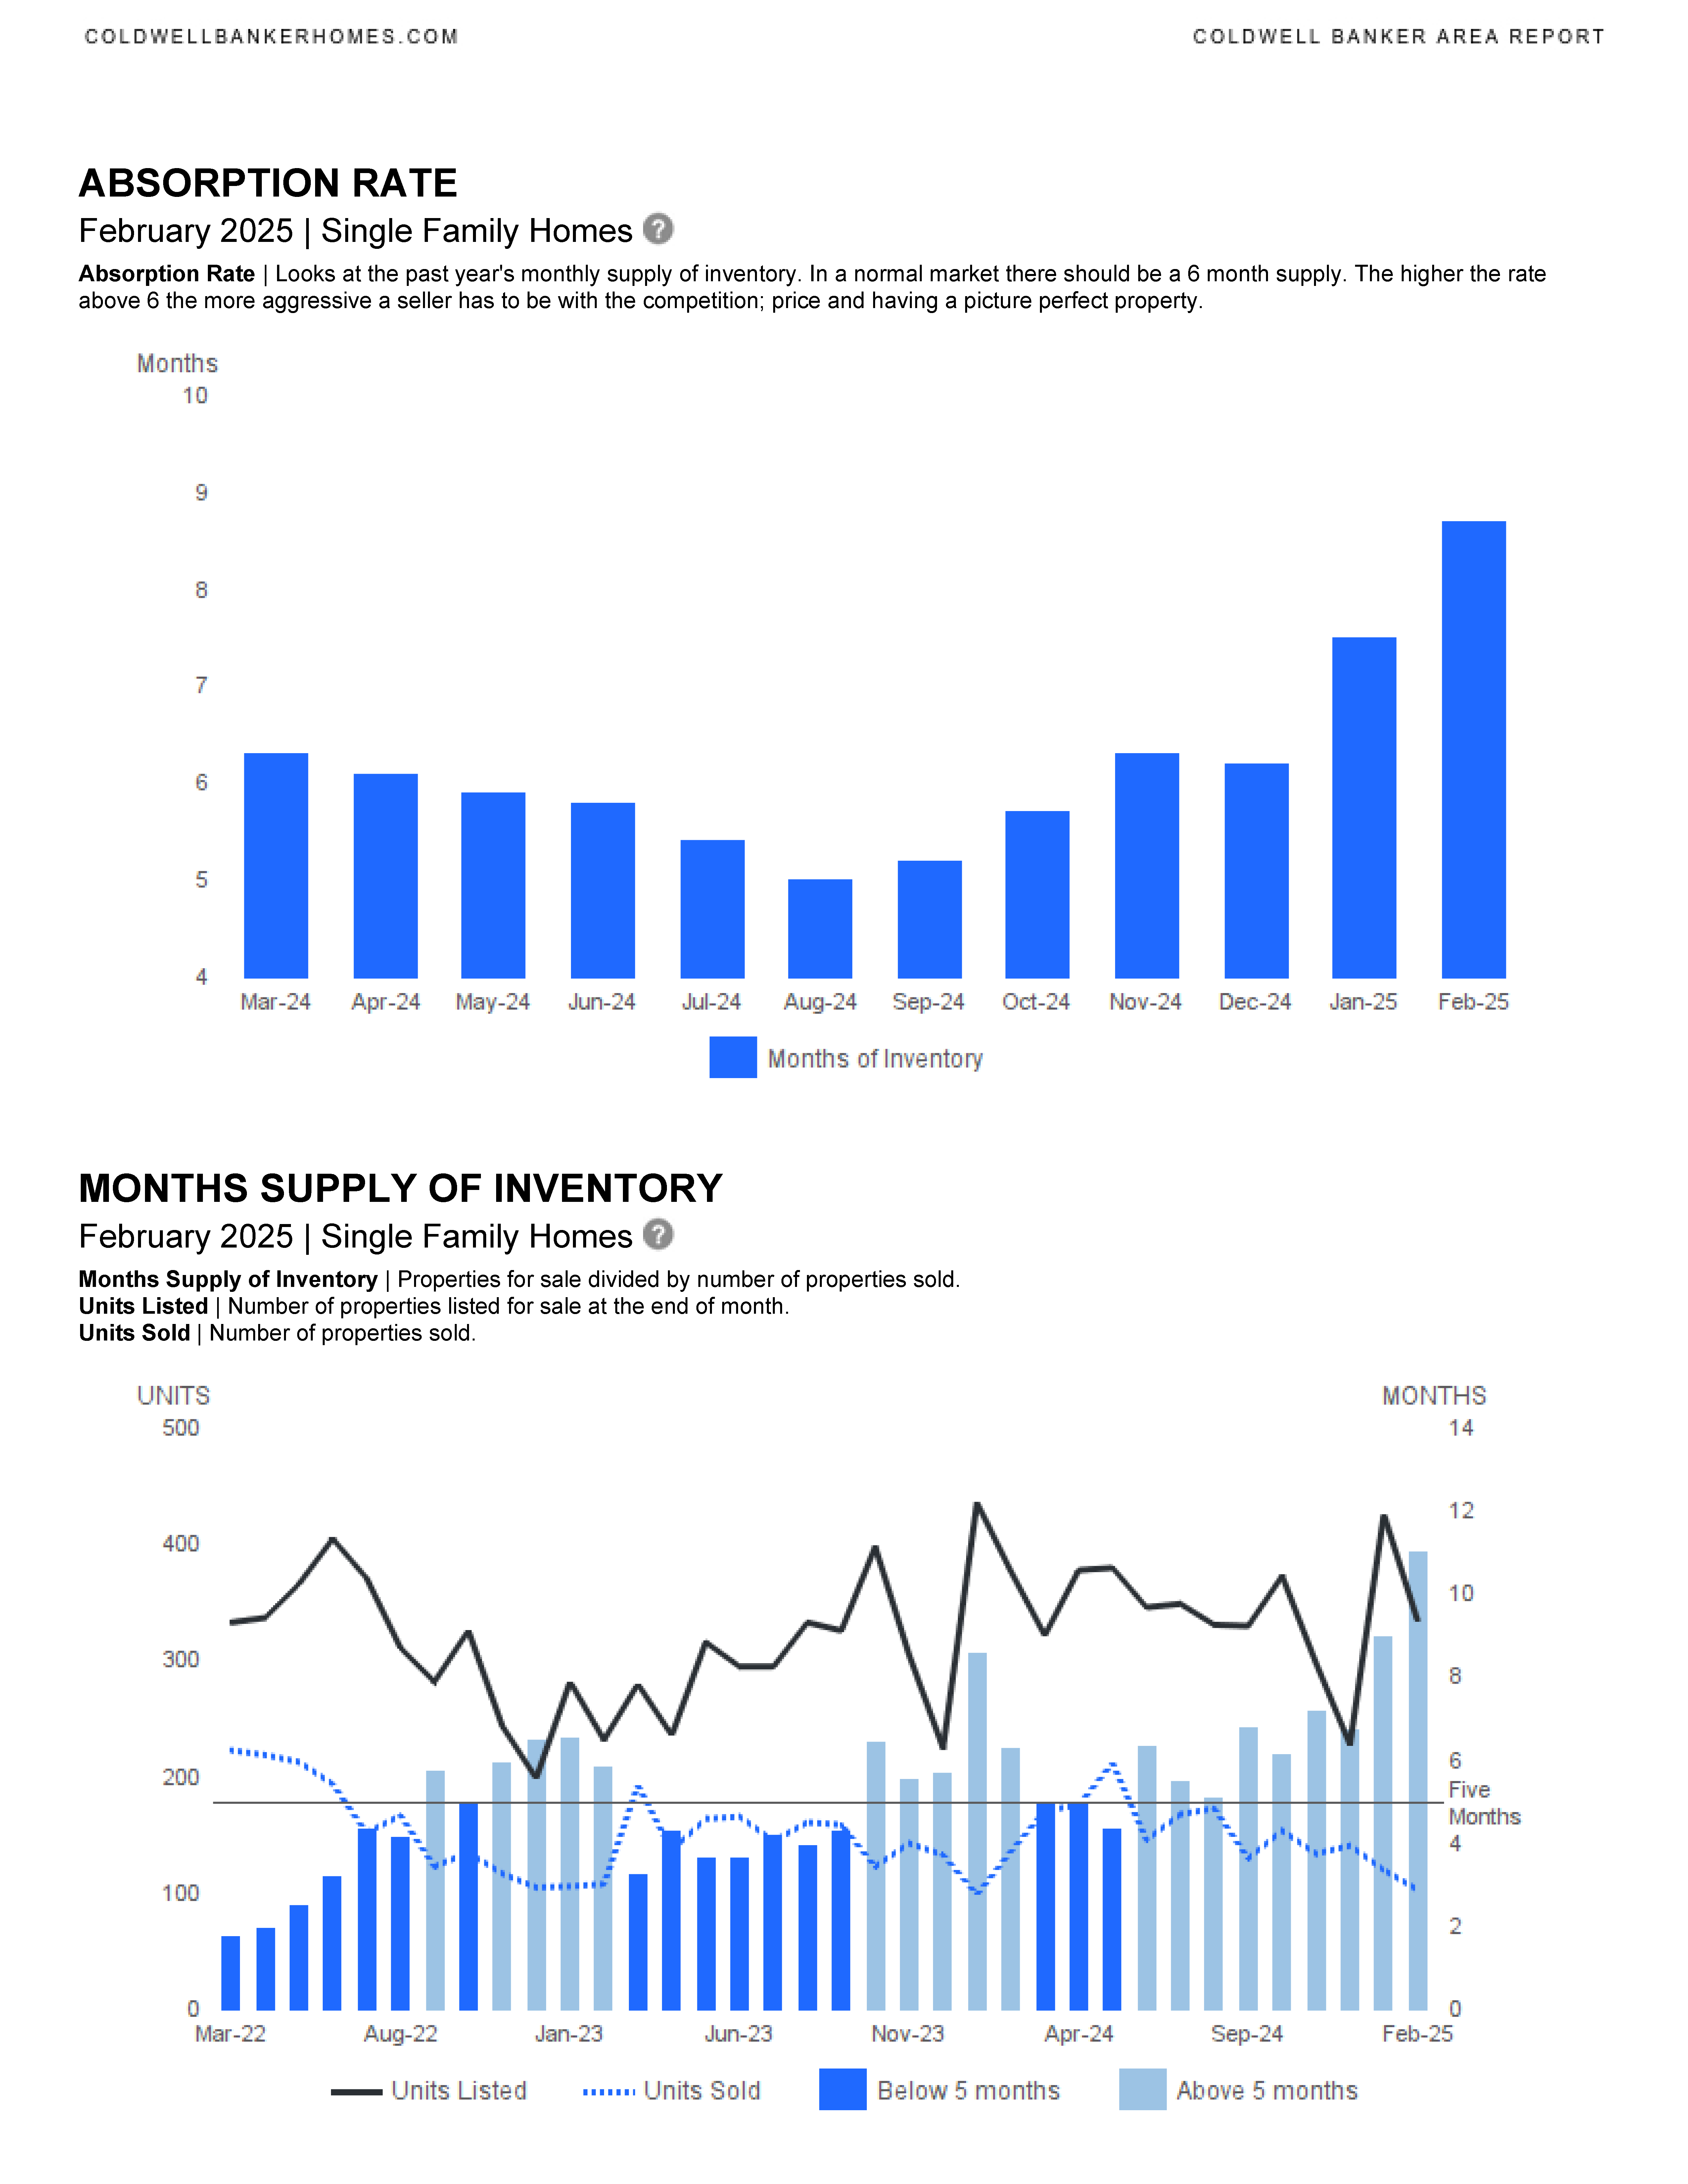
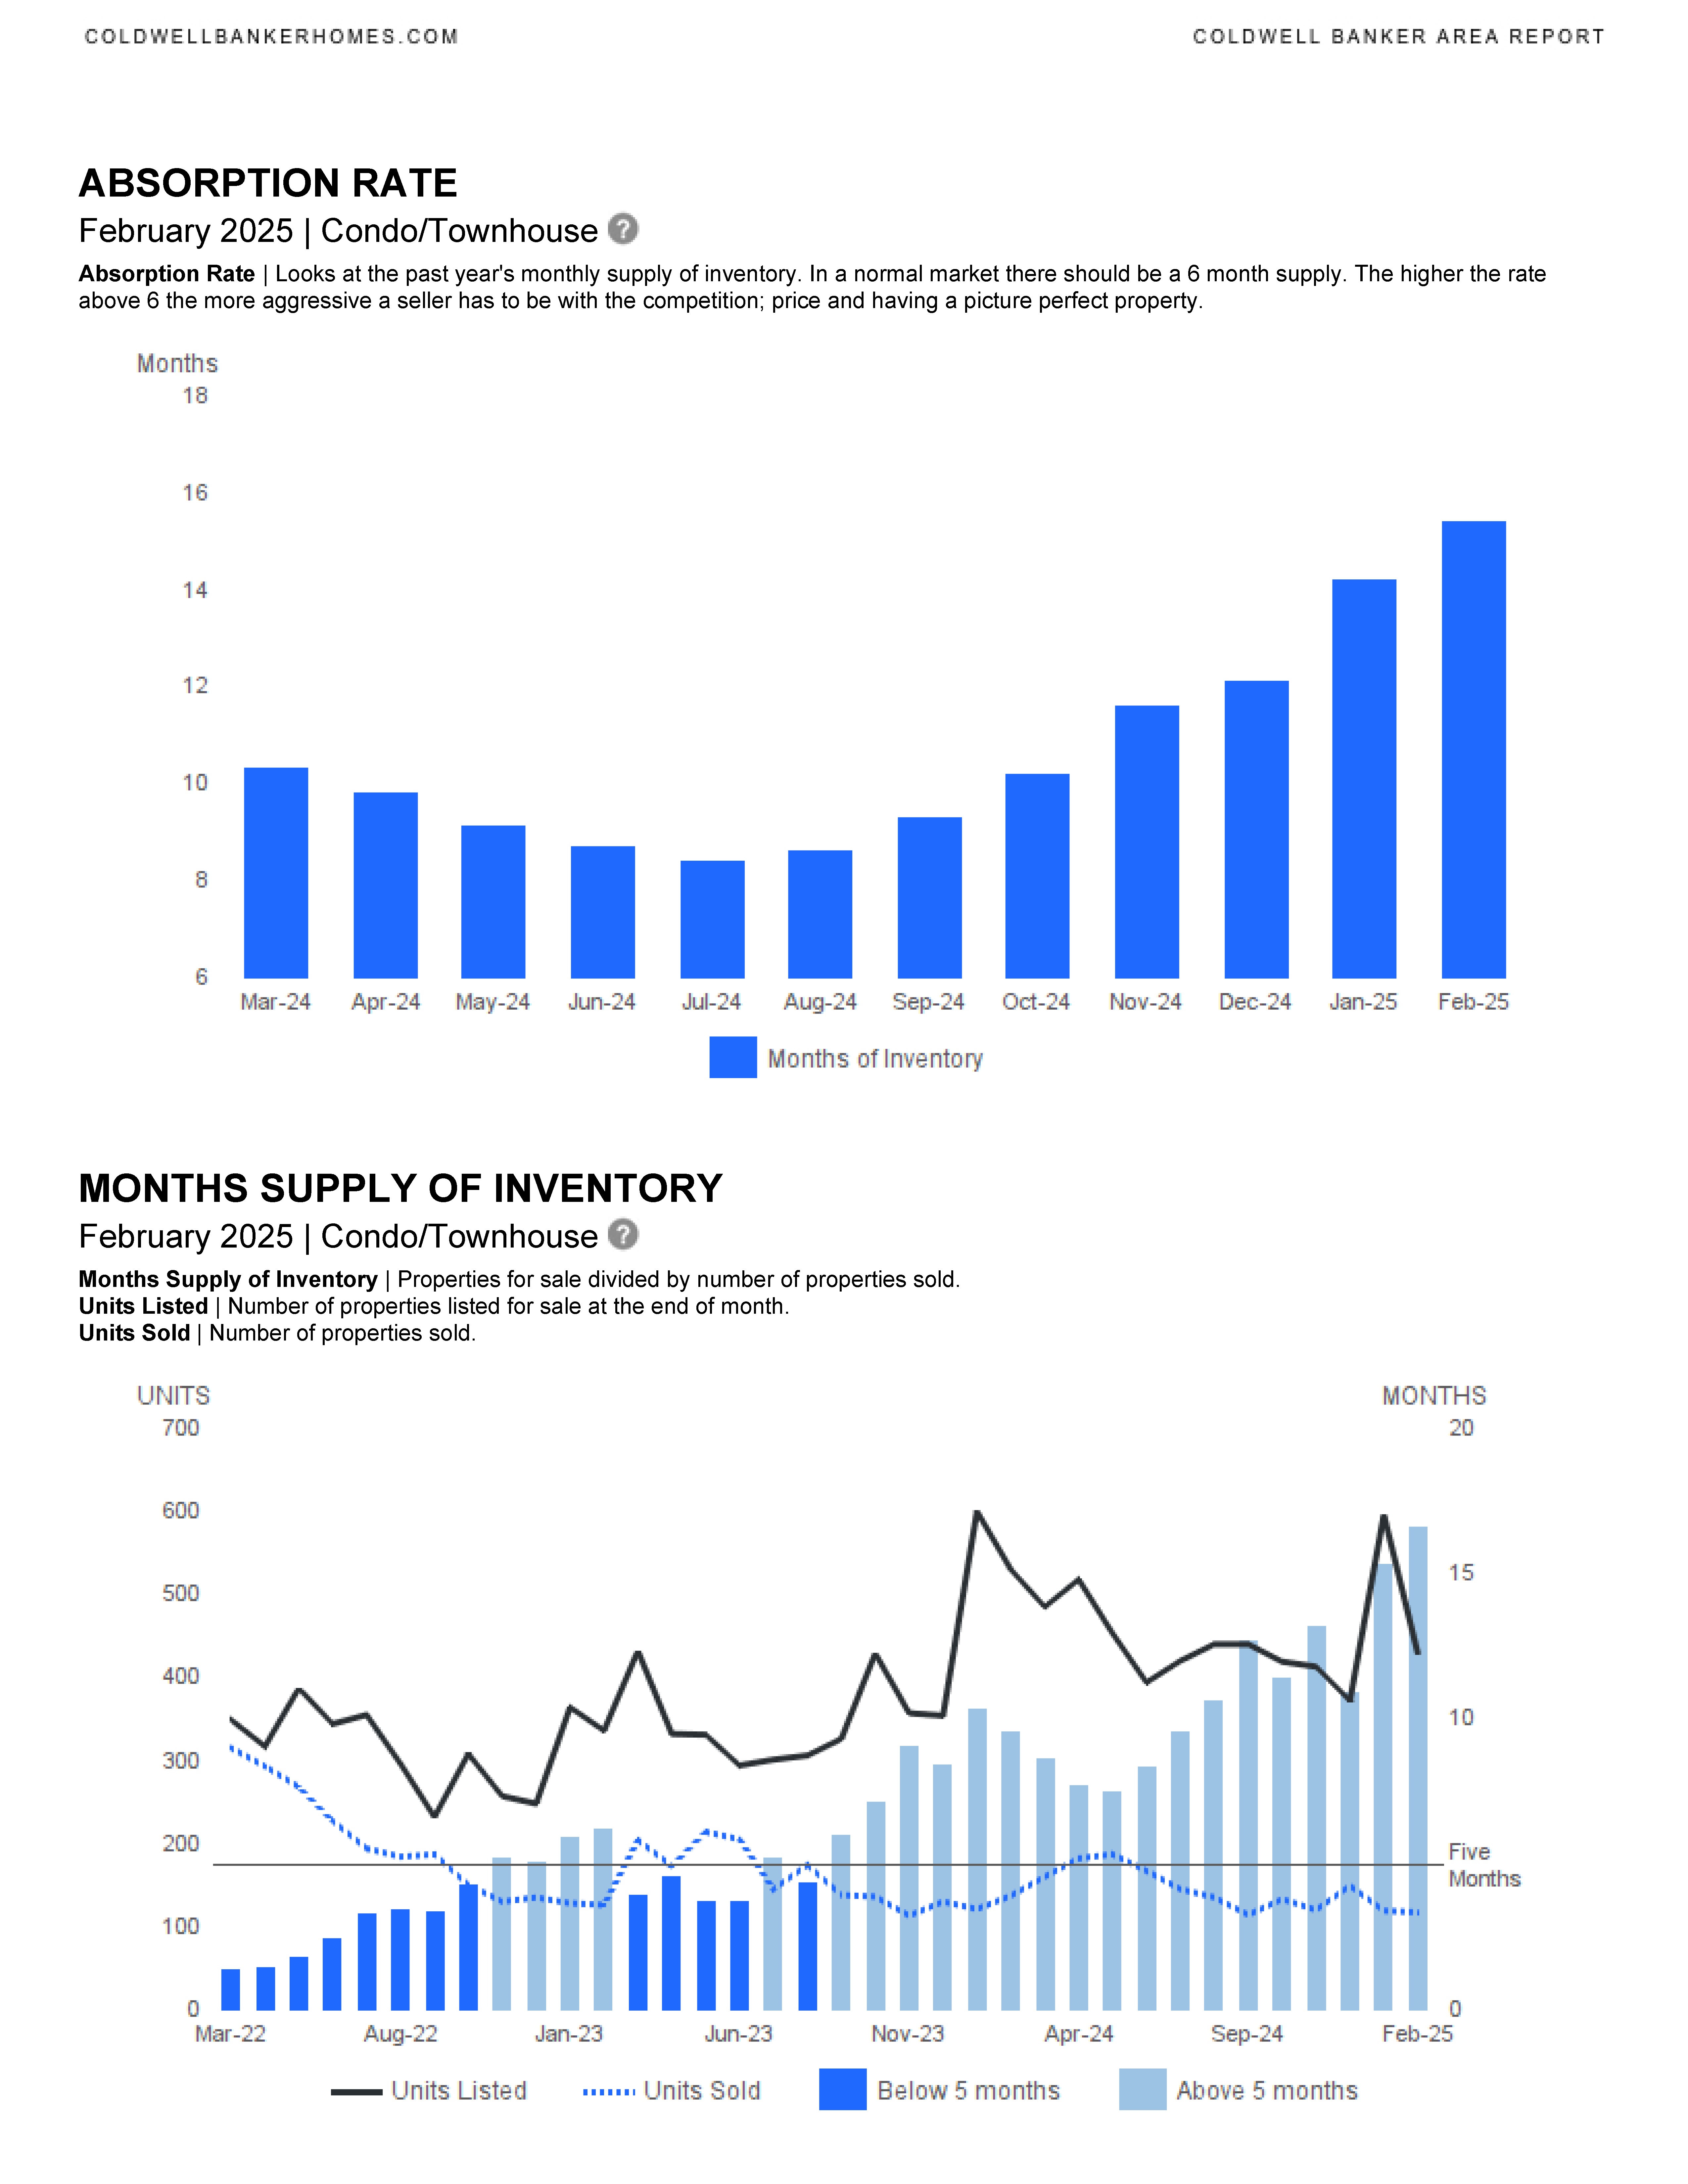
What does “Absorption Rate” mean?
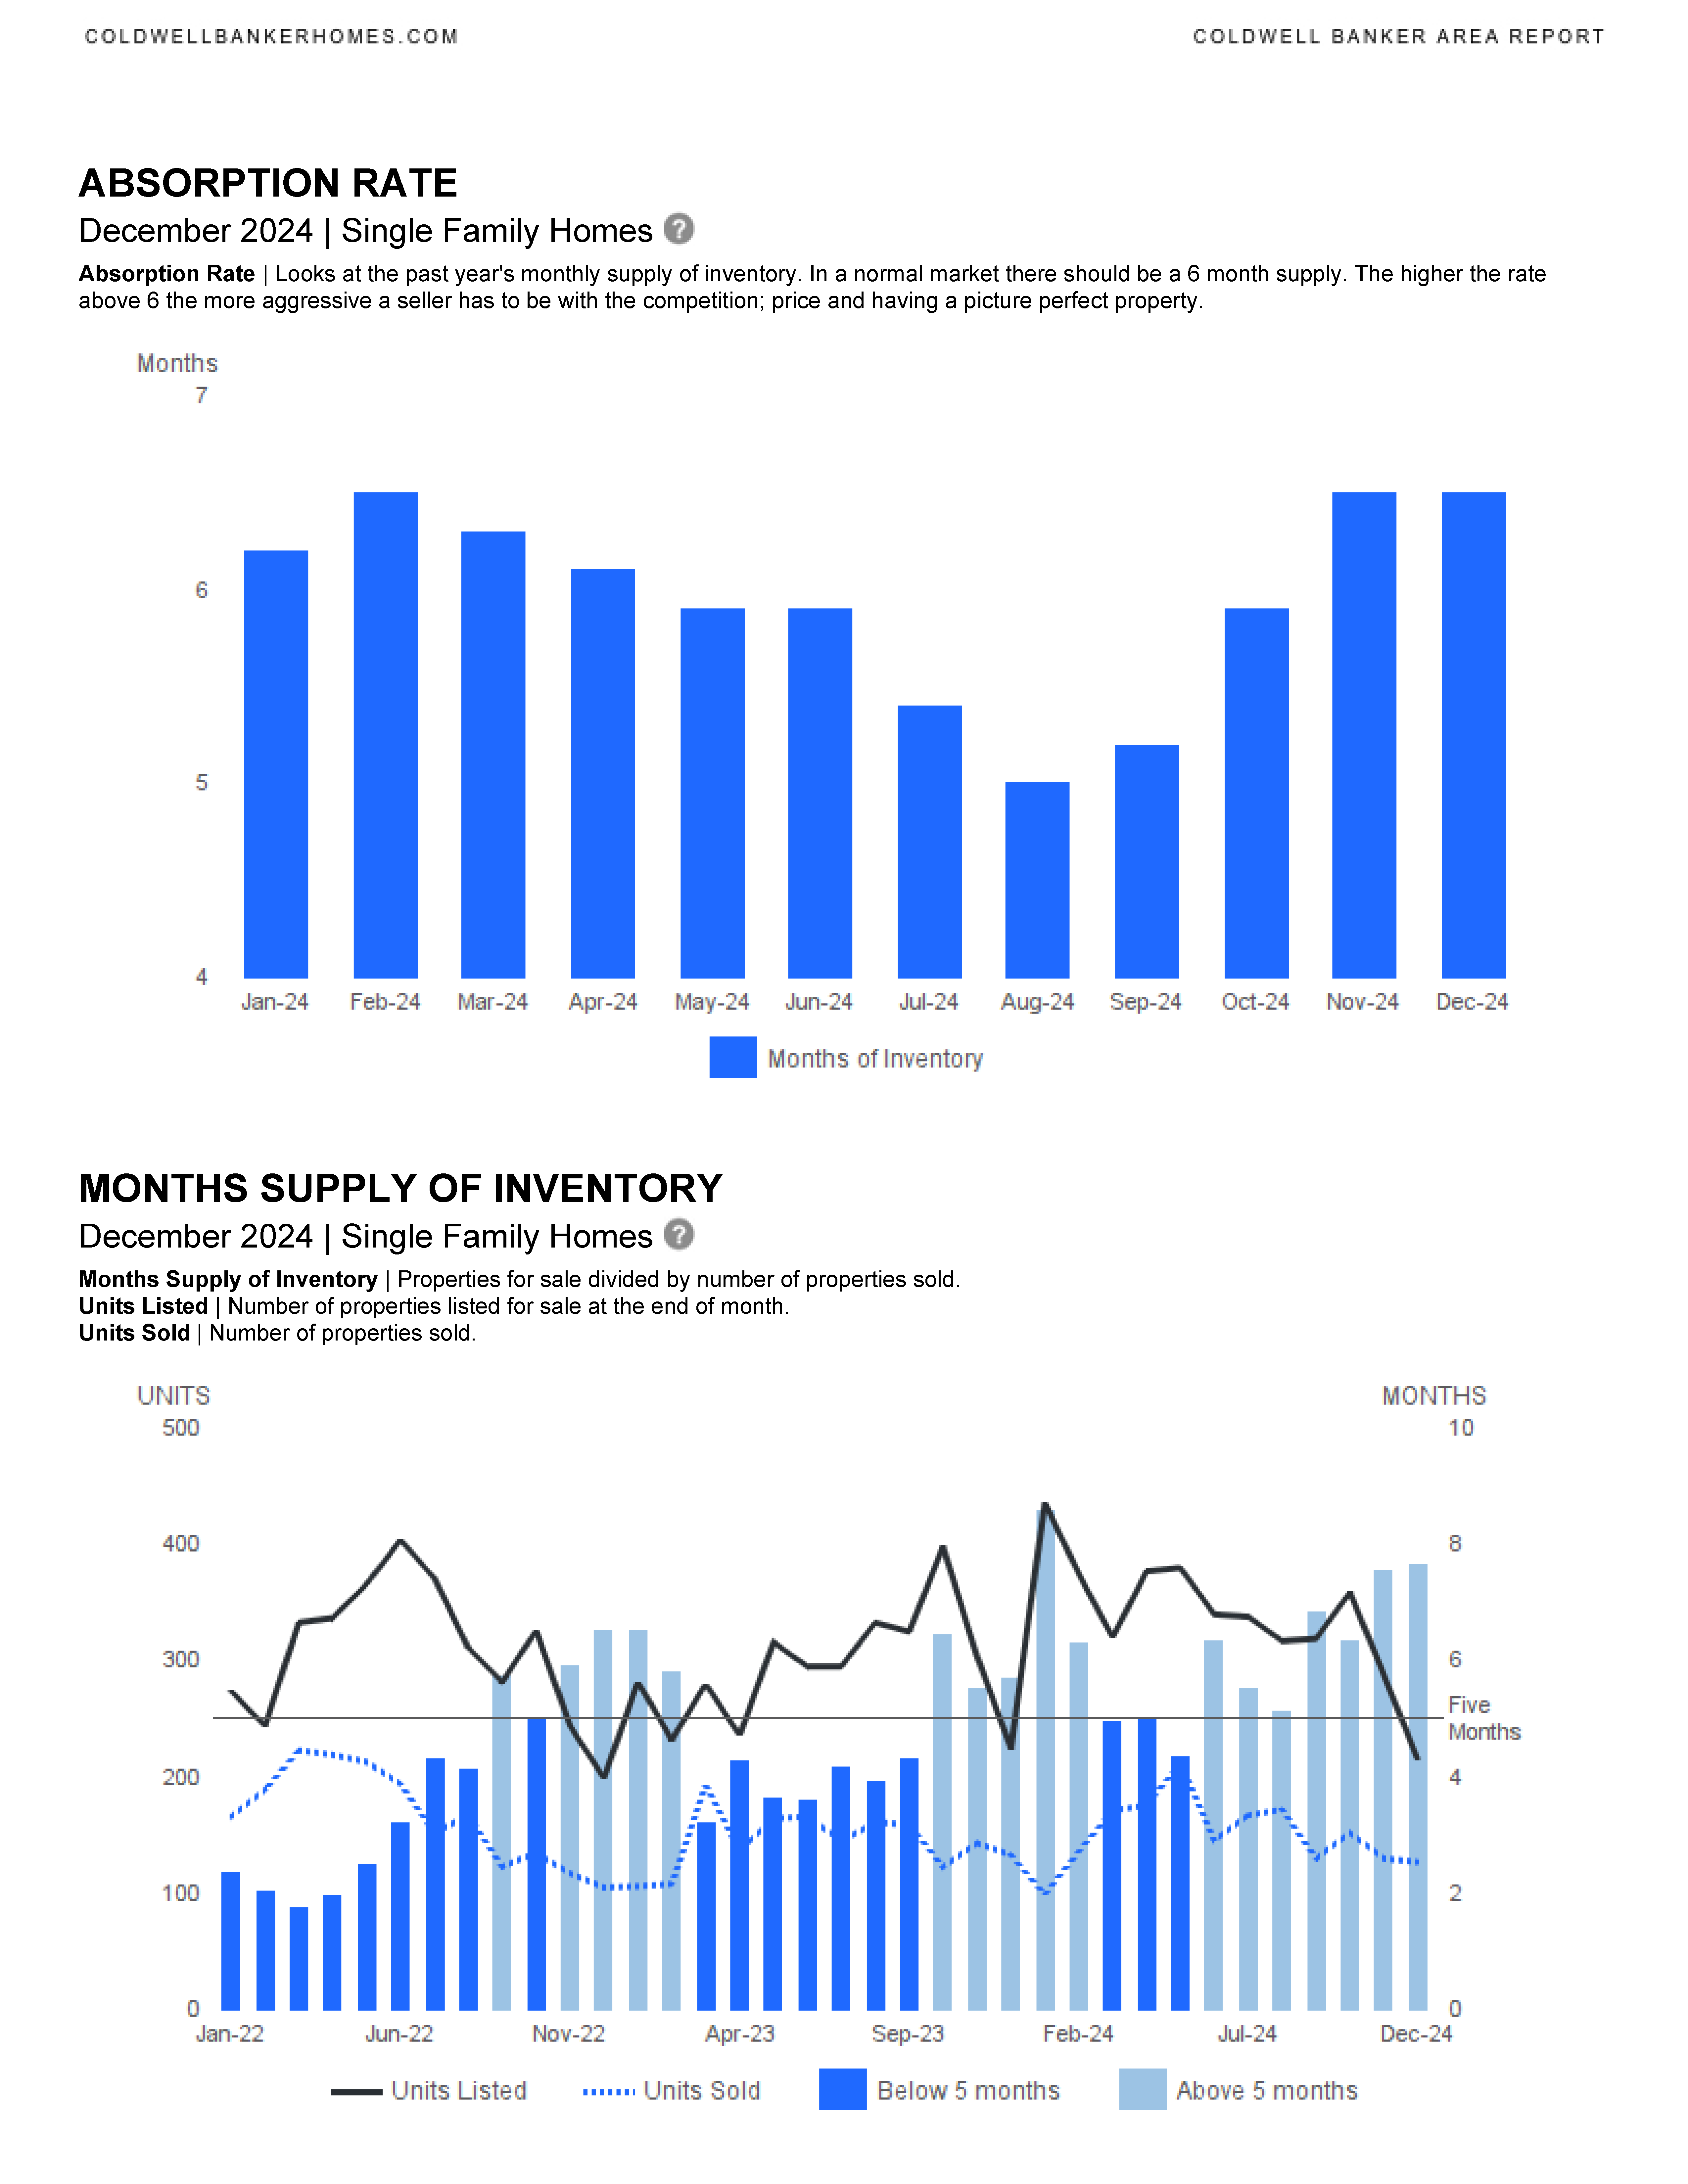
Absorption Rate | Looks at the past year’s monthly supply of inventory. In a normal market there should be a 6 month supply. The higher the rate above 6 the more aggressive a seller has to be with the competition; price and having a picture perfect property.


In this housing market in SE Florida, you need to work with an experienced and knowledgeable real estate professional. Please contact me if you would like to be sent updated market reports for YOUR specific neighborhood, Fort Lauderdale, or another SE Florida city. We can discuss the market, current trends and how we can work together to accomplish your real estate goals. I am here to help.
CONTACT ANNETTE
Let’s start working together!

Annette Dammeyer, REALTOR®, ABR®, AHWD®
Coldwell Banker Realty
901 E Las Olas Blvd STE 101, Fort Lauderdale, FL 33301
808.747.3686
SL 3535792
Fort Lauderdale September 2025 Area Report
Fort Lauderdale September 2025 real estate statistics have been published.
Fort Lauderdale Area Reports
Single Family Homes
Condominium & Townhouses
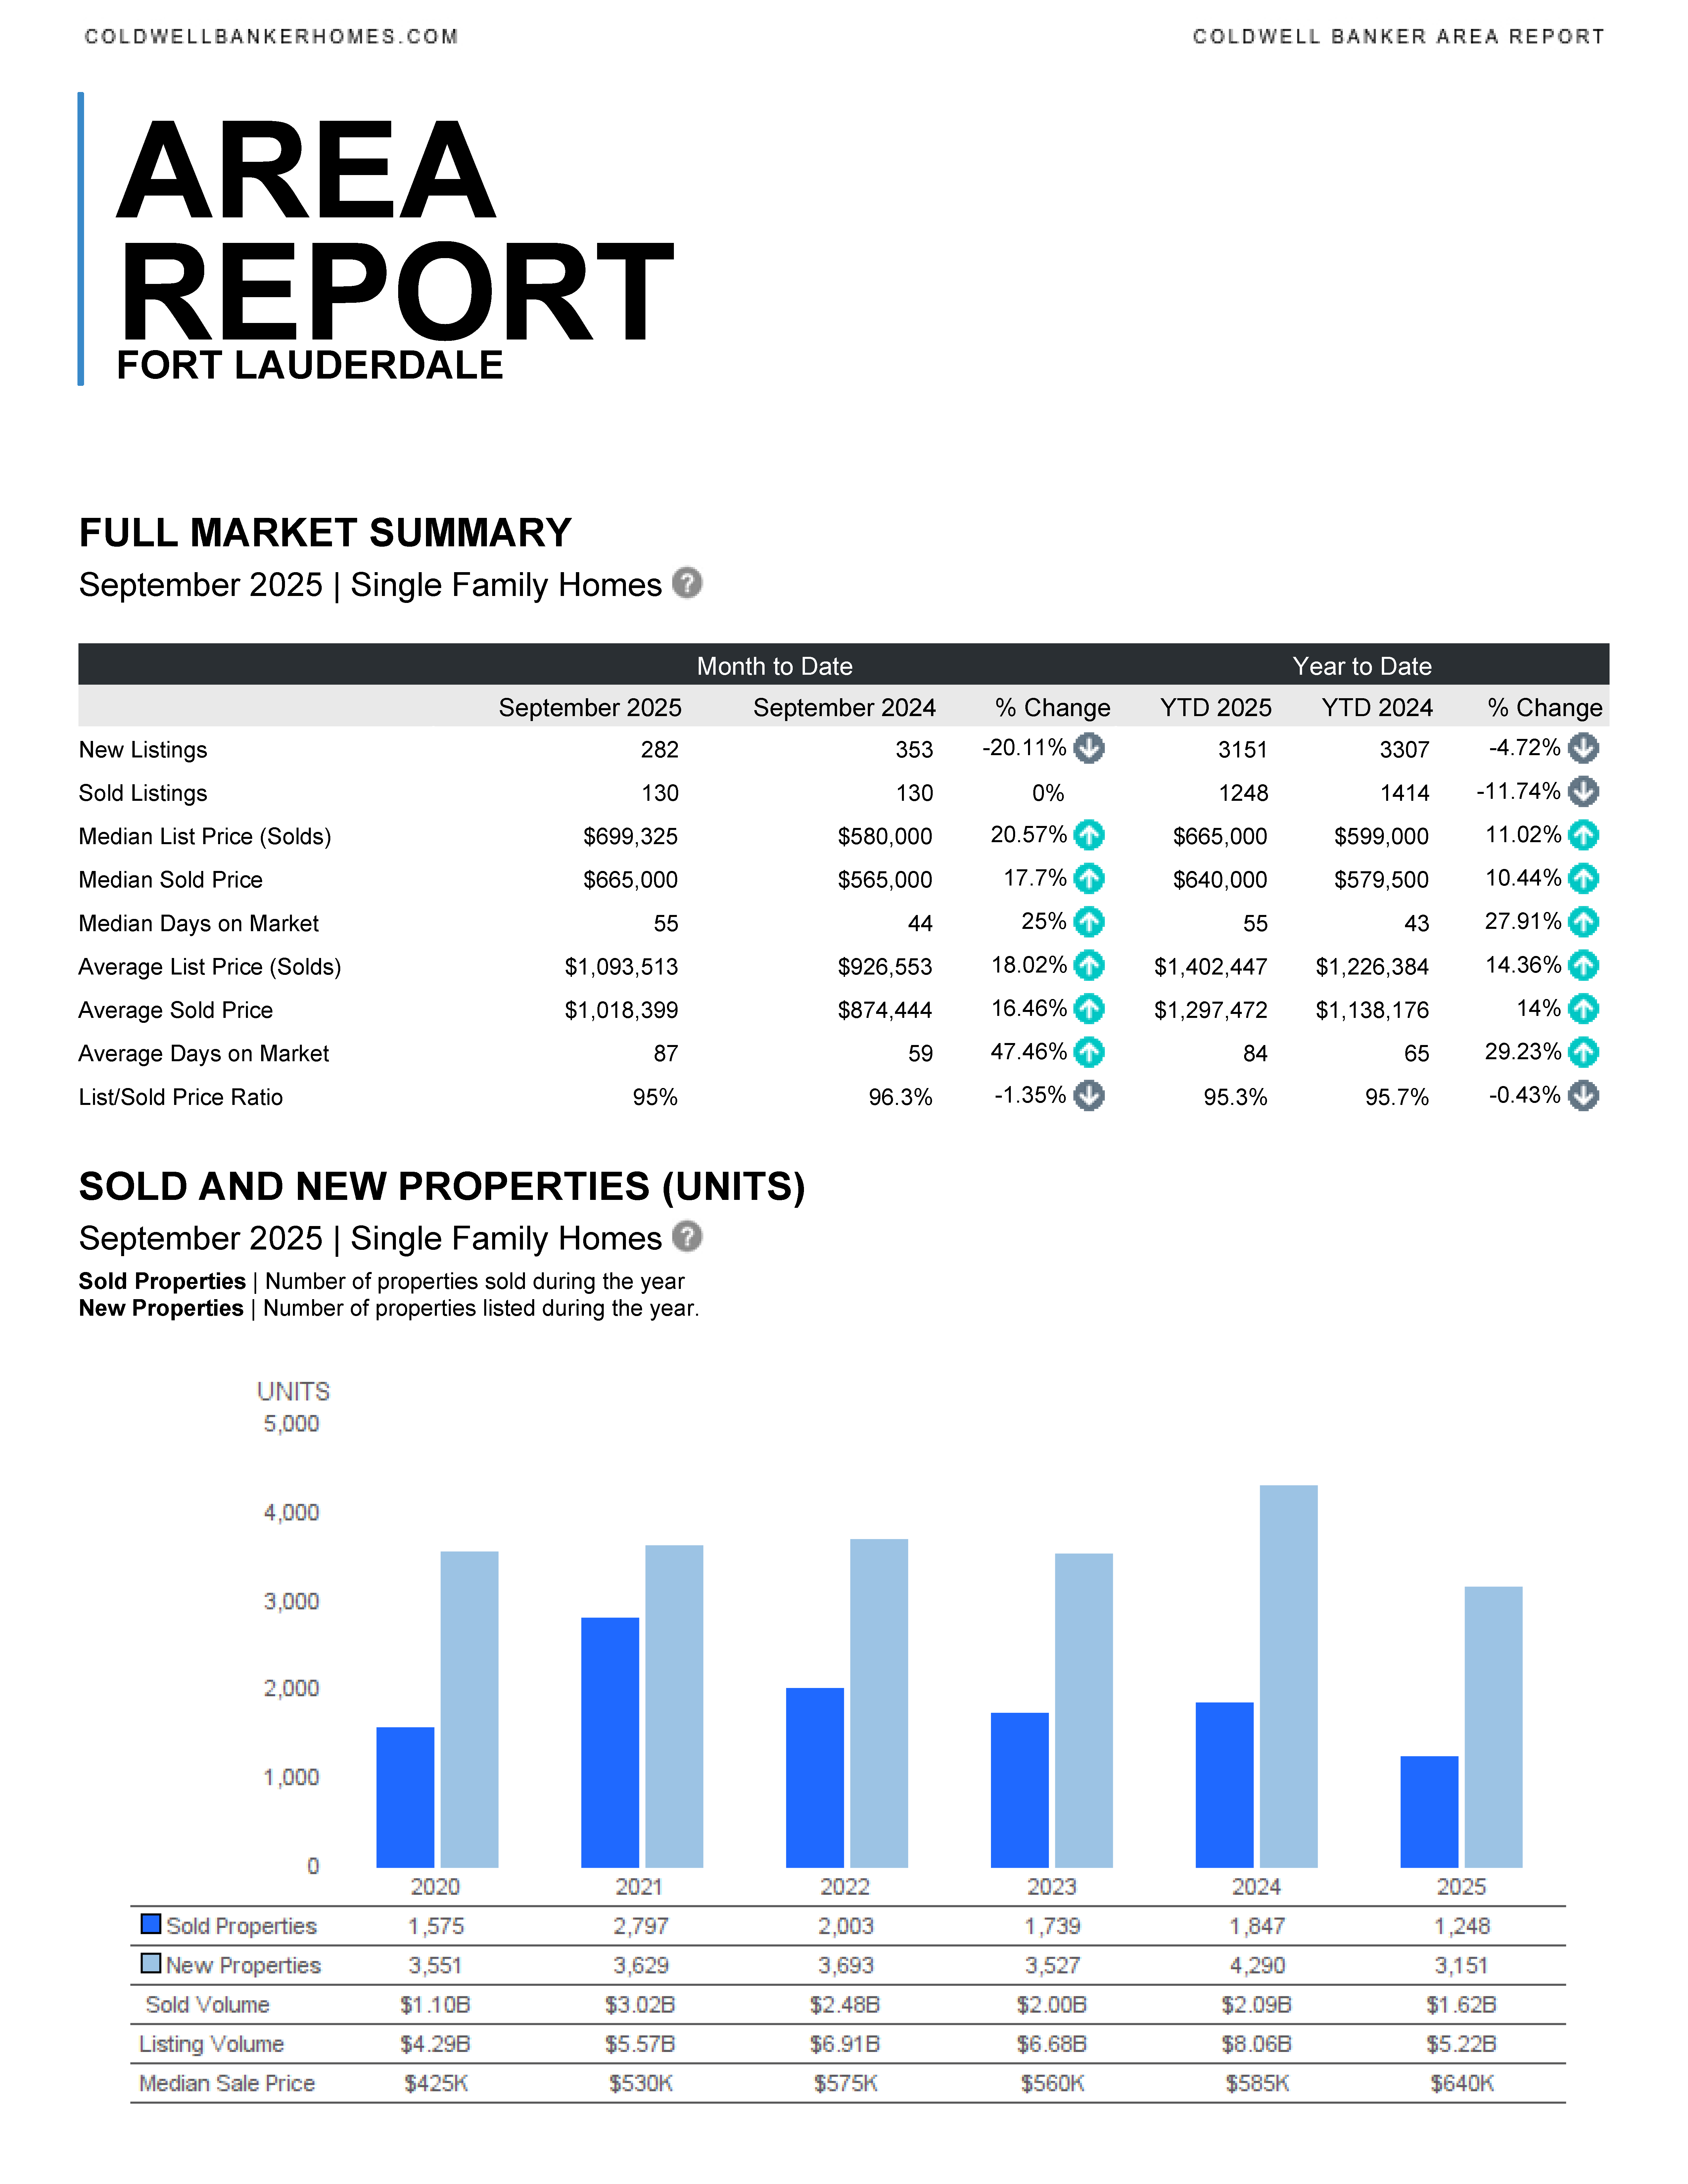
🏡 Fort Lauderdale Real Estate Market Summary – September 2025
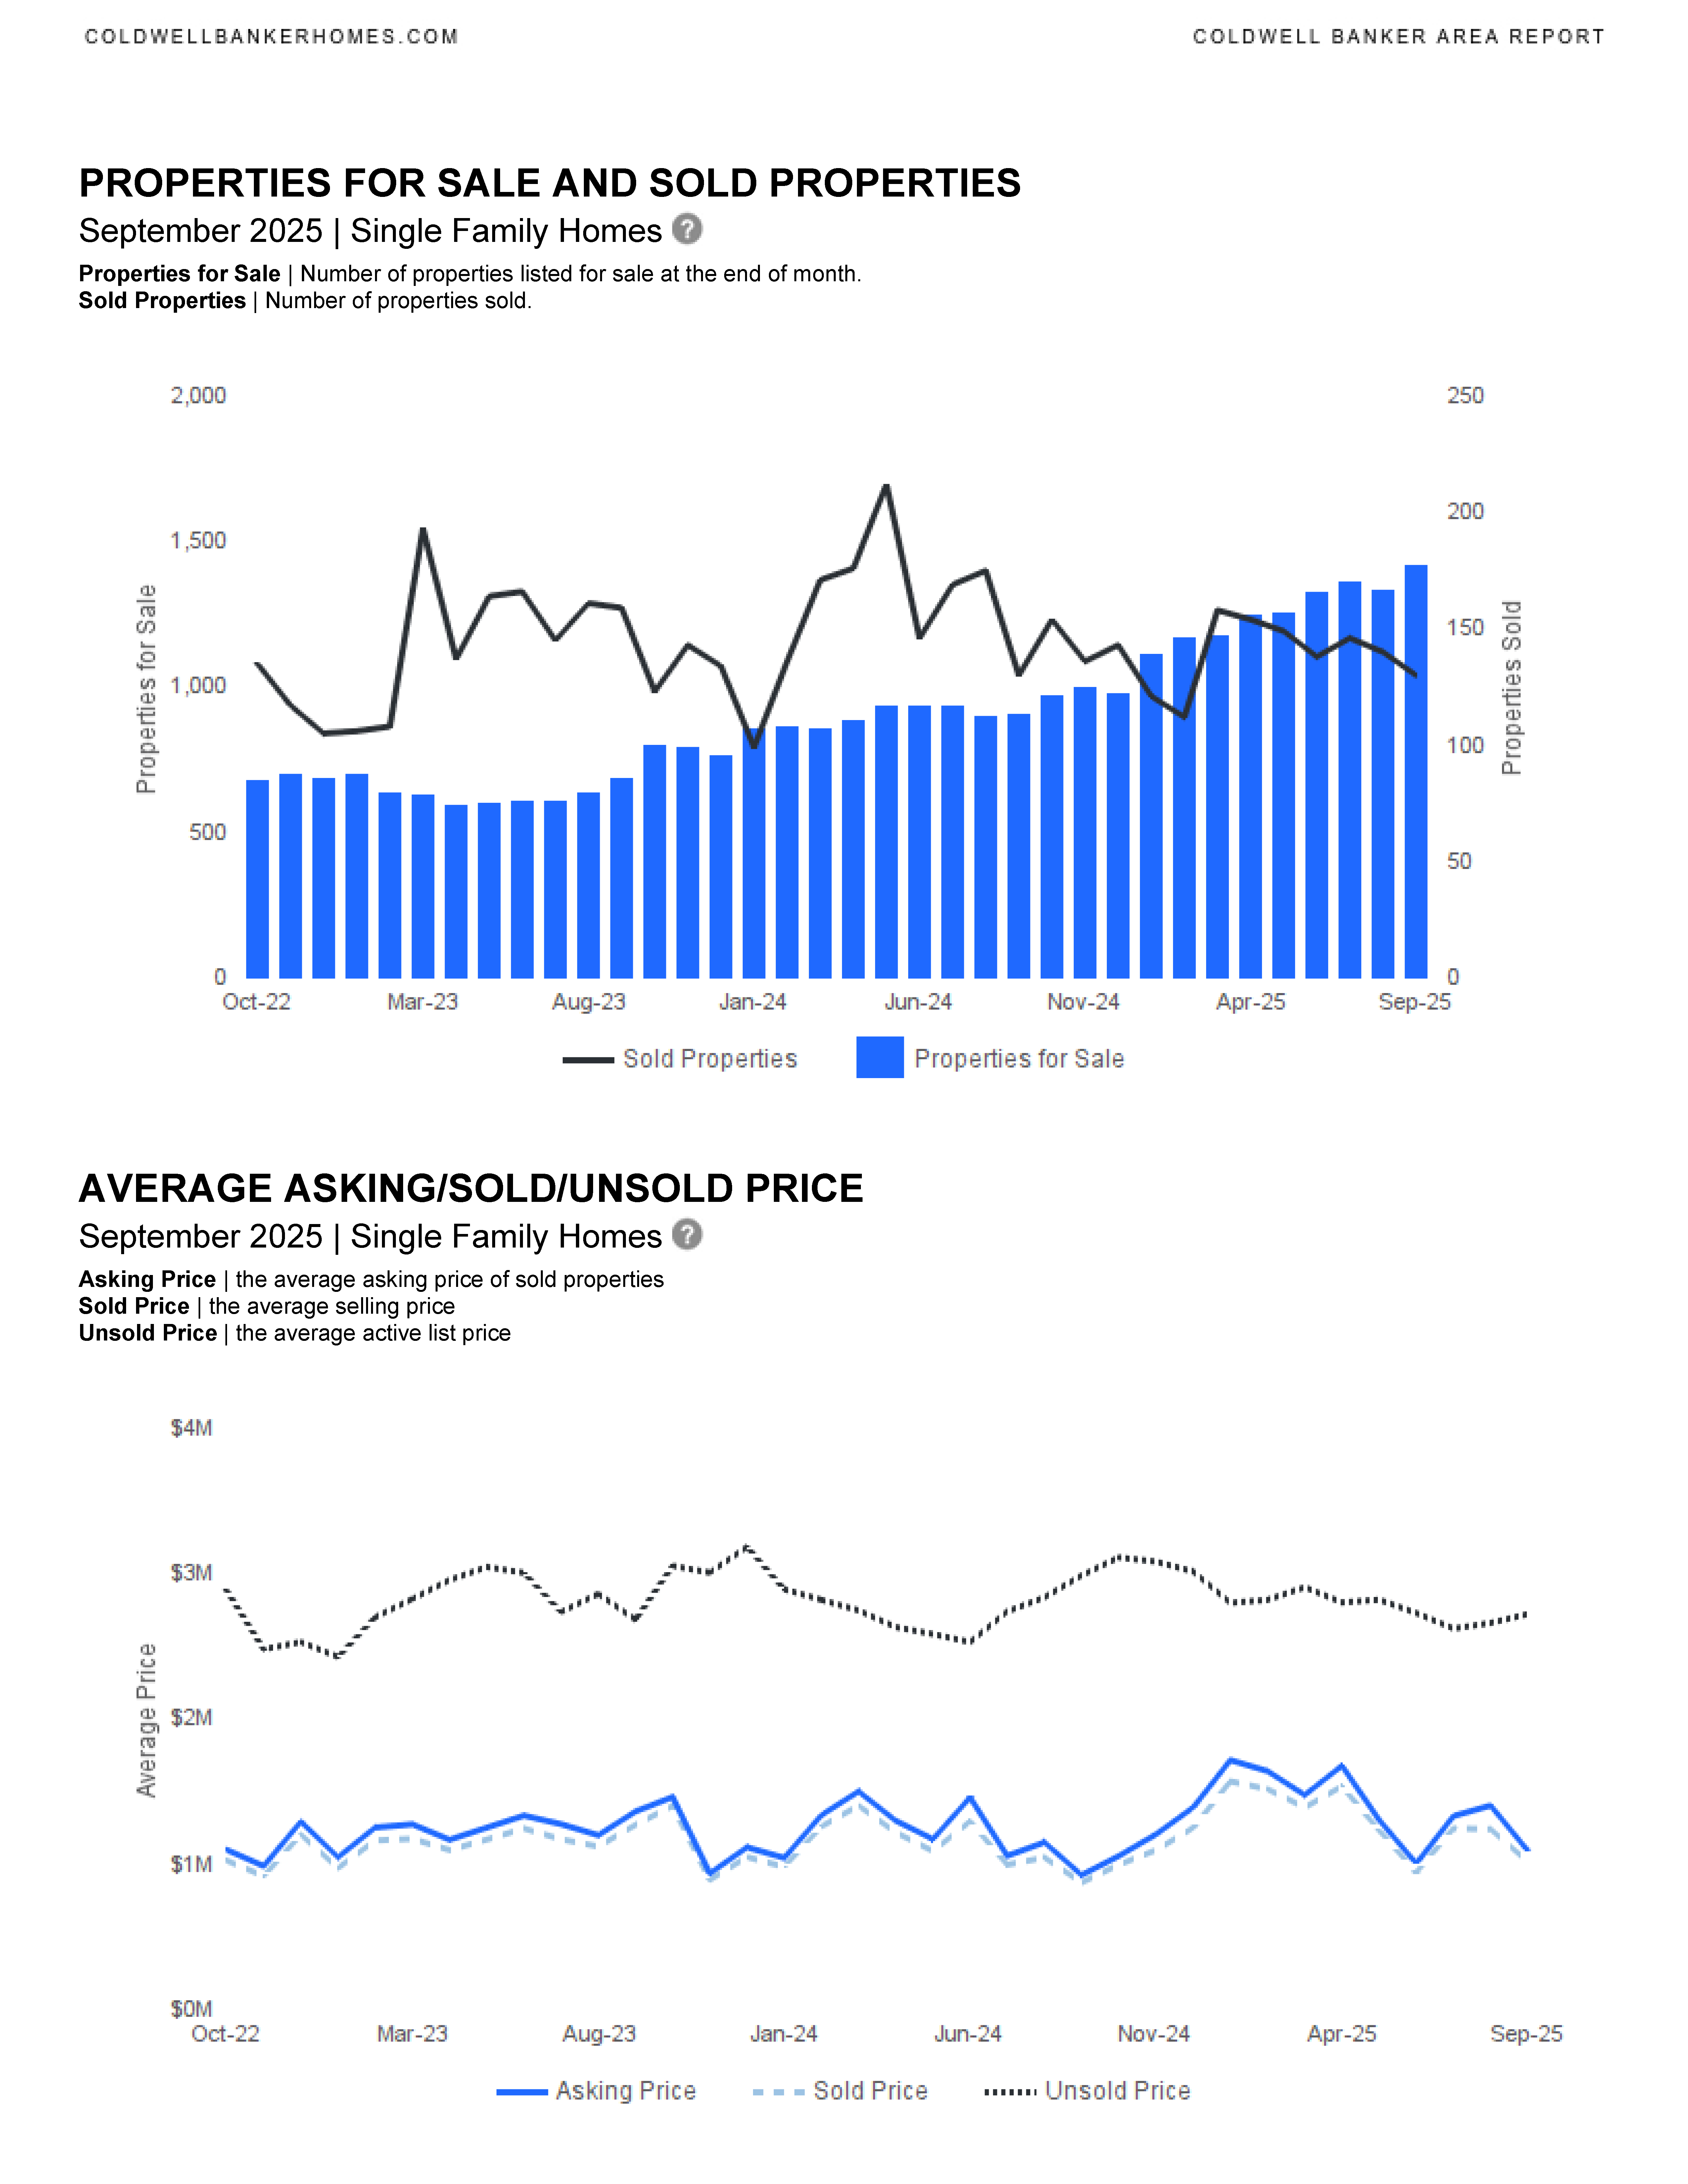
📊 Single Family Homes
- Sales Activity
- Sold listings remained flat month-over-month (130 units), but YTD sales dropped 11.74%.
- New listings declined 20.11% month-over-month and 4.72% YTD.
- Pricing Trends
- Median Sold Price: $665K (↑17.7% YoY)
- Average Sold Price: $1.02M (↑16.46% YoY)
- Median List Price (Solds): $699K (↑20.57% YoY)
- Average List Price (Solds): $1.09M (↑18.02% YoY)
- Market Dynamics
- Average Days on Market: 87 (↑47.46% YoY)
- List/Sold Price Ratio: 95% (↓1.35% YoY)
- Absorption Rate: trending above 6 months, indicating a buyer’s market.
- Historical Context
- Sold volume dropped to $1.62B from $2.09B in 2024.
- Listing volume fell to $5.22B from $8.06B.
- Median sale price rose to $640K from $585K.
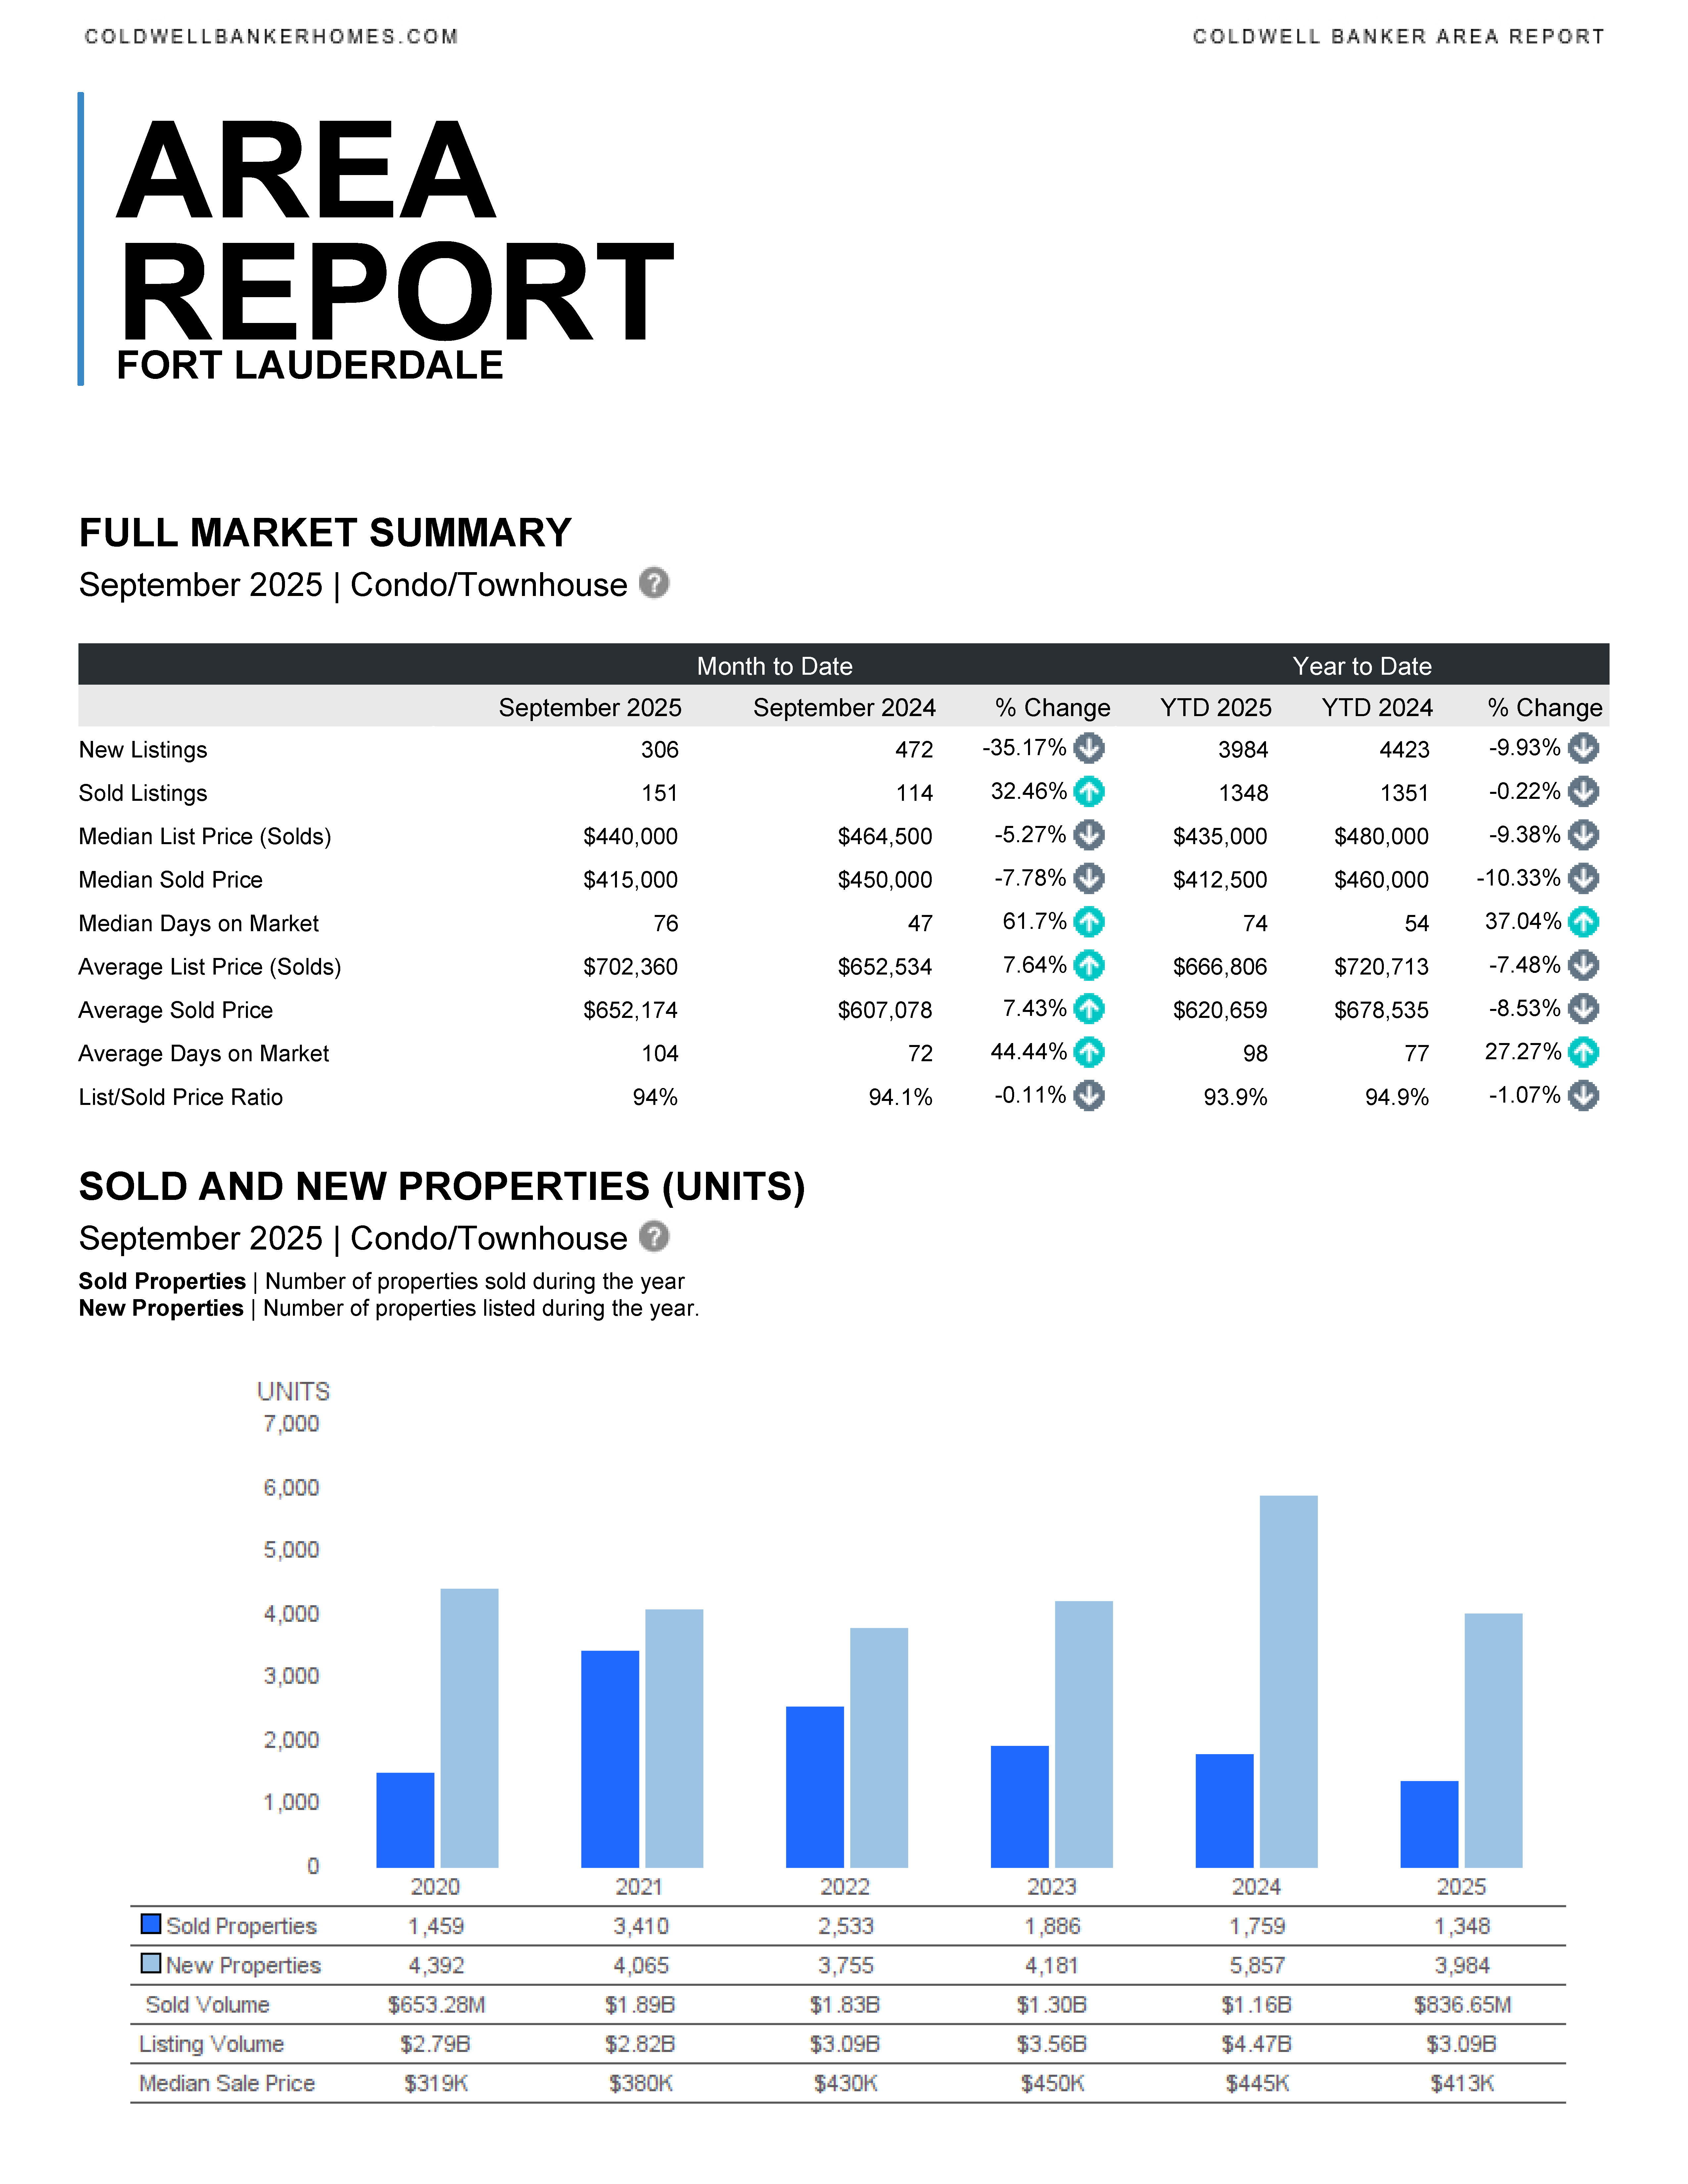
🏢 Condos & Townhomes
- Sales Activity
- Sold listings increased 32.46% YoY (151 units), but YTD sales slightly declined.
- New listings dropped 35.17% YoY and 9.93% YTD.
- Pricing Trends
- Median Sold Price: $415K (↓7.78% YoY)
- Average Sold Price: $652K (↑7.43% YoY)
- Median List Price (Solds): $440K (↓5.27% YoY)
- Average List Price (Solds): $702K (↑7.64% YoY)
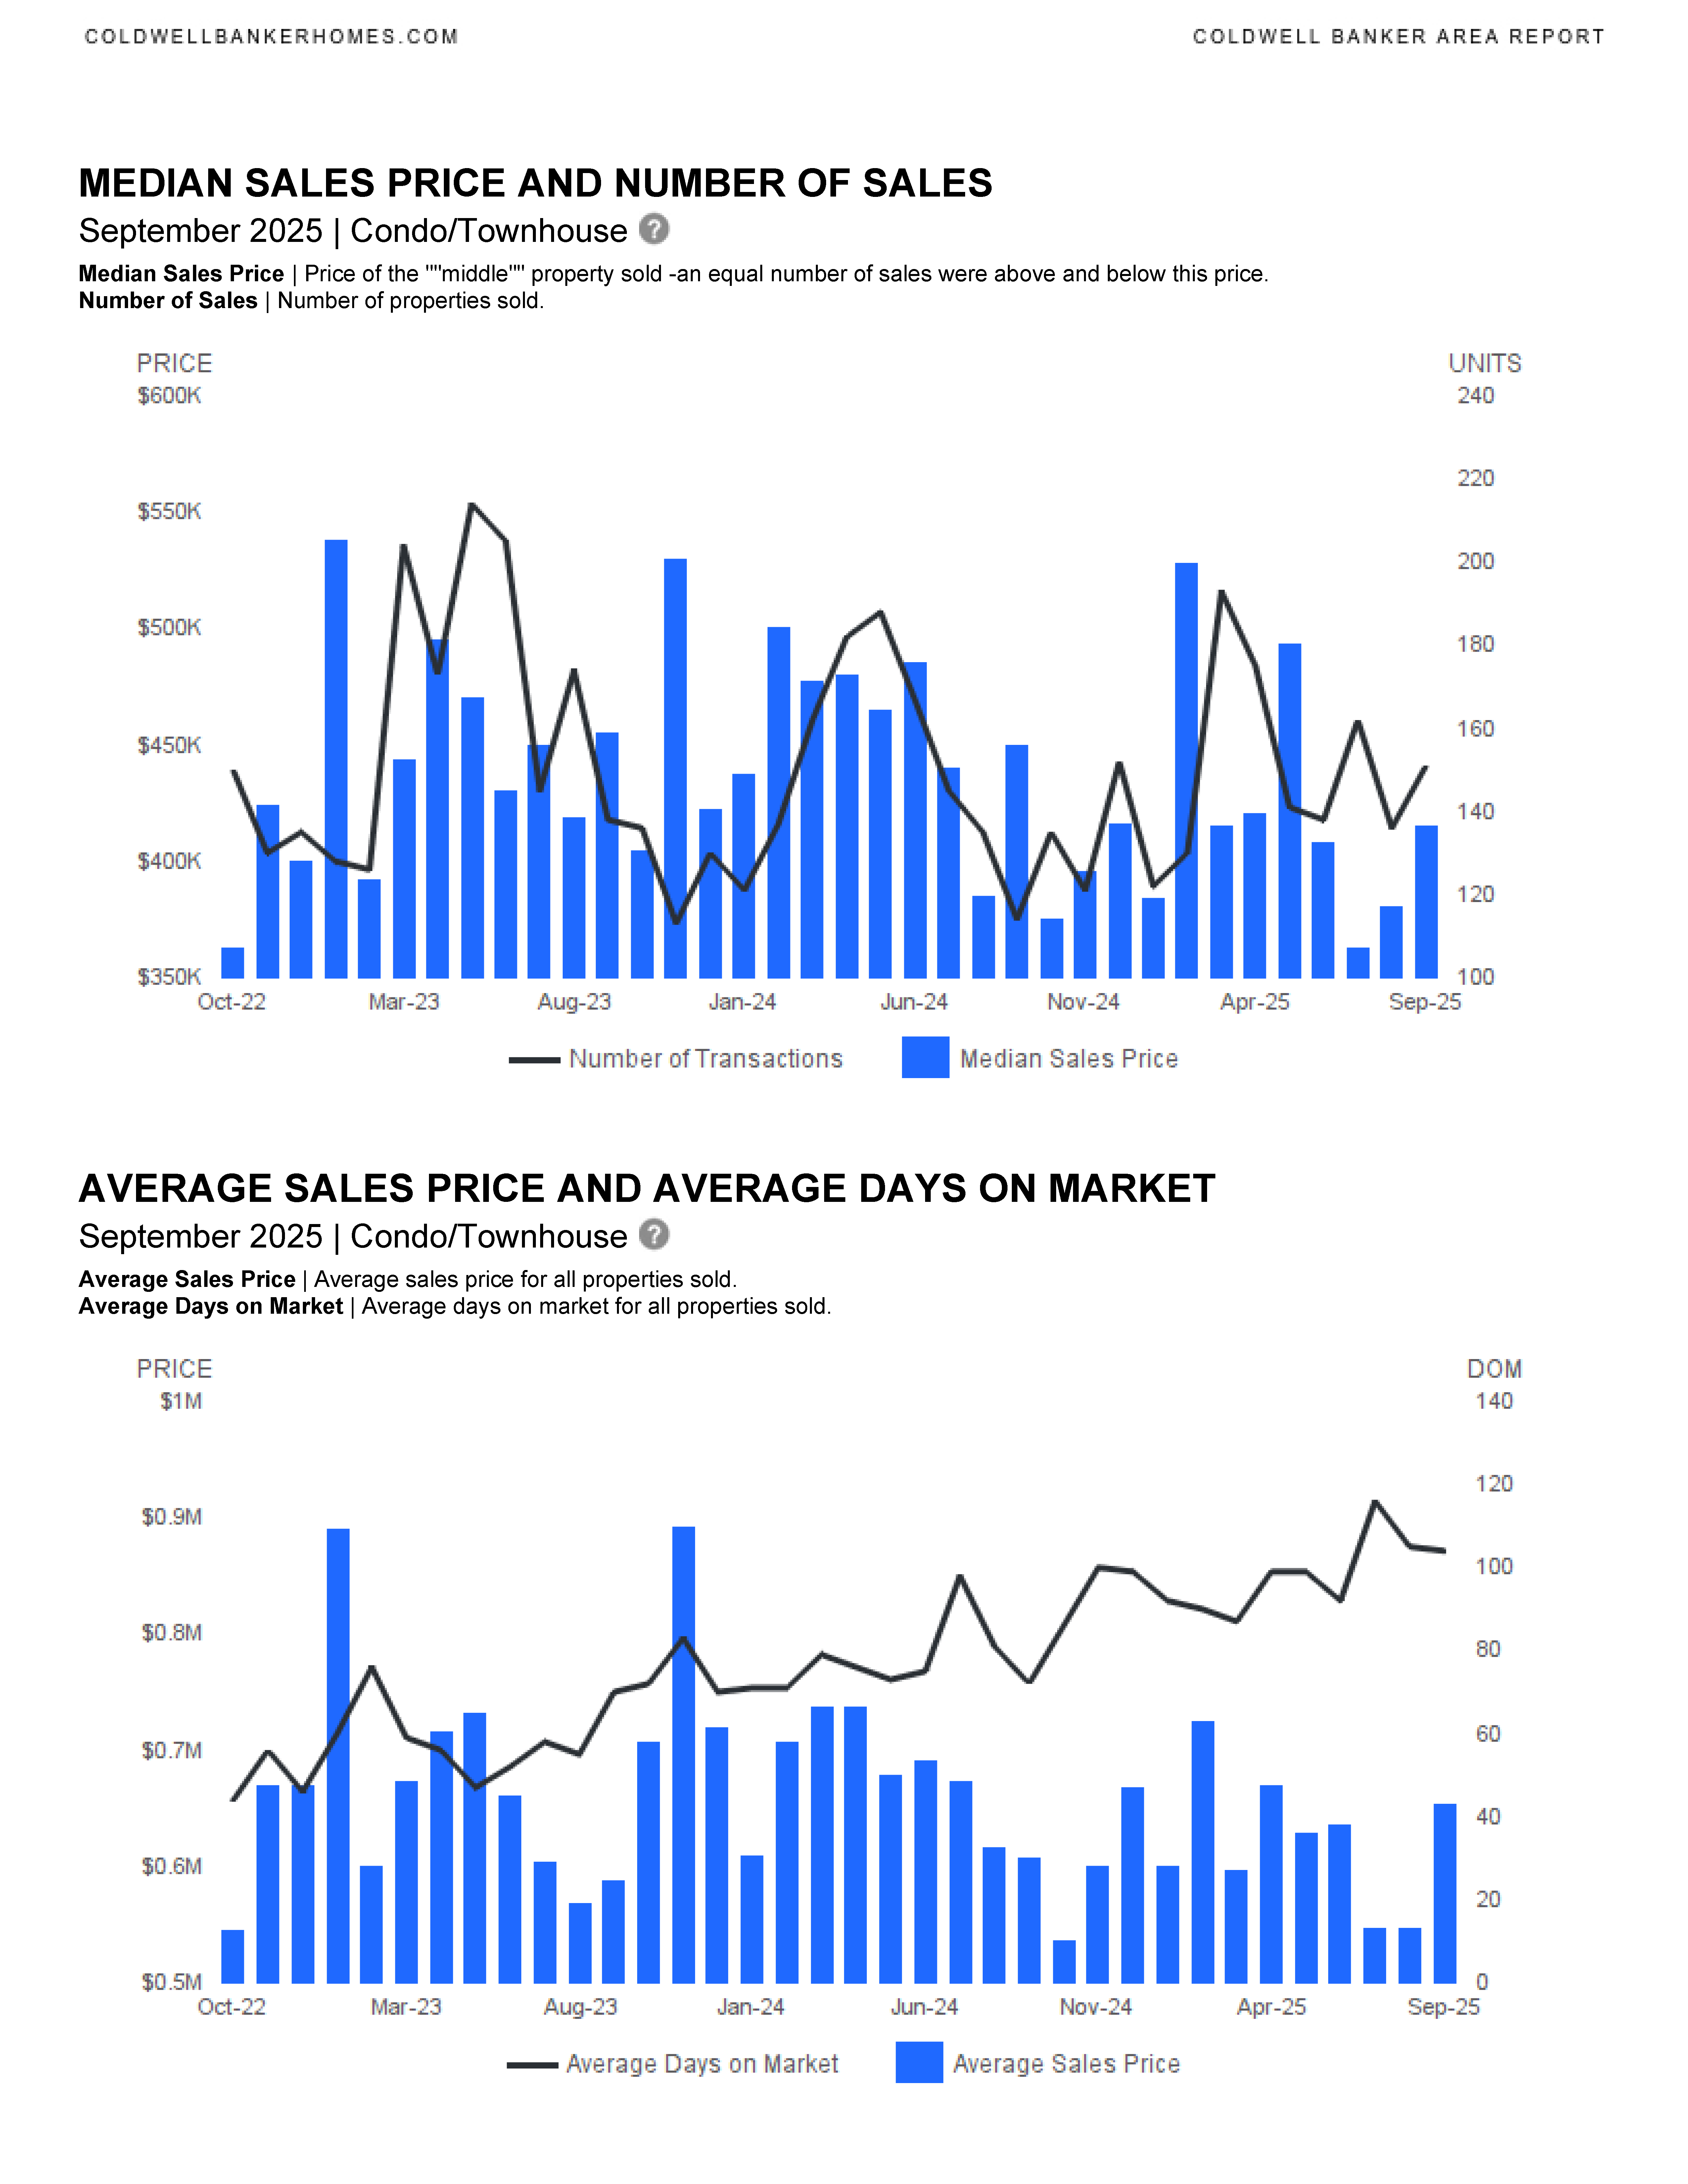
- Market Dynamics
- Average Days on Market: 104 (↑44.44% YoY)
- List/Sold Price Ratio: 94% (slightly down YoY)
- Absorption Rate: well above 6 months, suggesting slower turnover and more competition.
- Historical Context
- Sold volume fell to $836M from $1.16B.
- Listing volume dropped to $3.09B from $4.47B.
- Median sale price decreased to $413K from $445K.
Additional Metrics:
- Absorption Rate: Indicates market competitiveness based on inventory supply.
- Months Supply of Inventory: Reflects the balance between properties for sale and sold properties.


We are in a new housing market in SE Florida. This is the time to work with an experienced and knowledgeable real estate professional. Please contact me if you would like to be sent updated market reports for YOUR specific neighborhood, Fort Lauderdale, or another SE Florida city. We can discuss the market, current trends and how we can work together to accomplish your real estate goals. I am here to help.
CONTACT ANNETTE
Let’s start working together!
Annette Dammeyer, REALTOR®, ABR®, AHWD®
Coldwell Banker Realty
901 E Las Olas Blvd STE 101, Fort Lauderdale, FL 33301
808.747.3686
SL 3535792
Fort Lauderdale May 2025 Area Report
Fort Lauderdale May 2025 real estate statistics have been released.
Fort Lauderdale Area Reports
Single Family Homes
Condominium & Townhouses
Fort Lauderdale Real Estate Market Overview
The Fort Lauderdale real estate market has experienced significant changes in sales activity and pricing trends over the past year. Both single-family homes and condo/townhouse markets show a decline in sales volume, while prices have generally increased.
Summary:
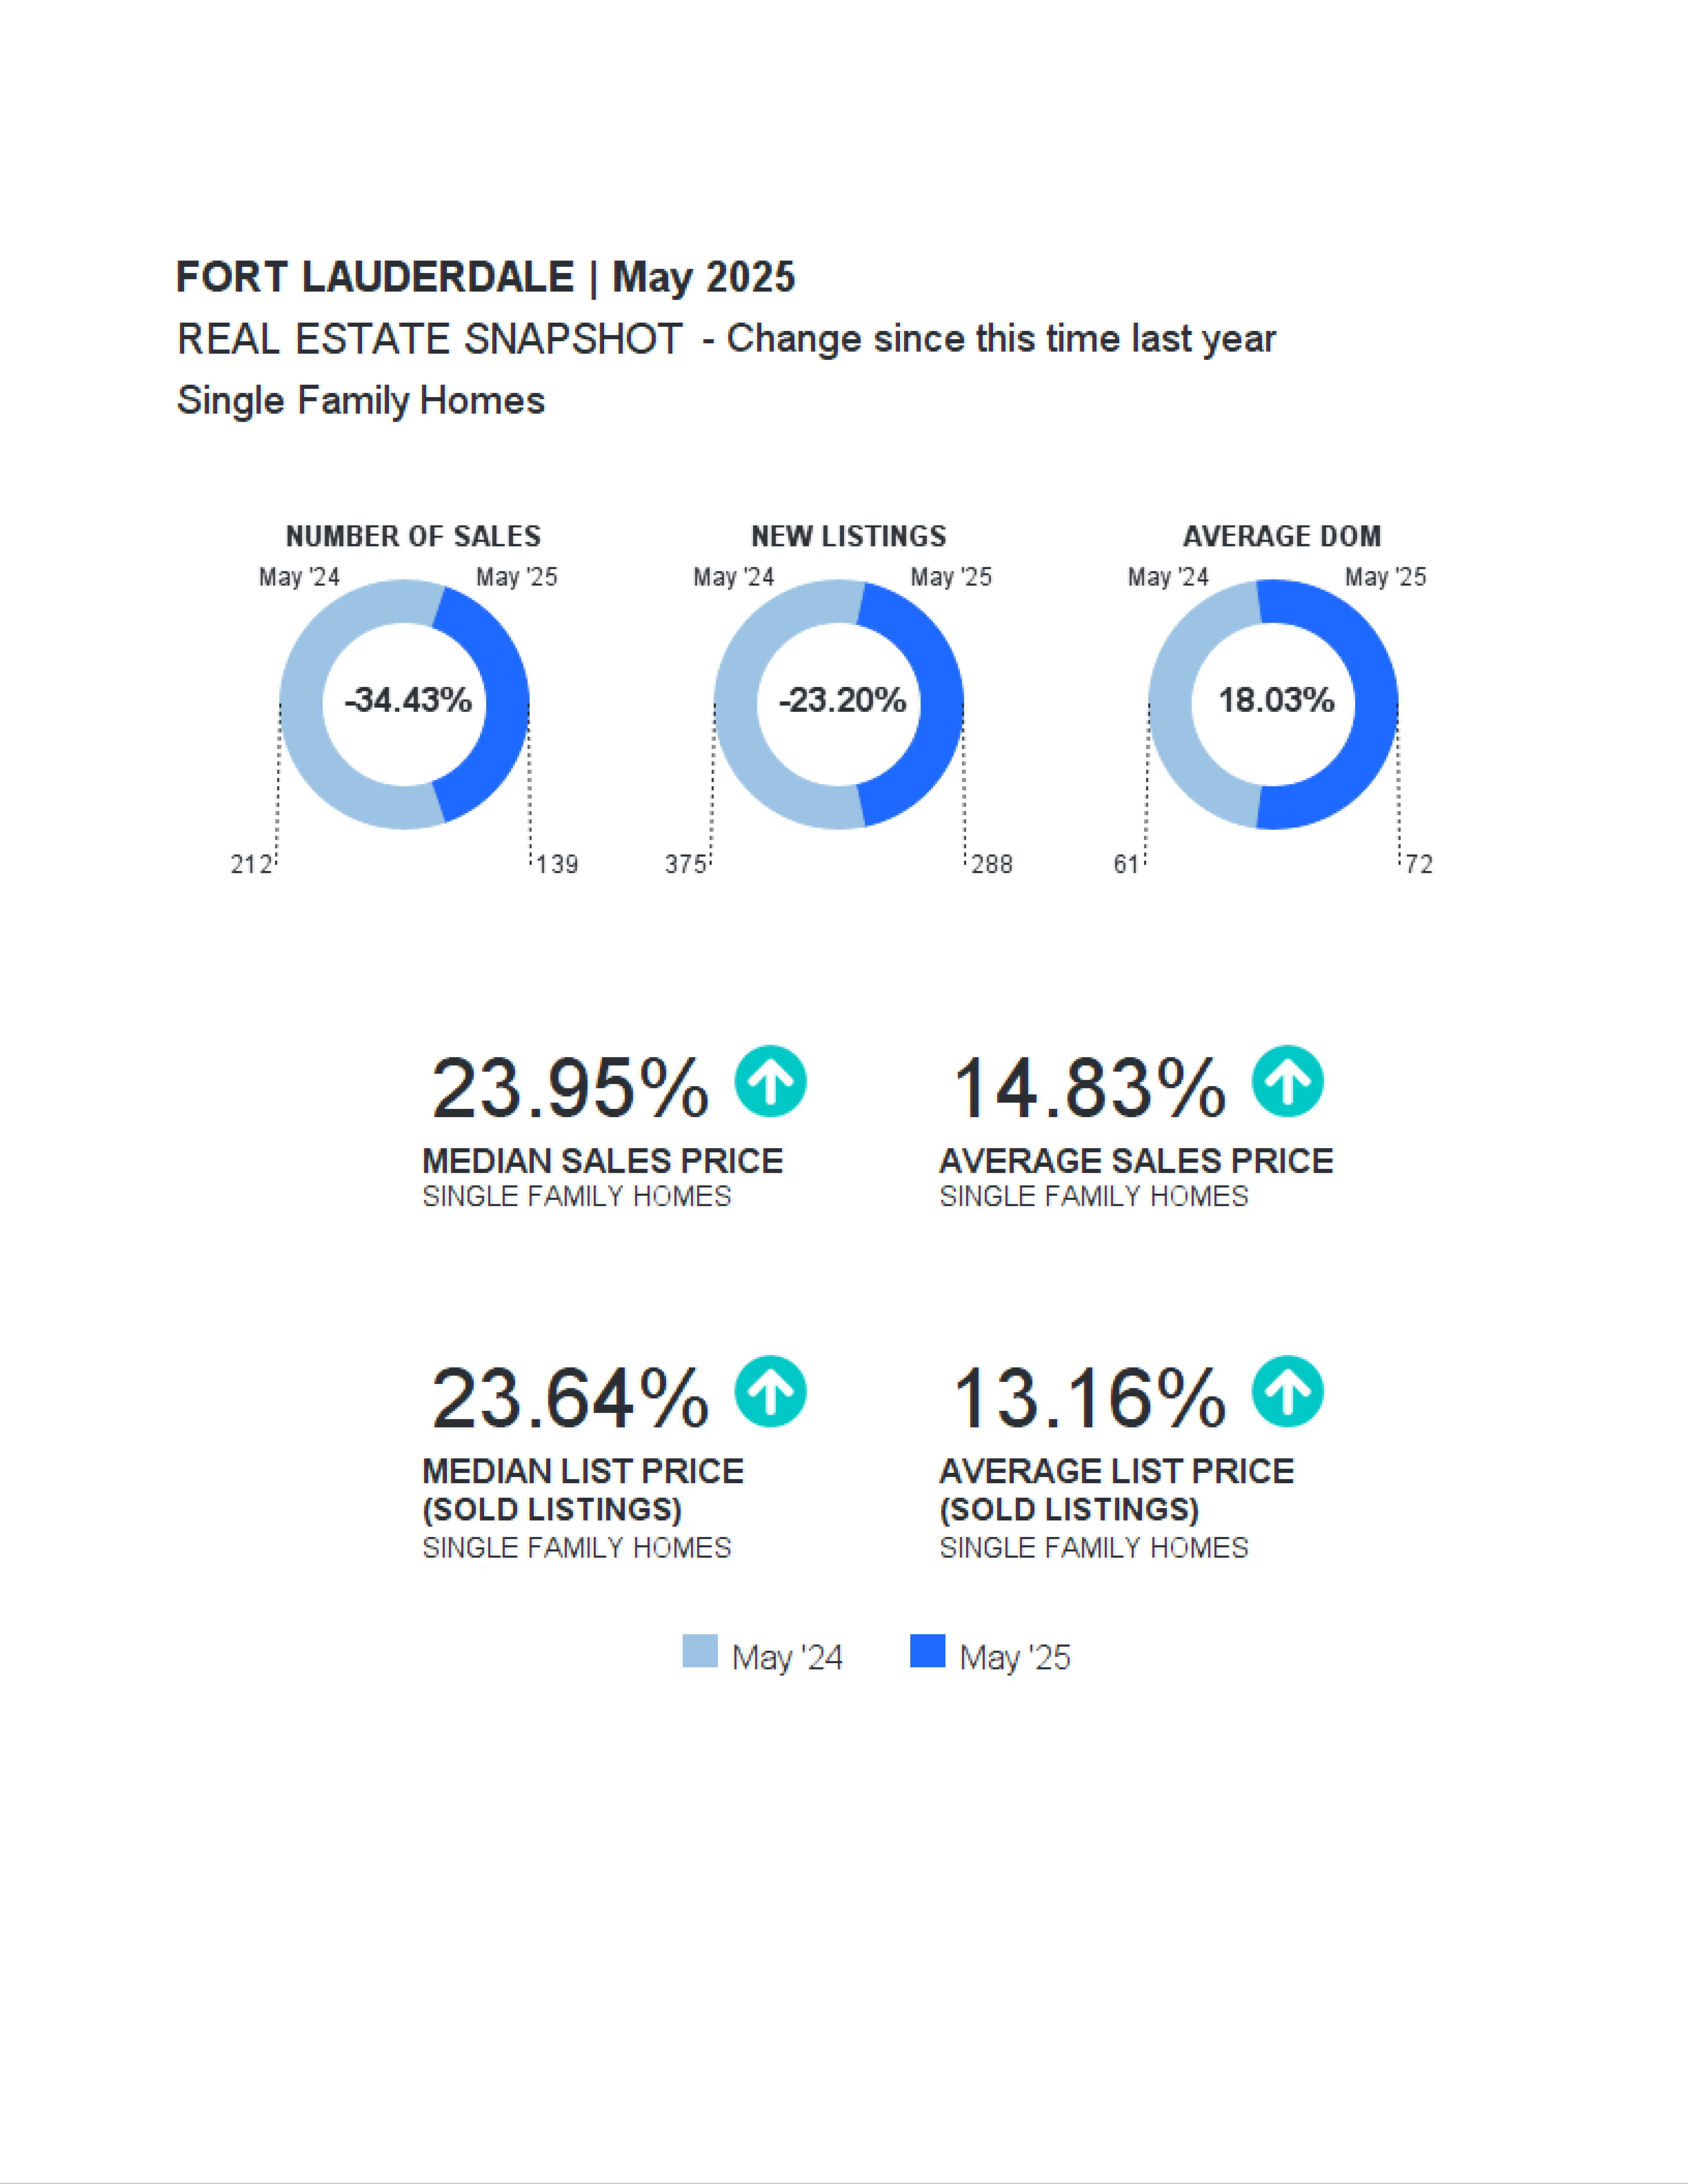
Single Family Homes Sales Activity
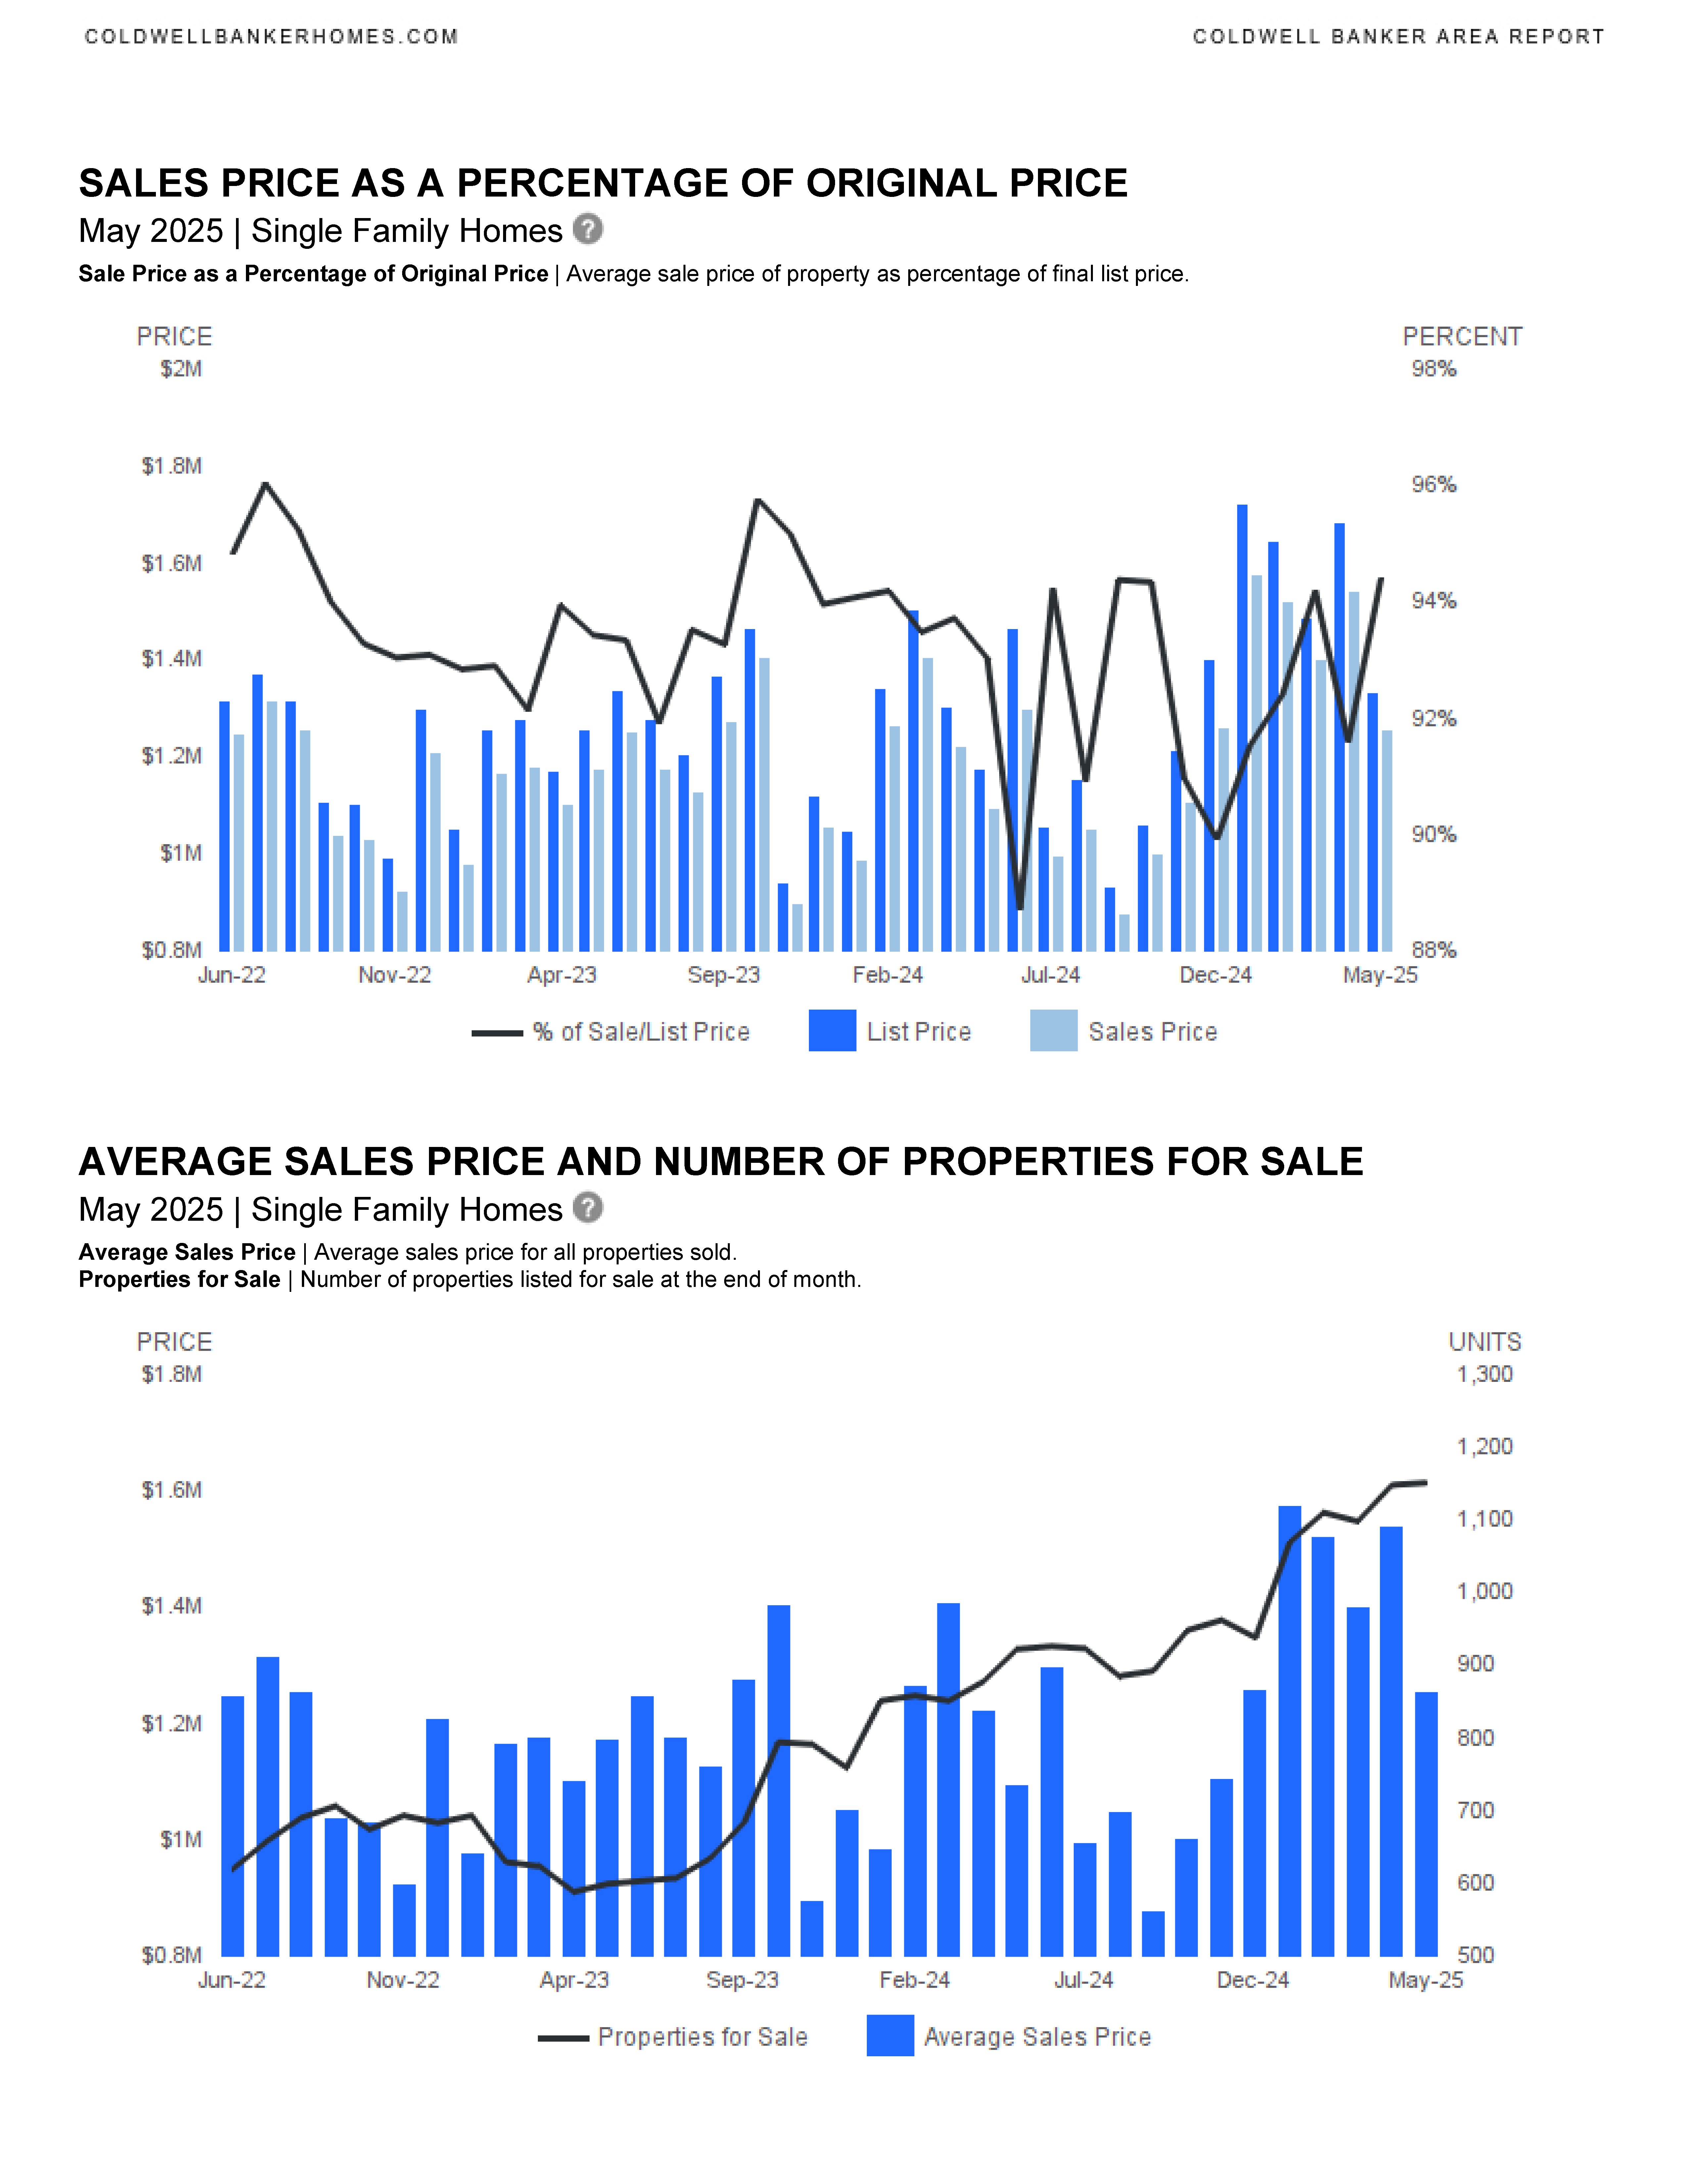
Sales of single-family homes in Fort Lauderdale have decreased significantly compared to last year. The median sales price has risen, indicating a shift towards higher-value properties.
- Number of sales decreased from 212 in May ’24 to 139 in May ’25, a drop of 34.43%.
- New listings fell from 375 in May ’24 to 288 in May ’25, a decrease of 23.2%.
- Median sales price increased by 23.95%, from $536,500 to $665,000.
- Average sales price rose by 14.83%, from $1,091,613 to $1,253,547.
- Average days on market increased from 61 to 72 days, an 18.03% rise.
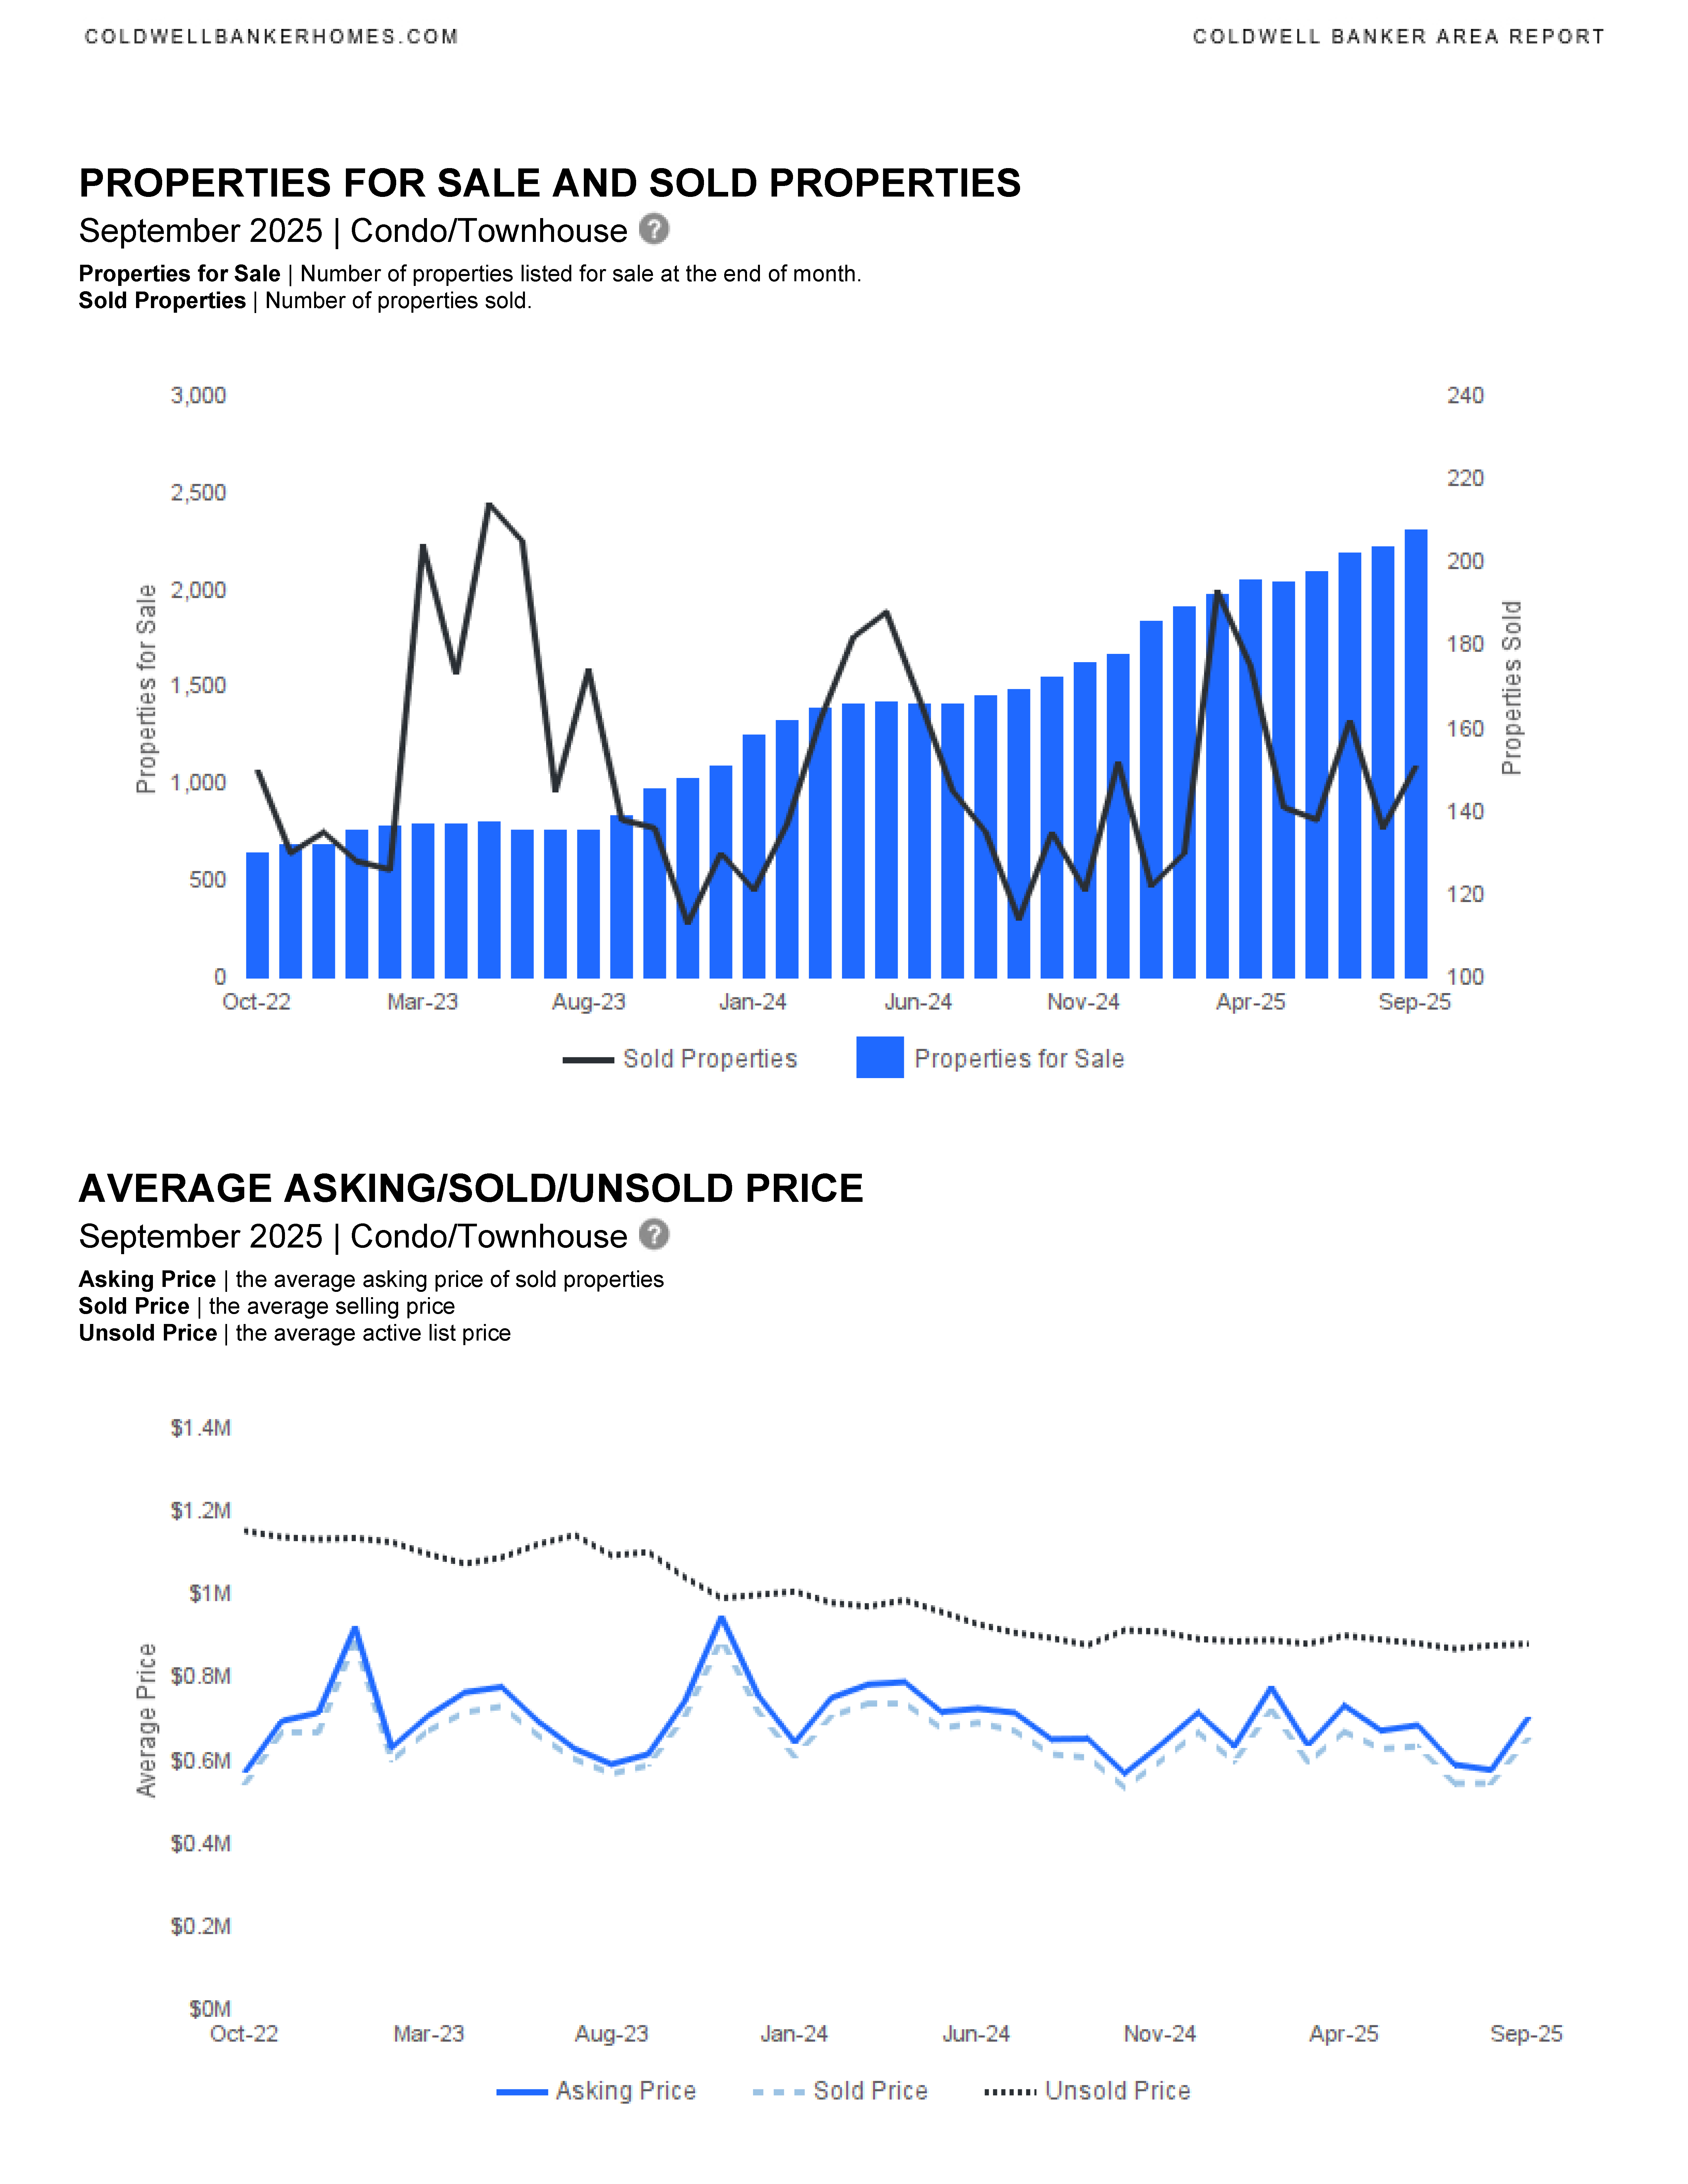
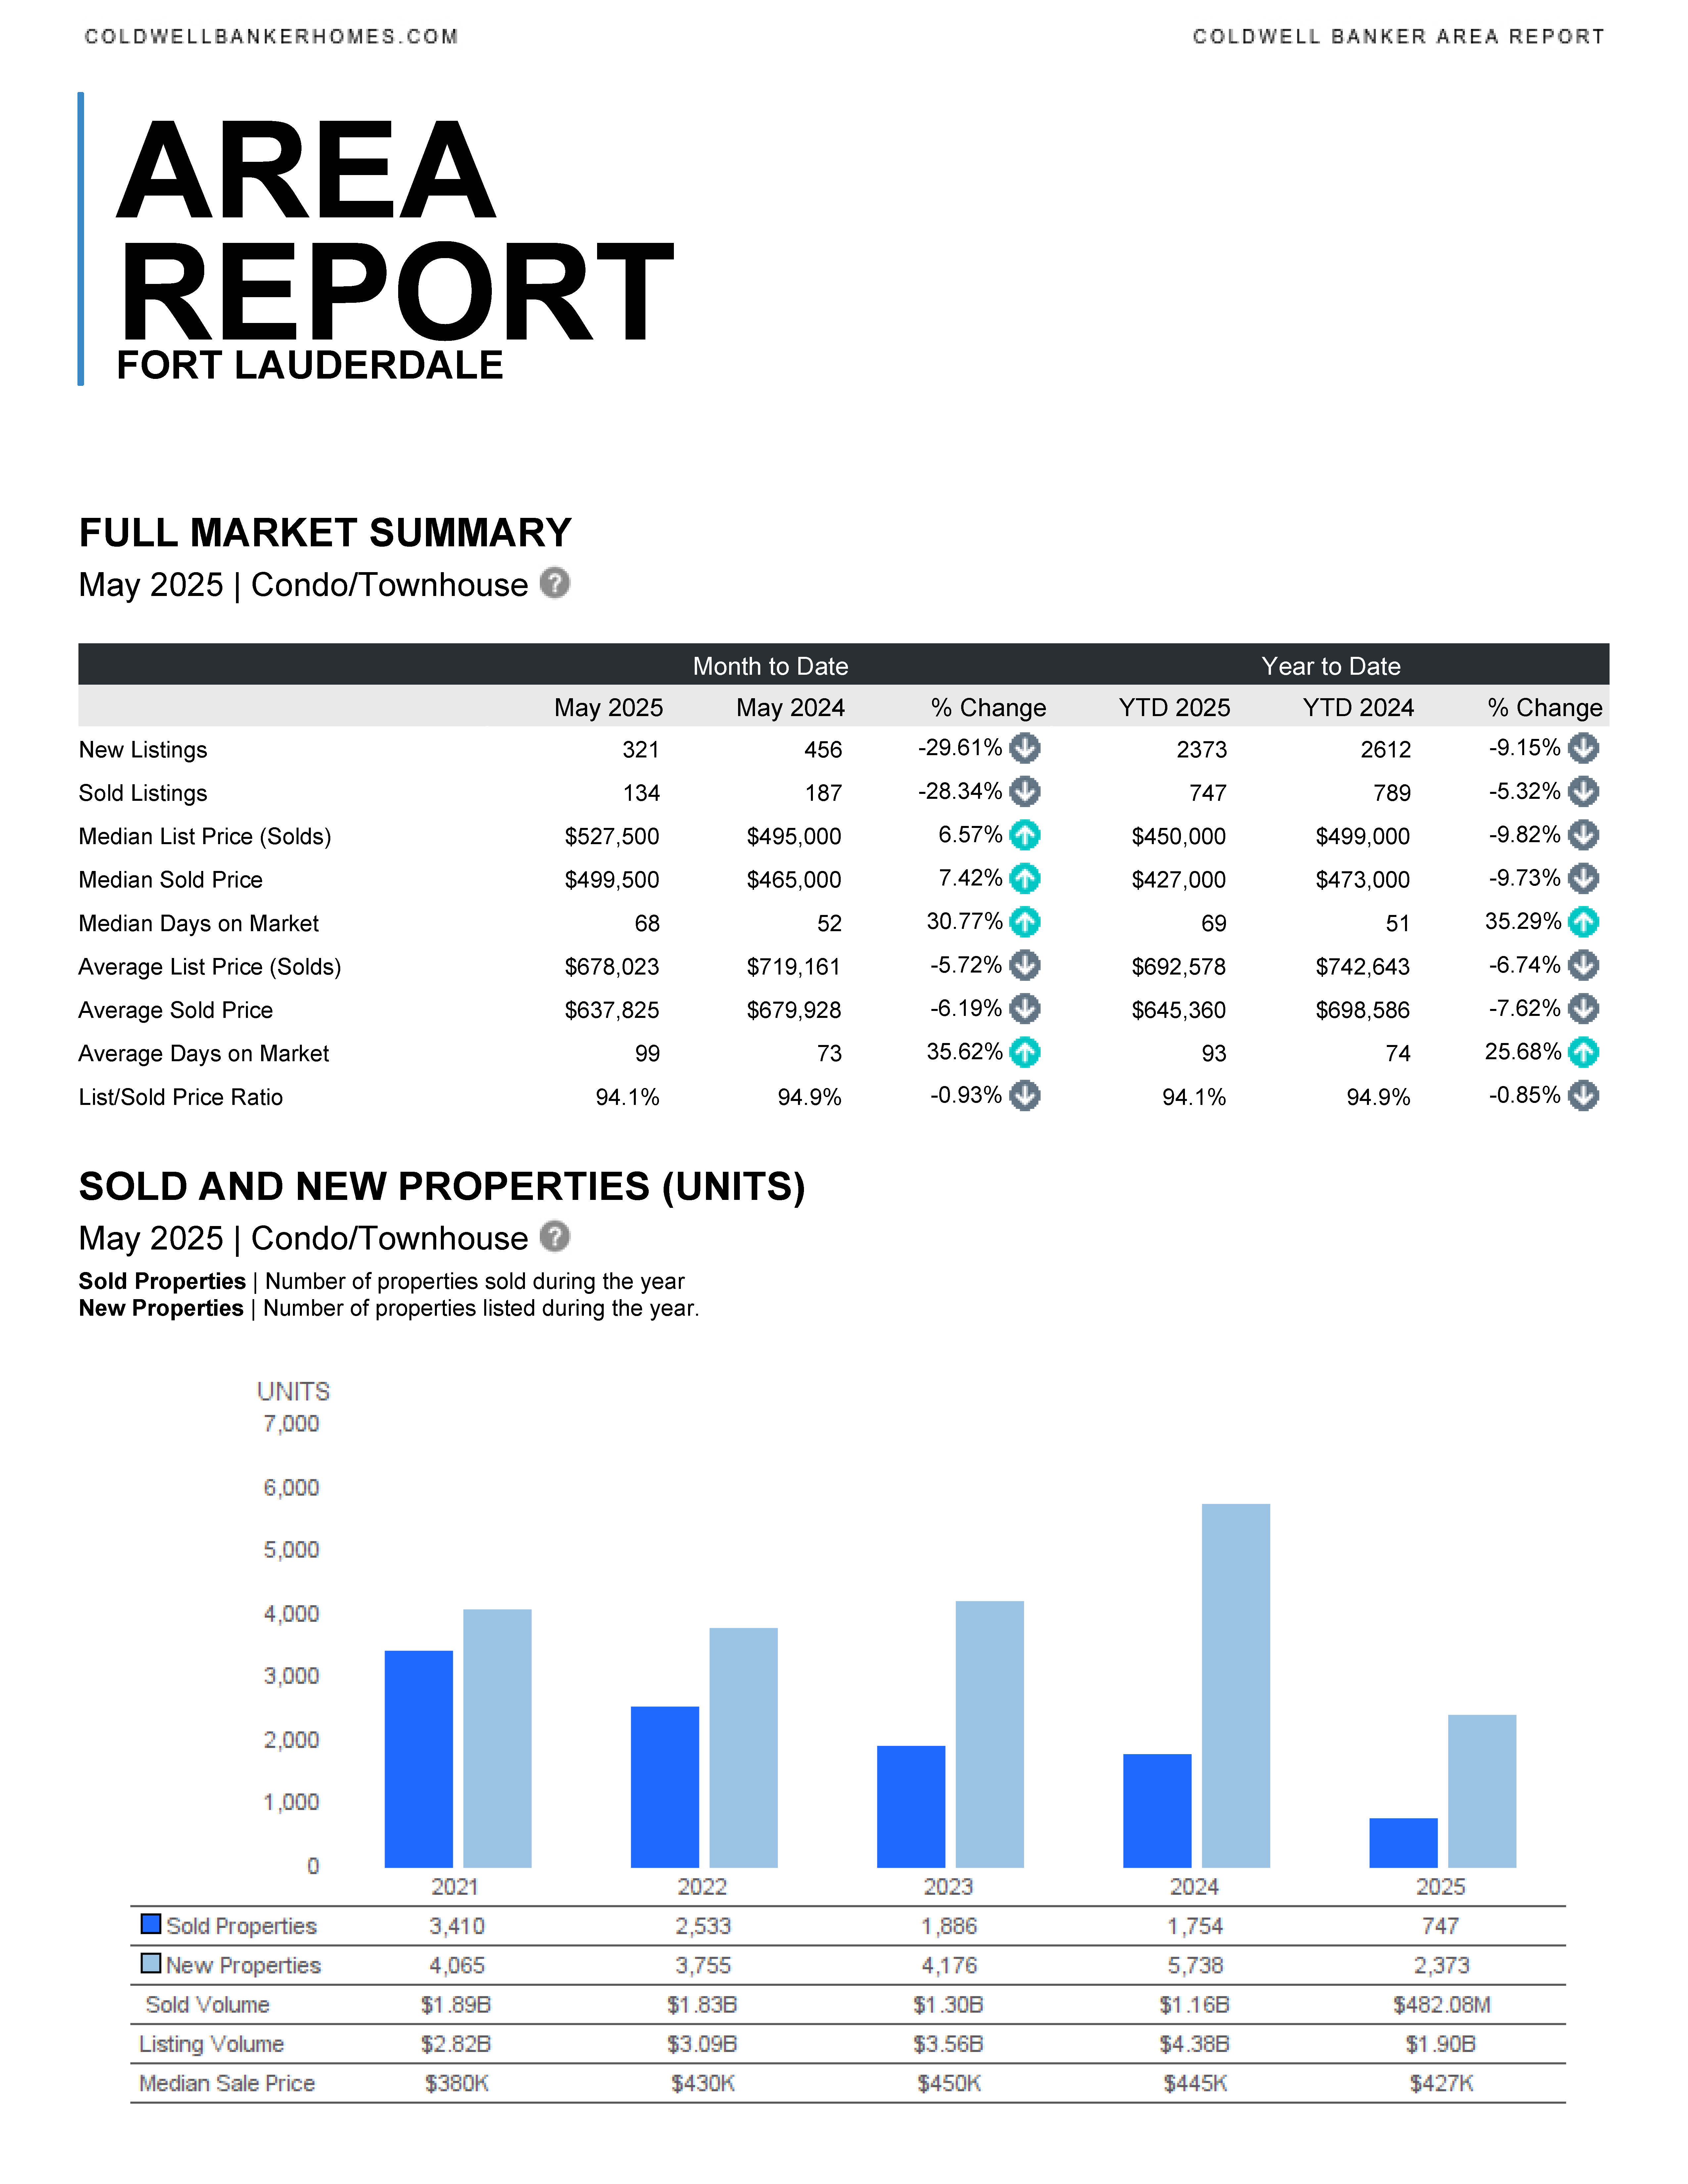
Condo/Townhouse Market Trends
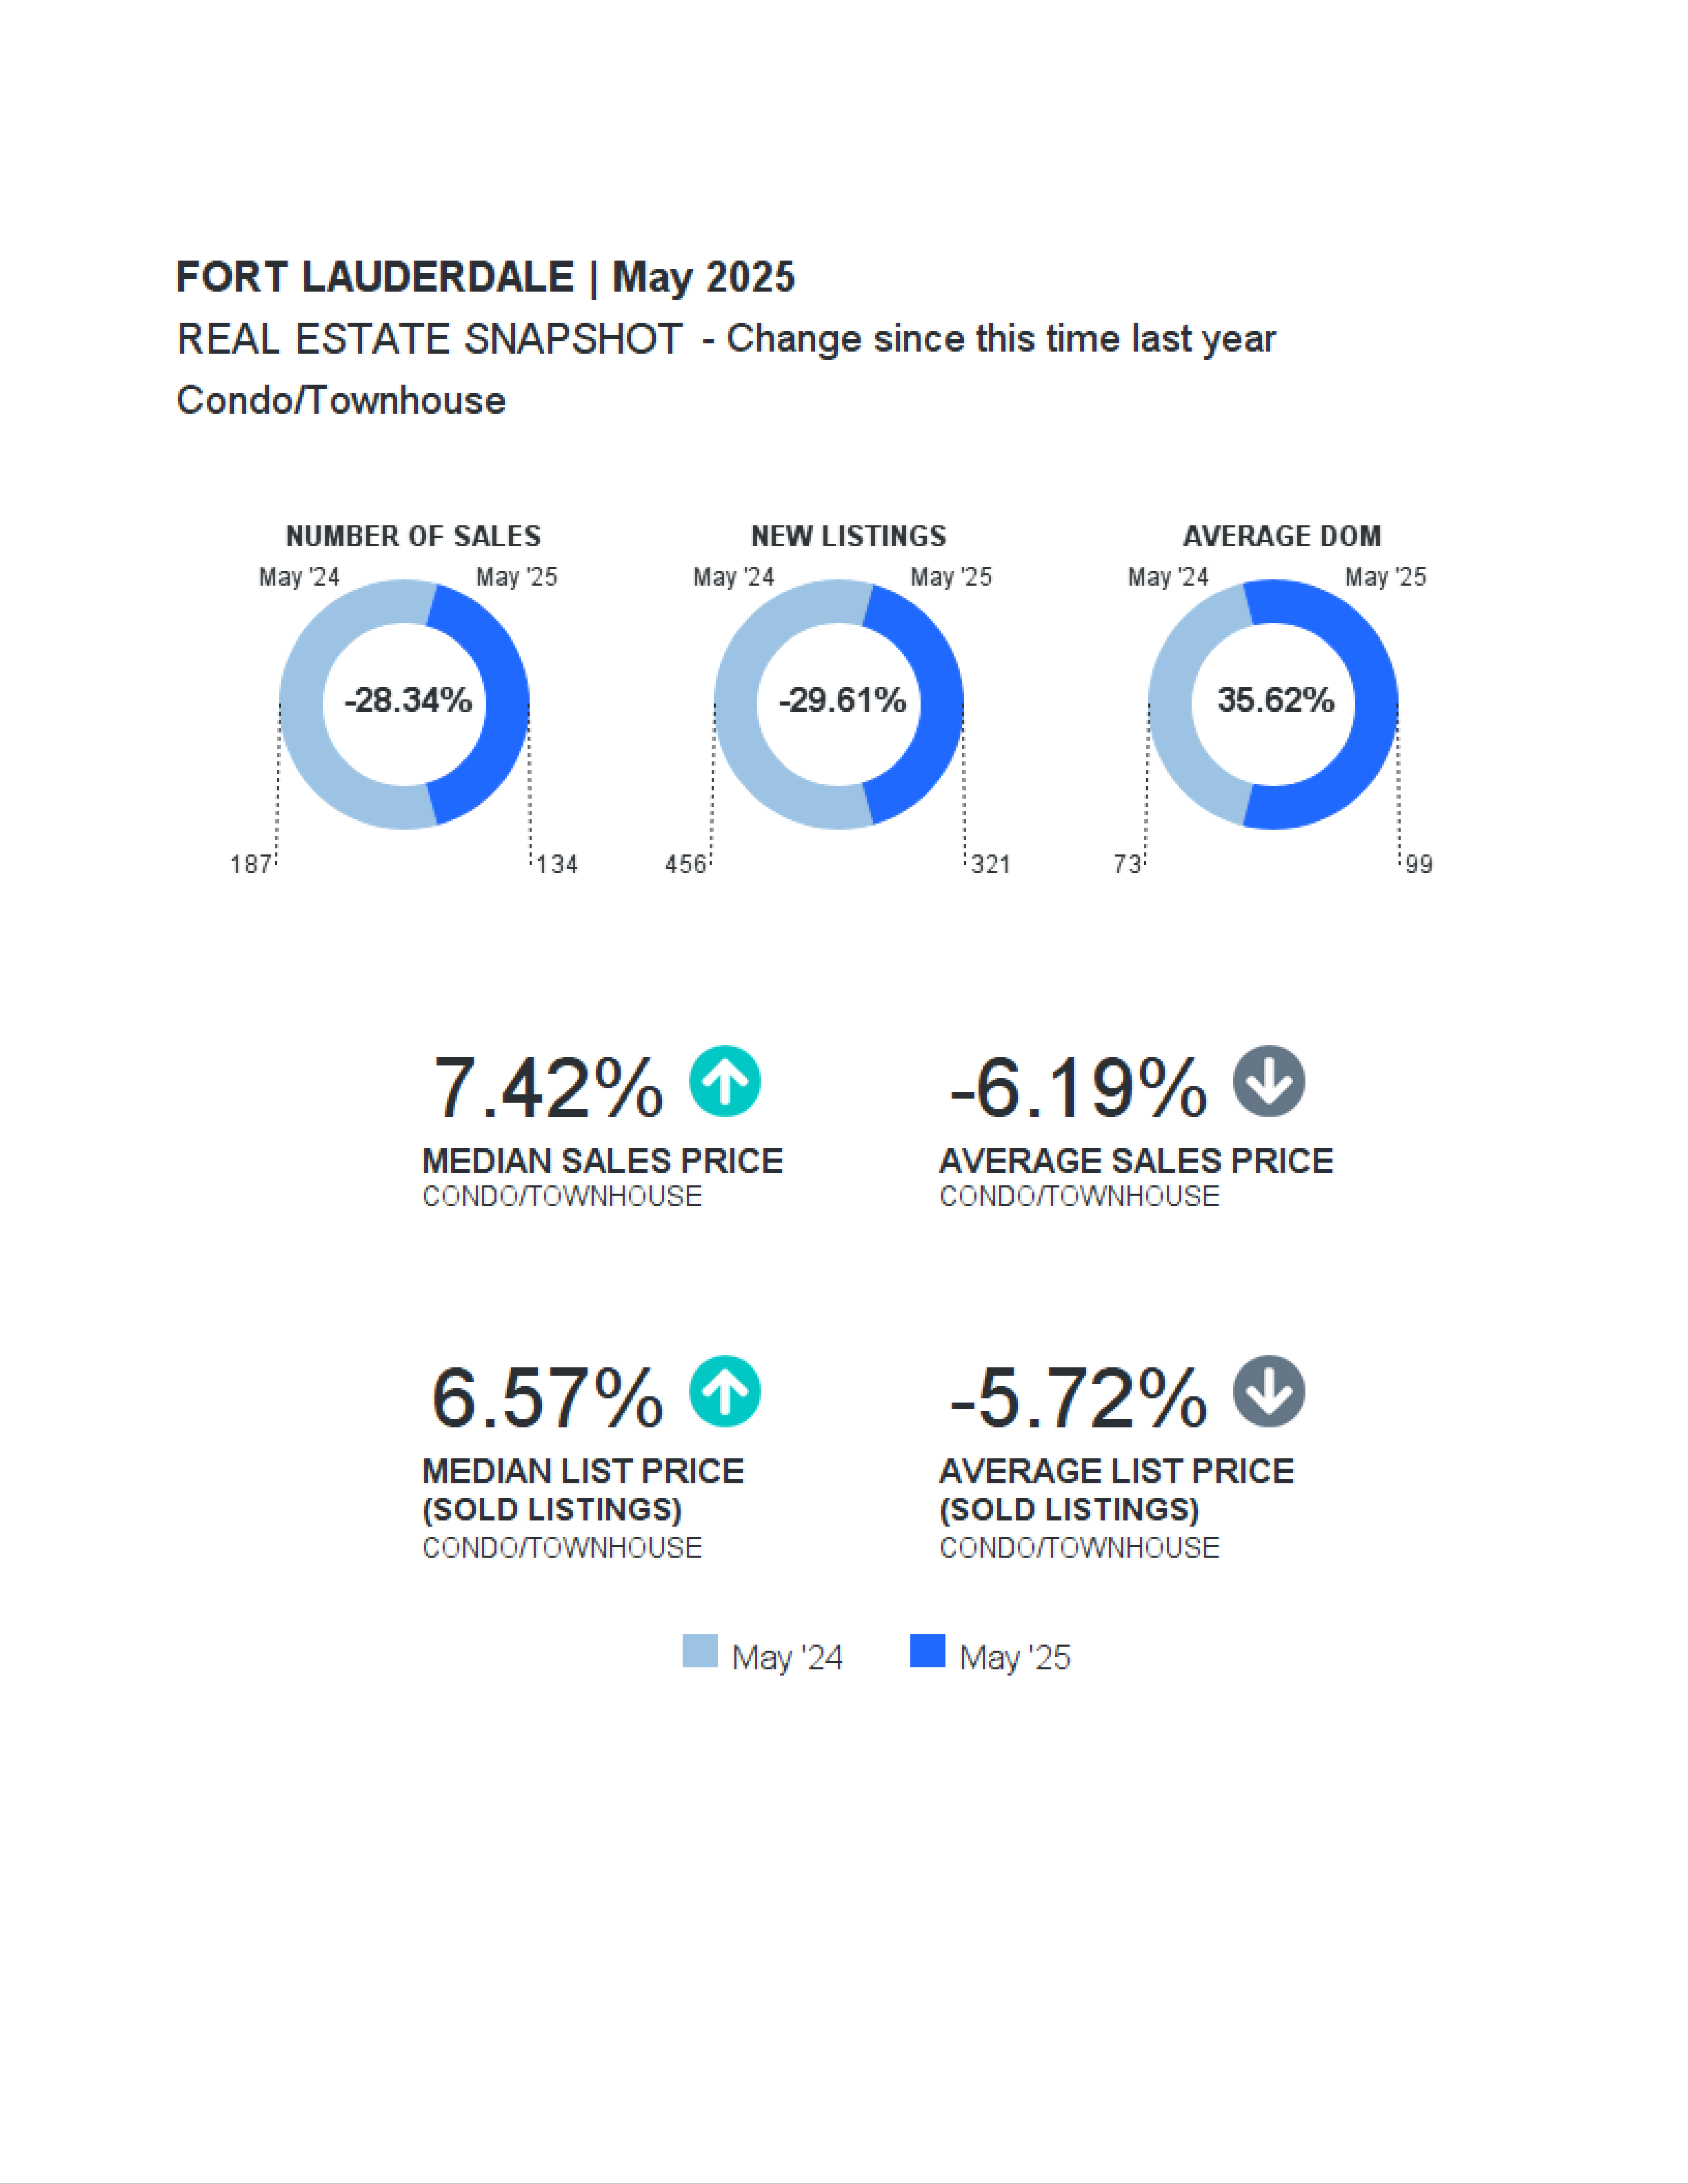
The condo/townhouse market in Fort Lauderdale has also seen a decline in sales, with a slight increase in median prices. This indicates a competitive market despite fewer transactions.
- Number of sales decreased from 187 in May ’24 to 134 in May ’25, a decline of 28.34%.
- New listings dropped from 456 in May ’24 to 321 in May ’25, a decrease of 29.61%.
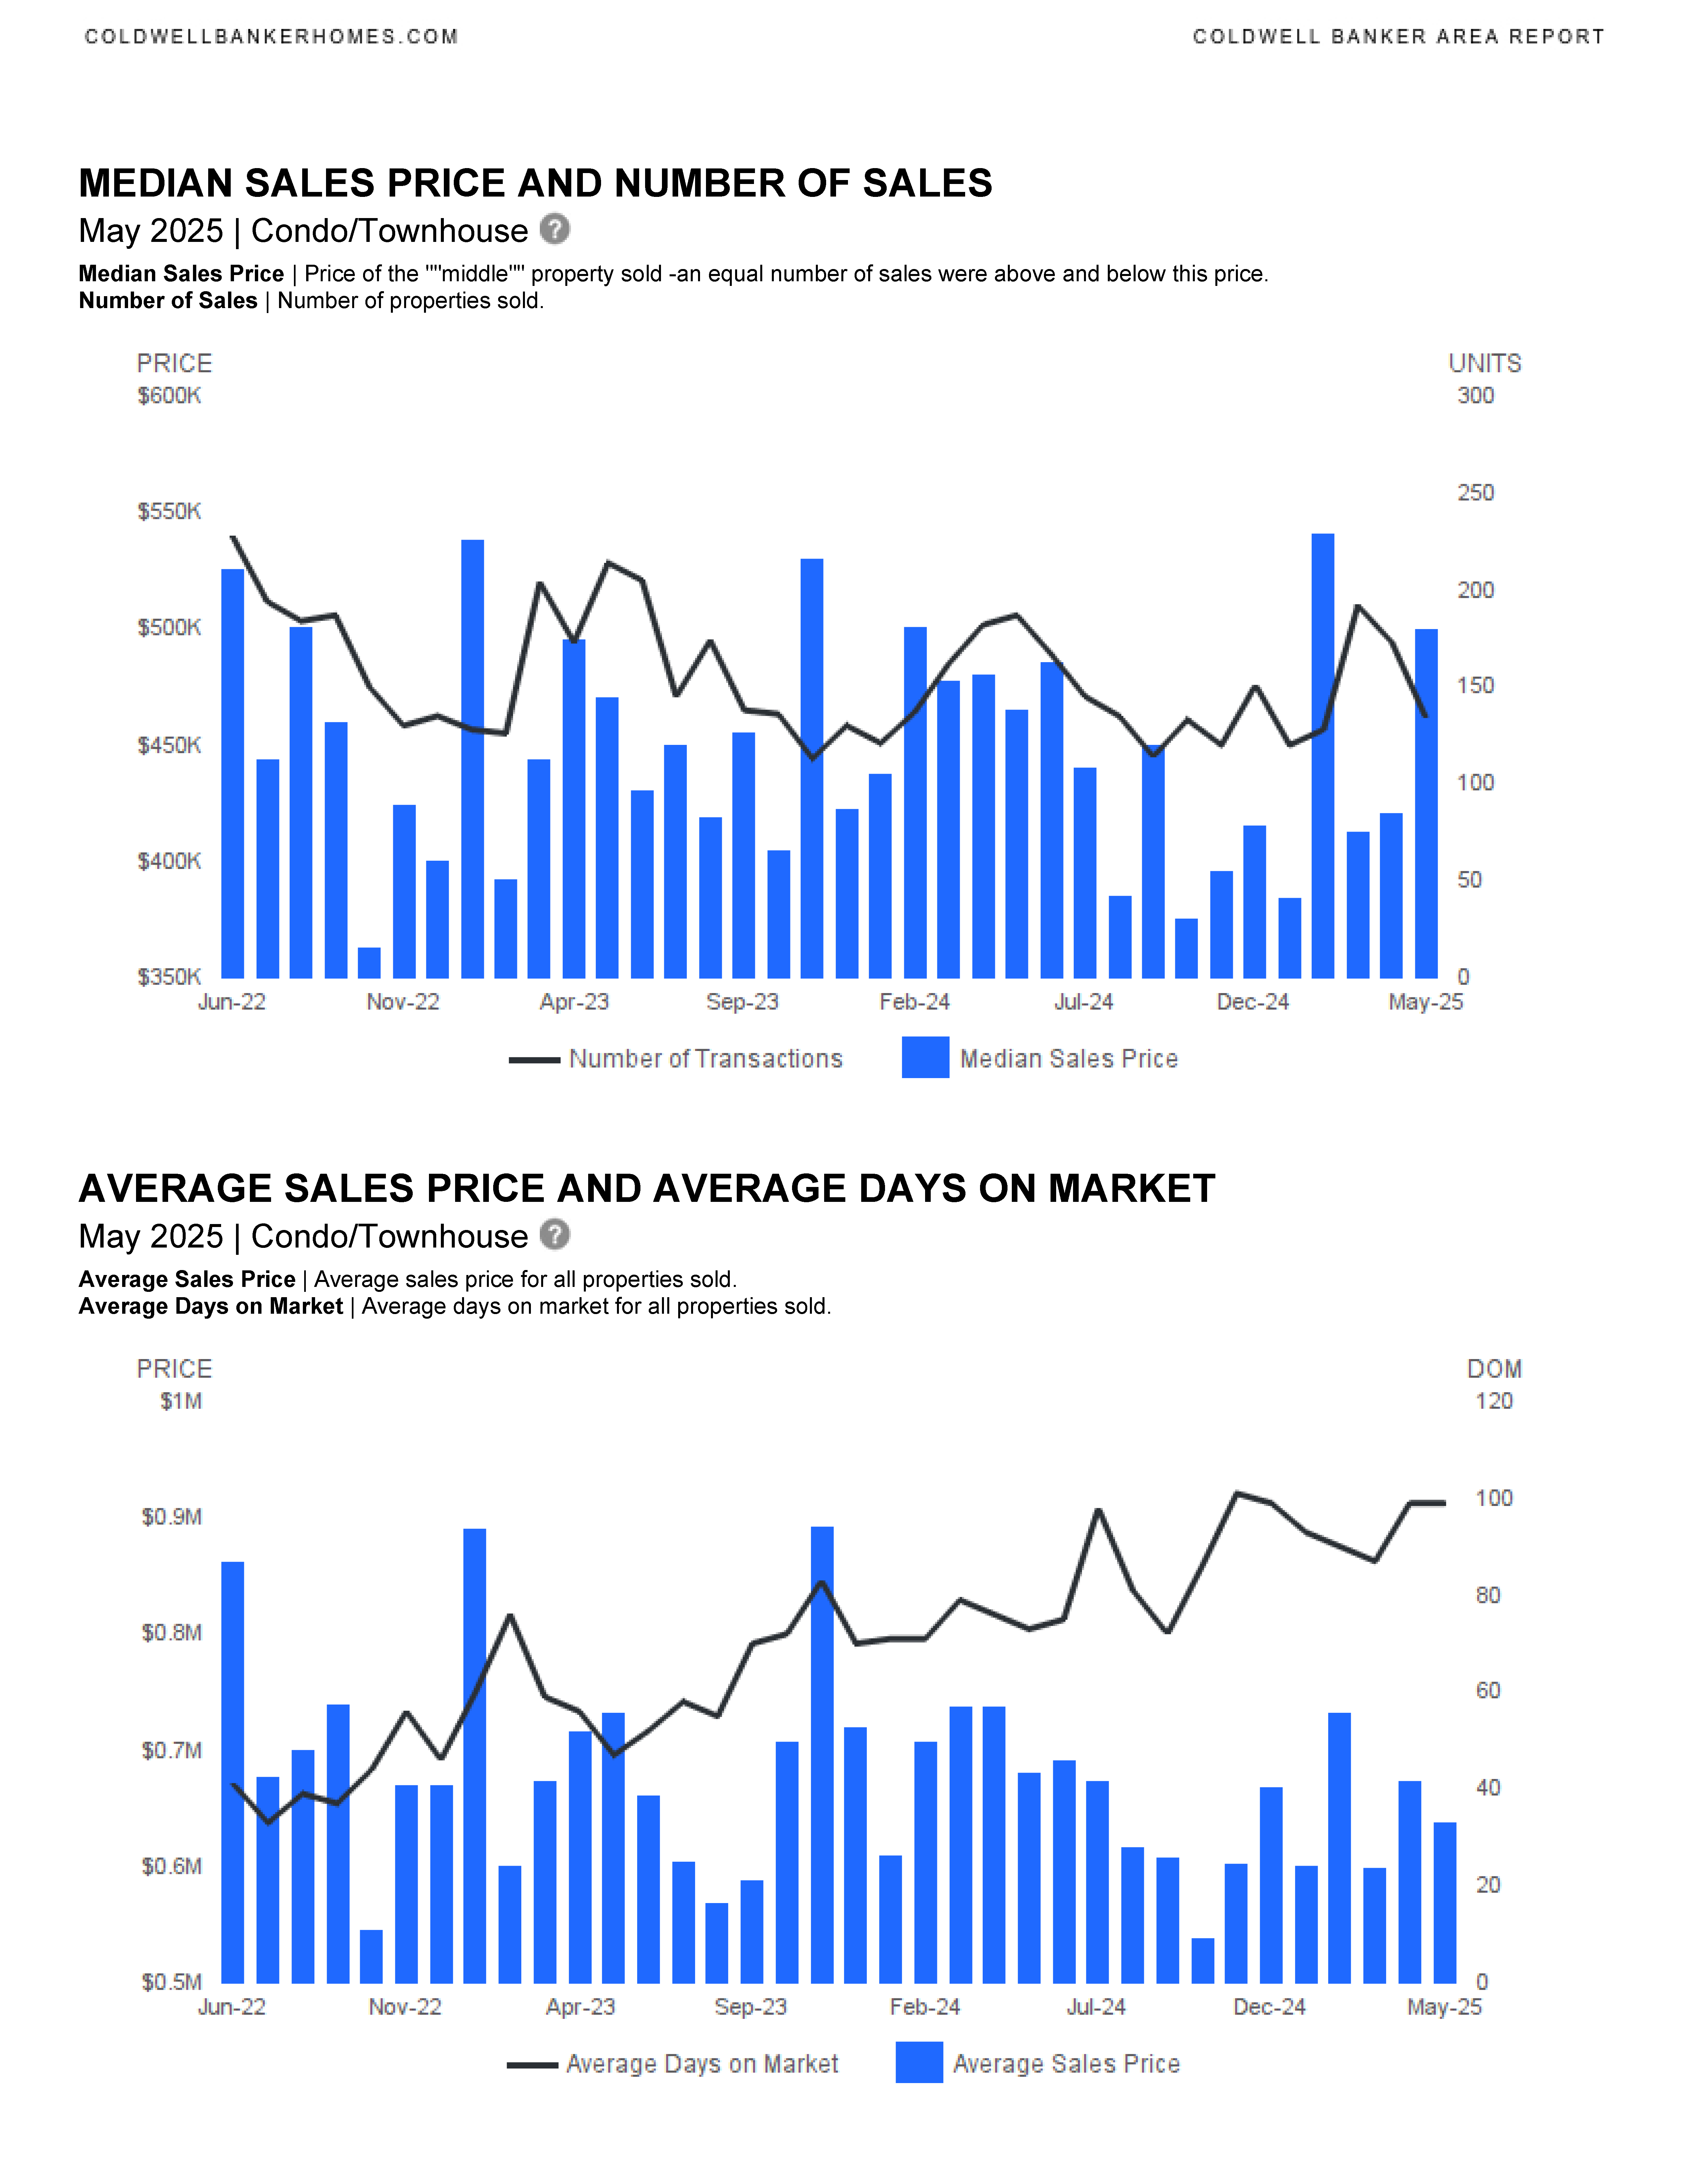
- Median sales price increased by 7.42%, from $465,000 to $499,500.
- Average sales price decreased by 6.19%, from $679,928 to $637,825.
- Average days on market increased from 73 to 99 days, a rise of 35.62%.
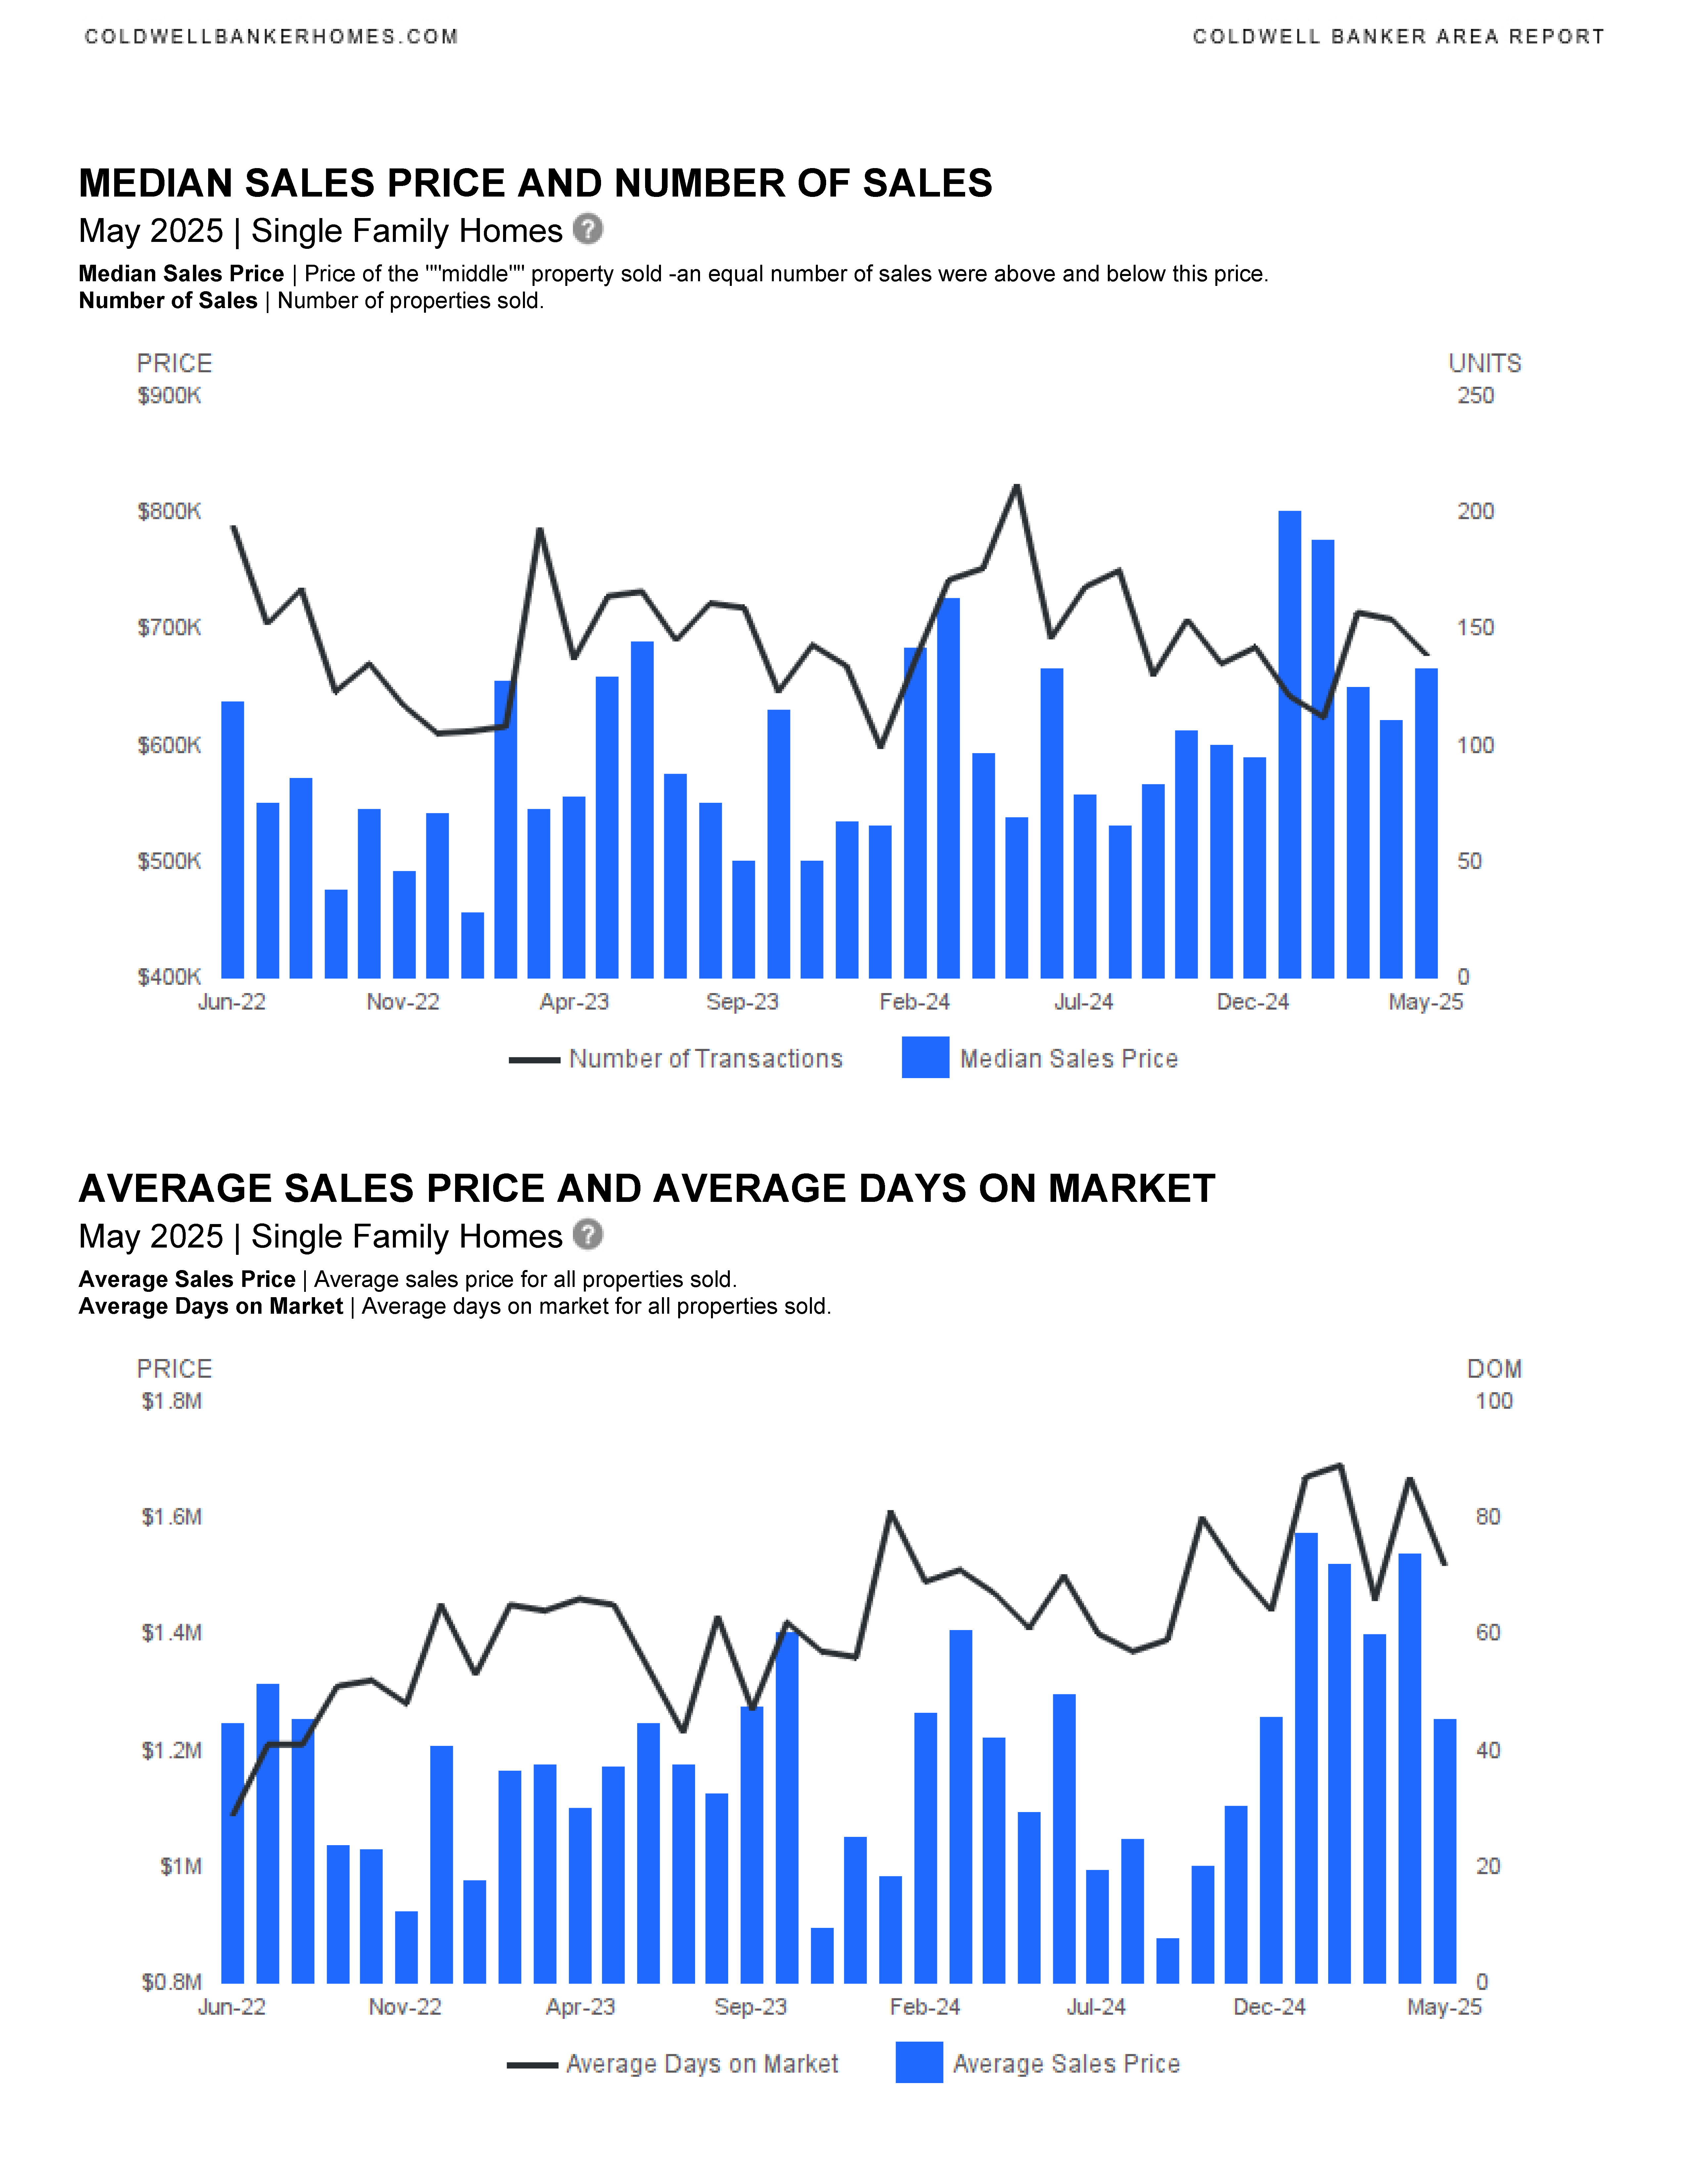
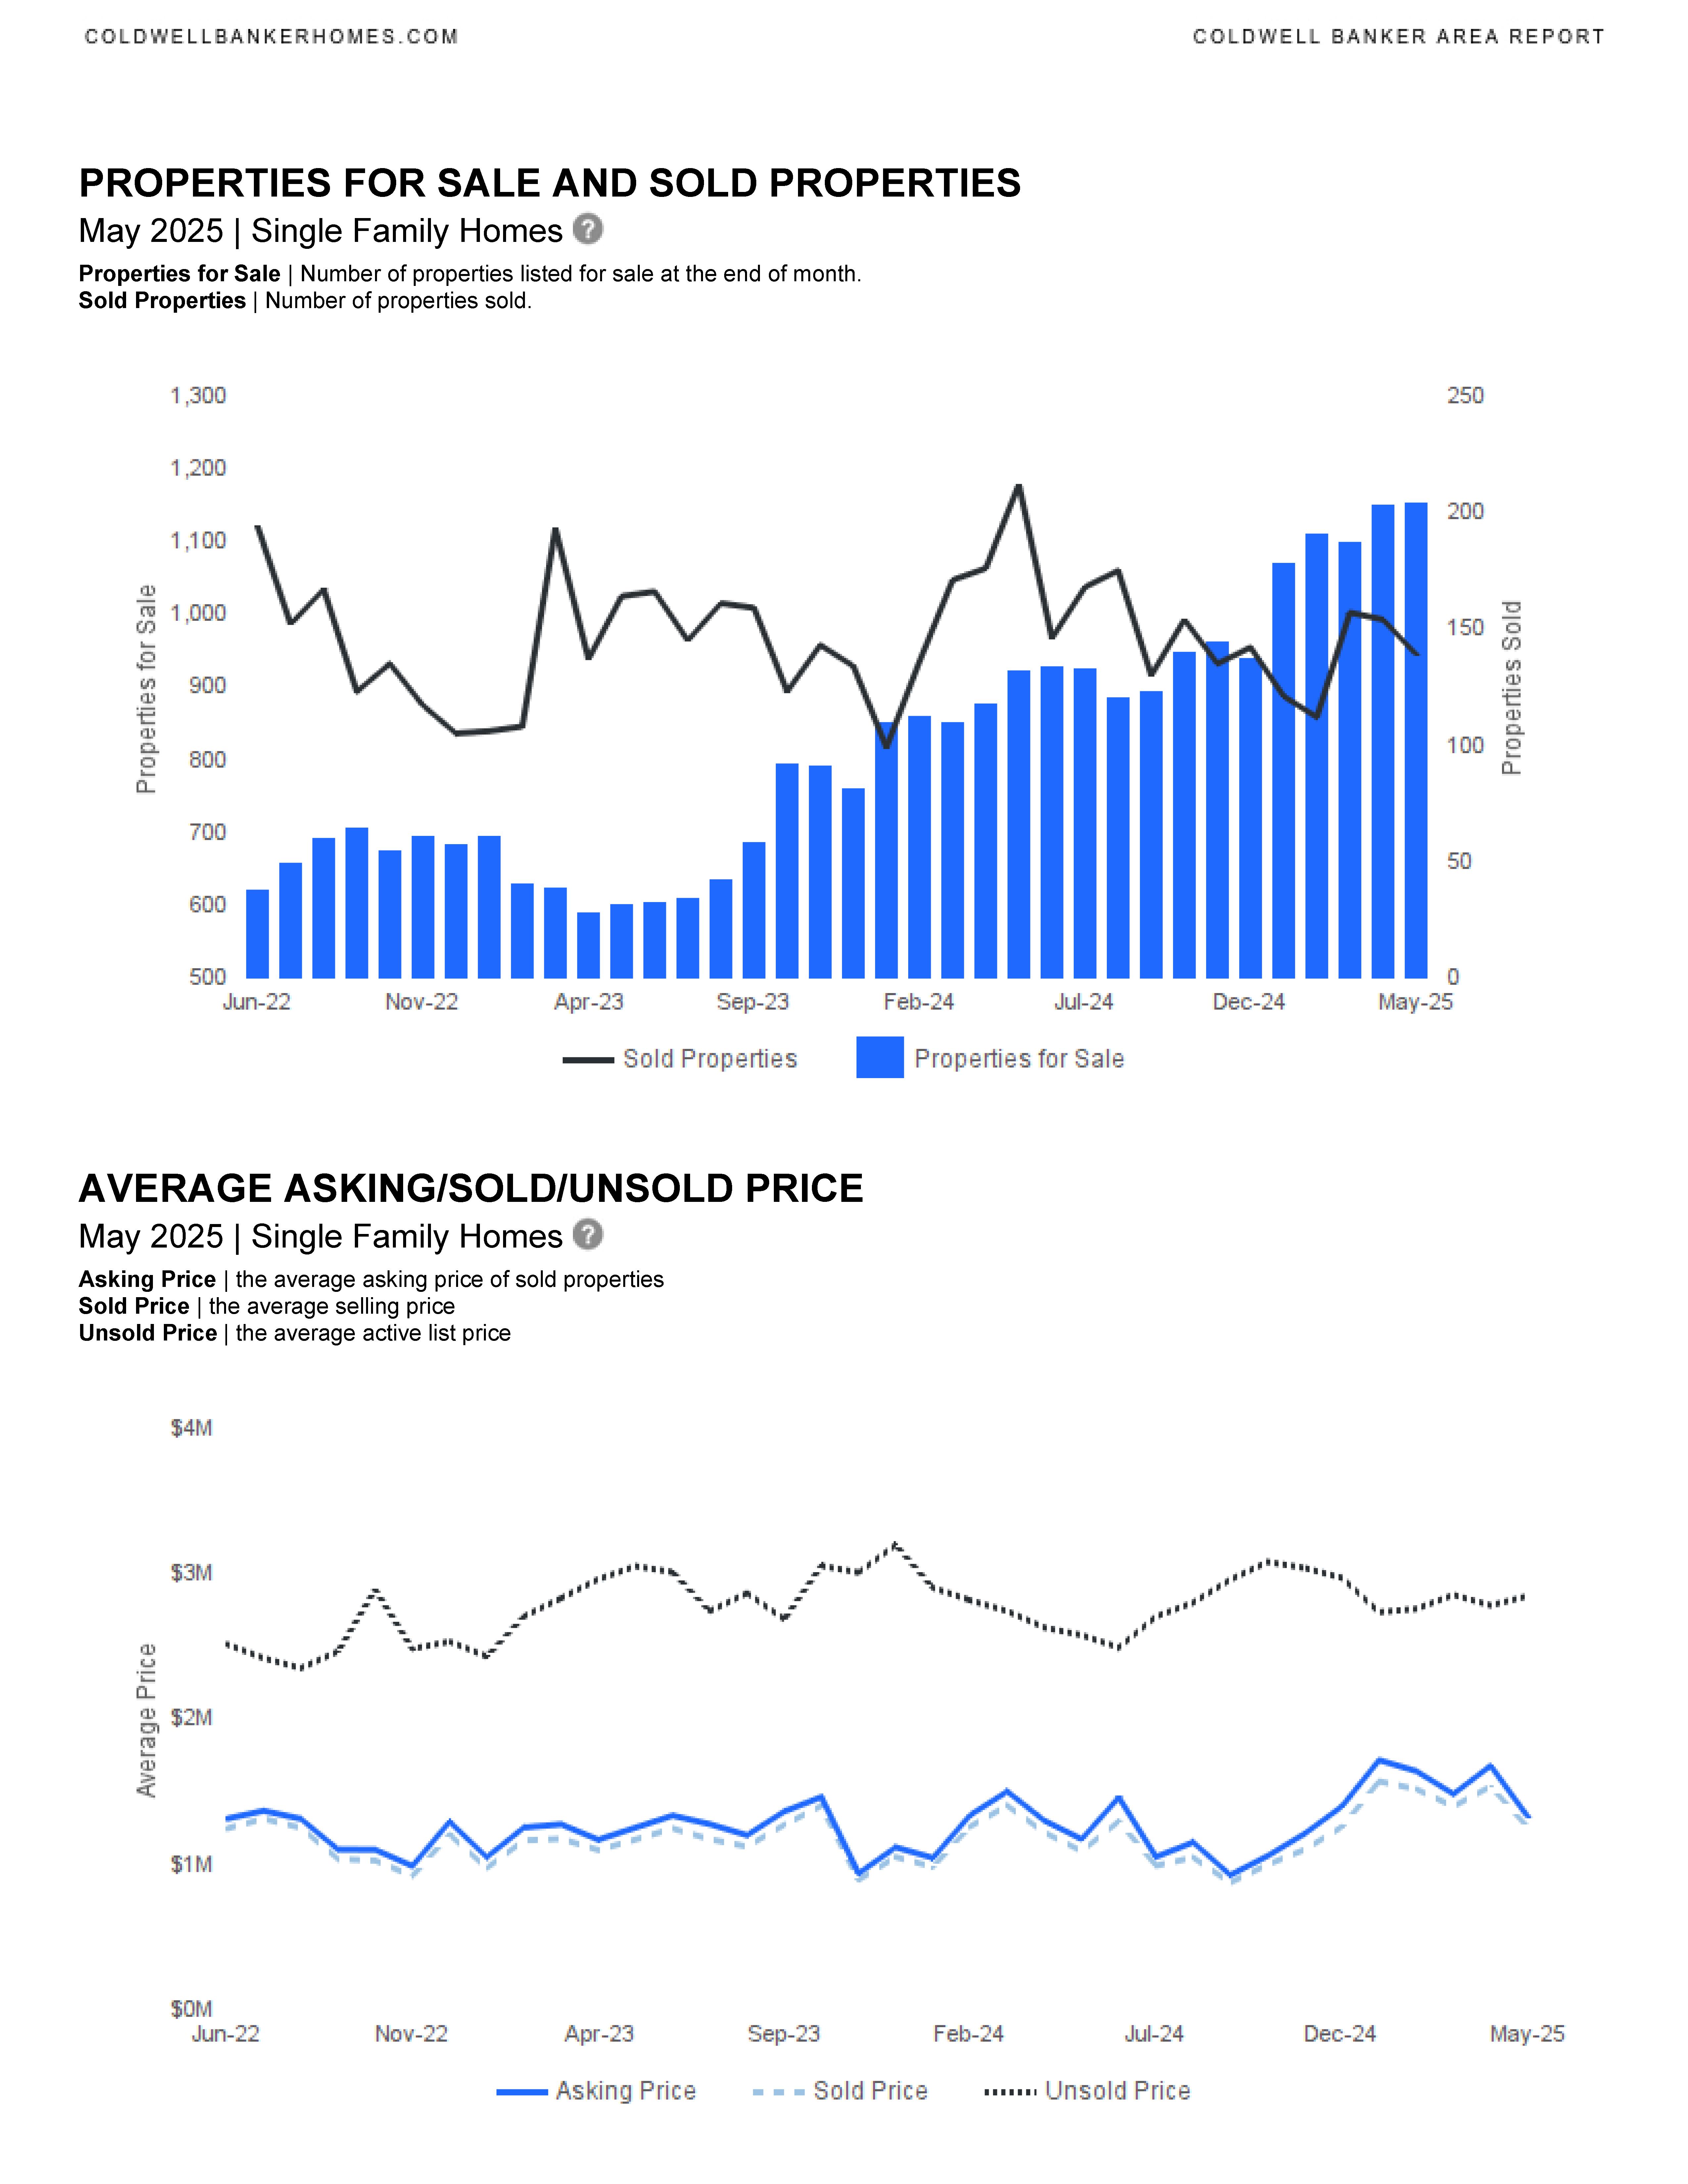
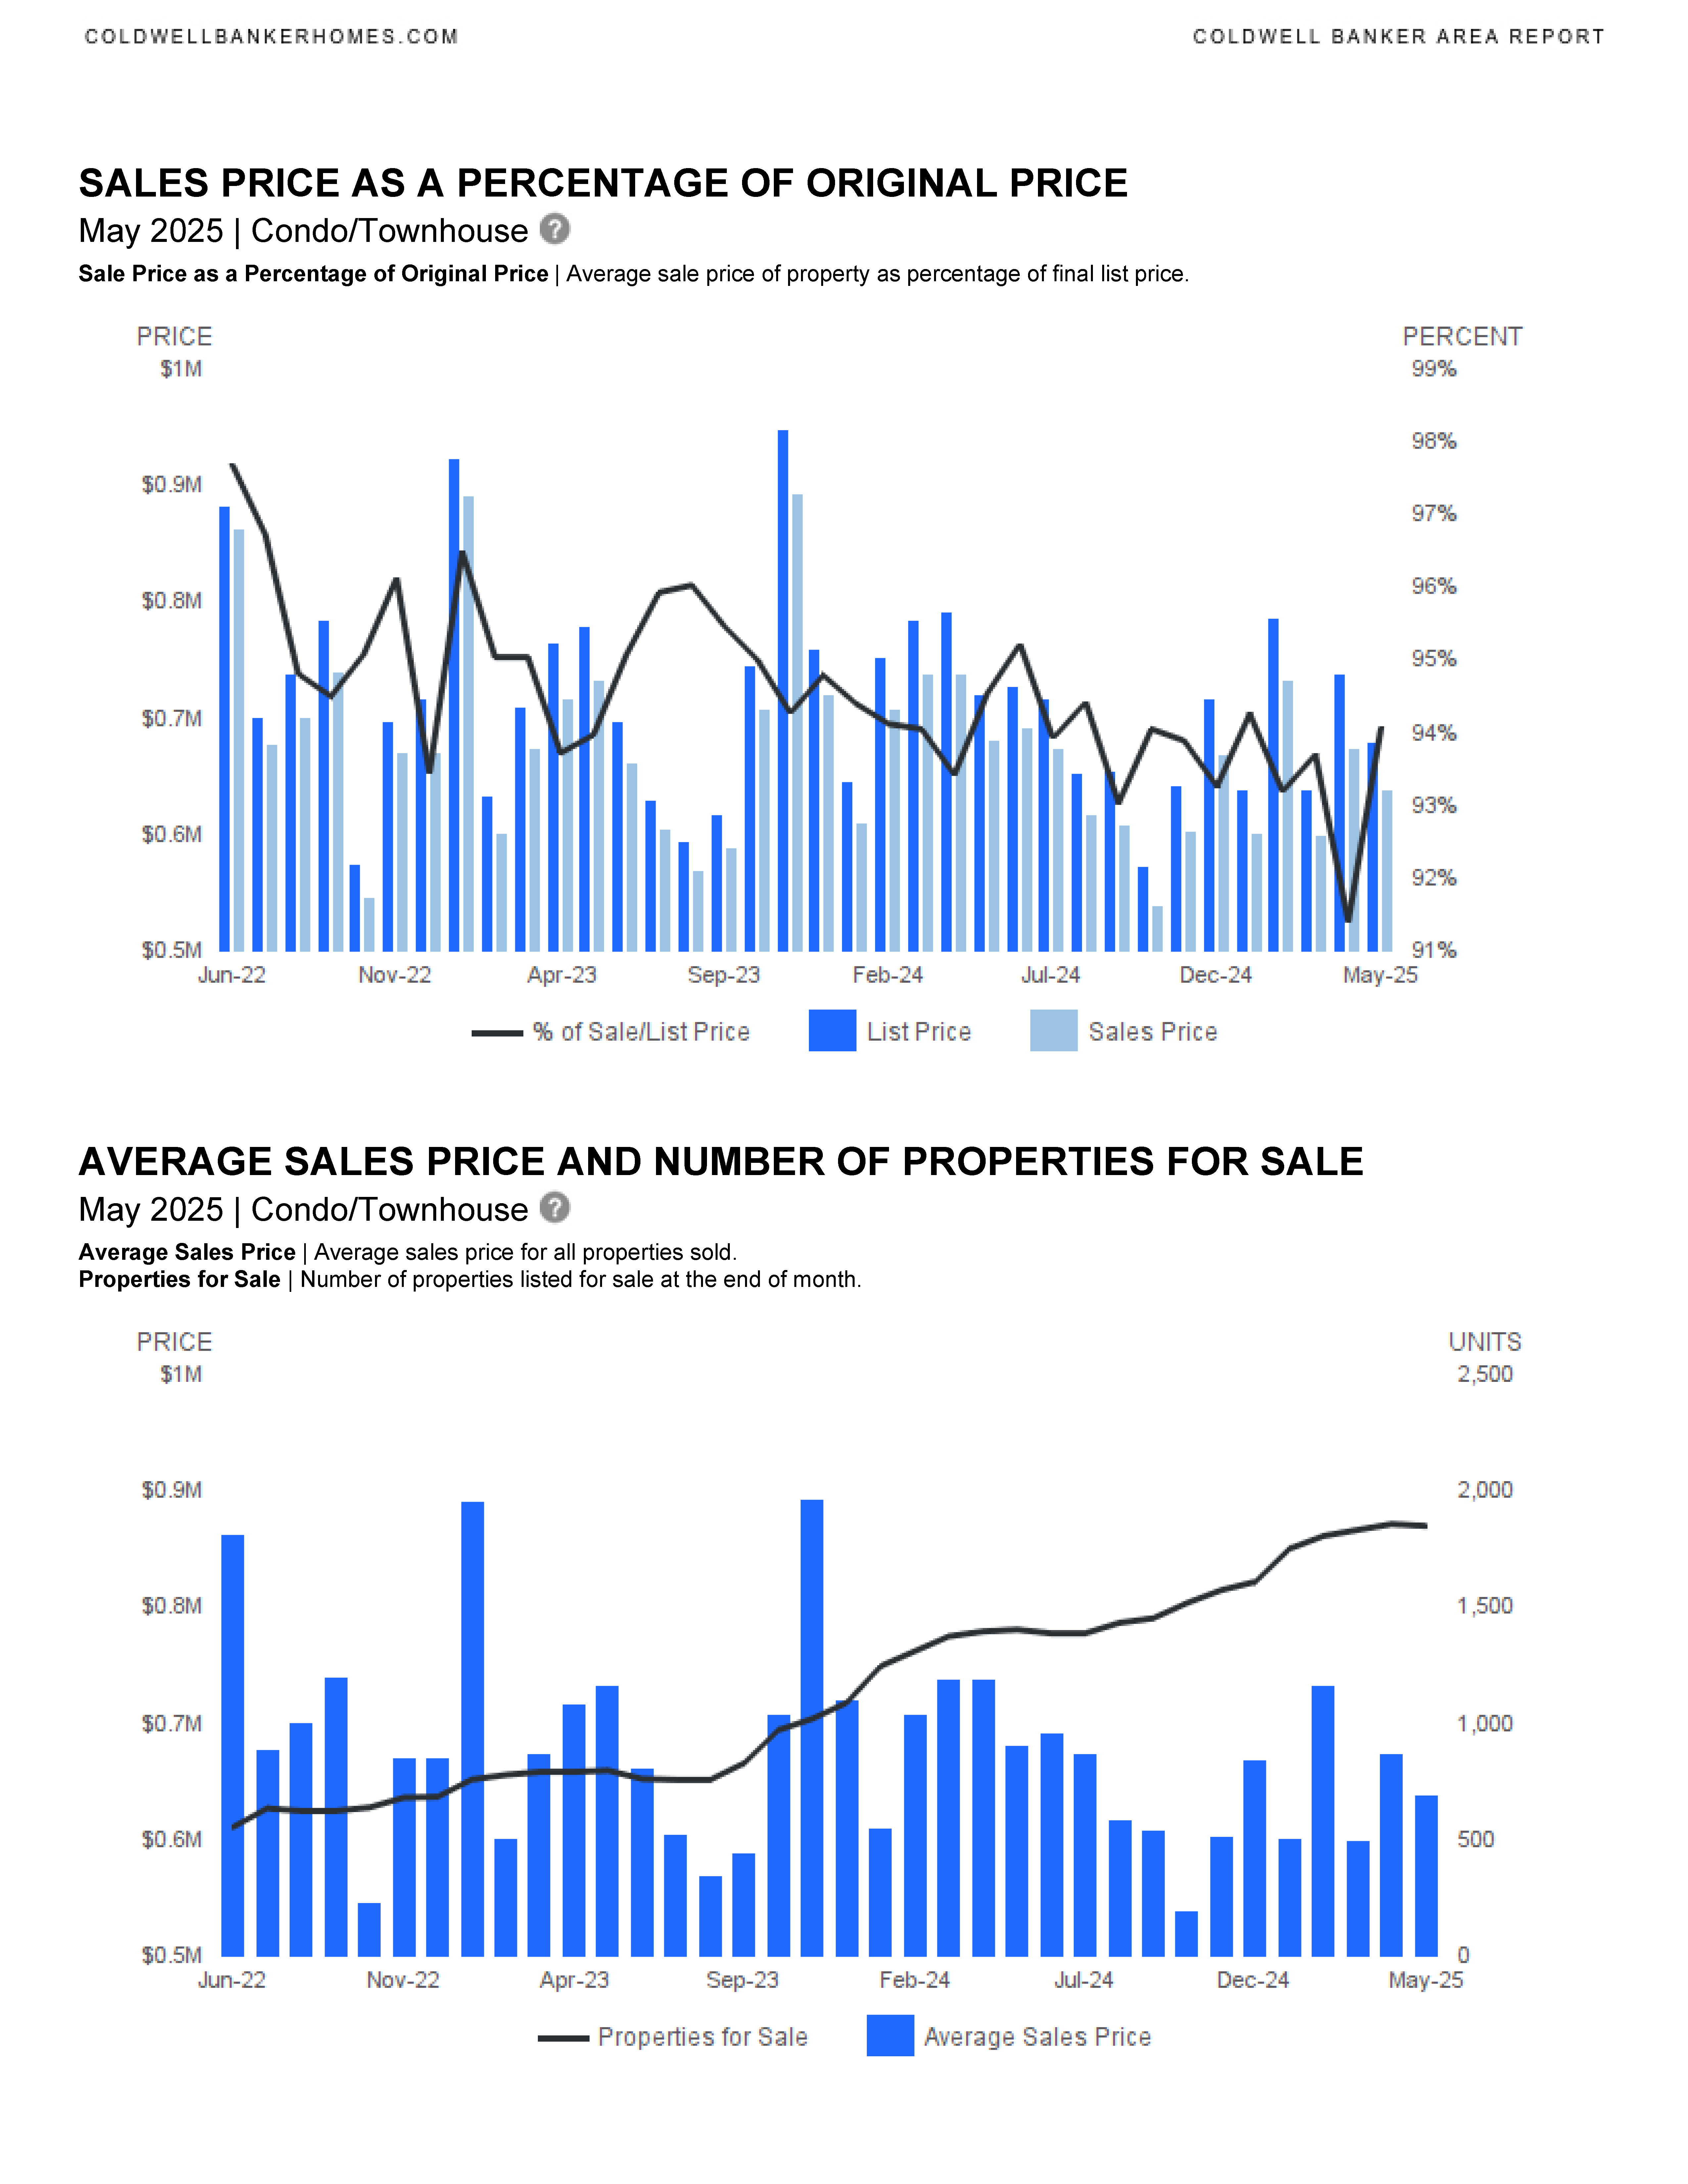
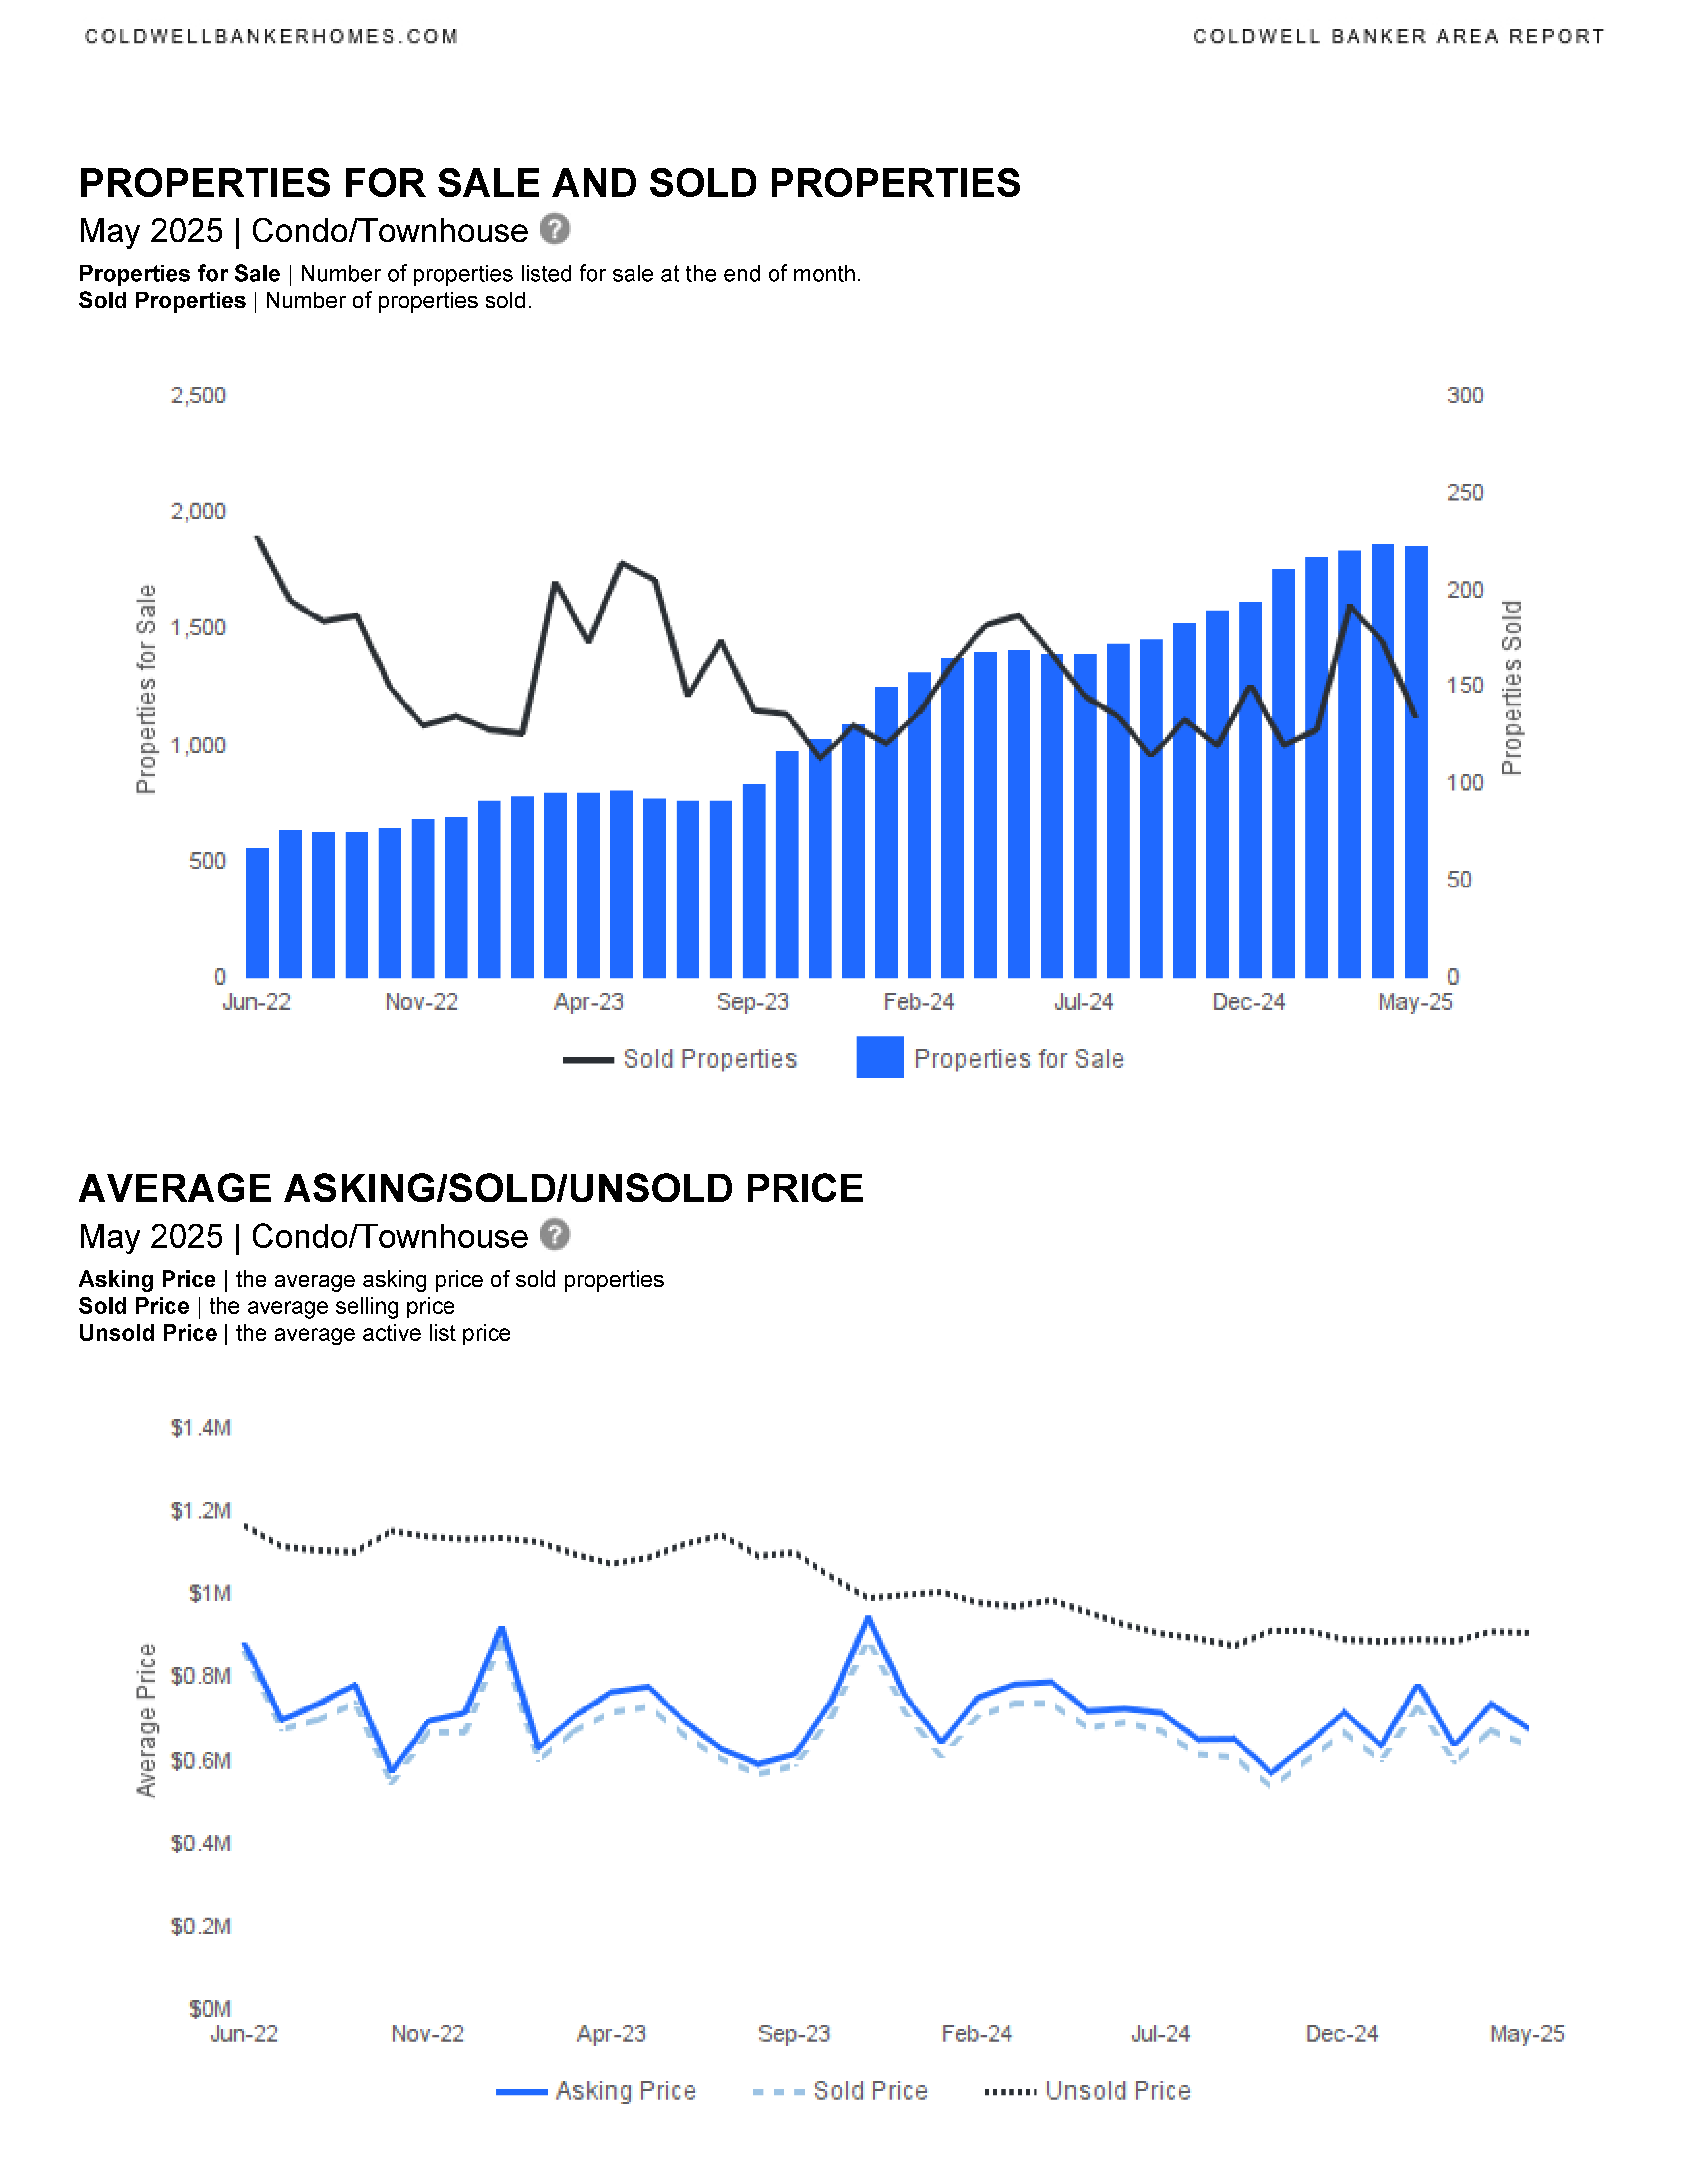
Market Summary and Key Statistics
The overall market summary highlights the trends in listings, sales, and pricing for both single-family homes and condos/townhouses. The data reflects a tightening inventory and rising prices.
- Total new listings for single-family homes year-to-date: 1,898, down 3.27% from last year.
- Total sold listings for single-family homes year-to-date: 794, down 13.98% from last year.
- Total new listings for condos/townhouses year-to-date: 2,612, down 9.15% from last year.
- Total sold listings for condos/townhouses year-to-date: 789, down 5.32% from last year.
- The list/sold price ratio for single-family homes is 95.7%, while for condos/townhouses it is 94.1%.
Commonly asked questions while reviewing the reports:
What is the difference between “Median Sales Price” and “Average Sales Price”?
Median Sales Price | Price of the “”middle”” property sold -an equal number of sales were above and below this price.
Average Sales Price | Average sales price for all properties sold.
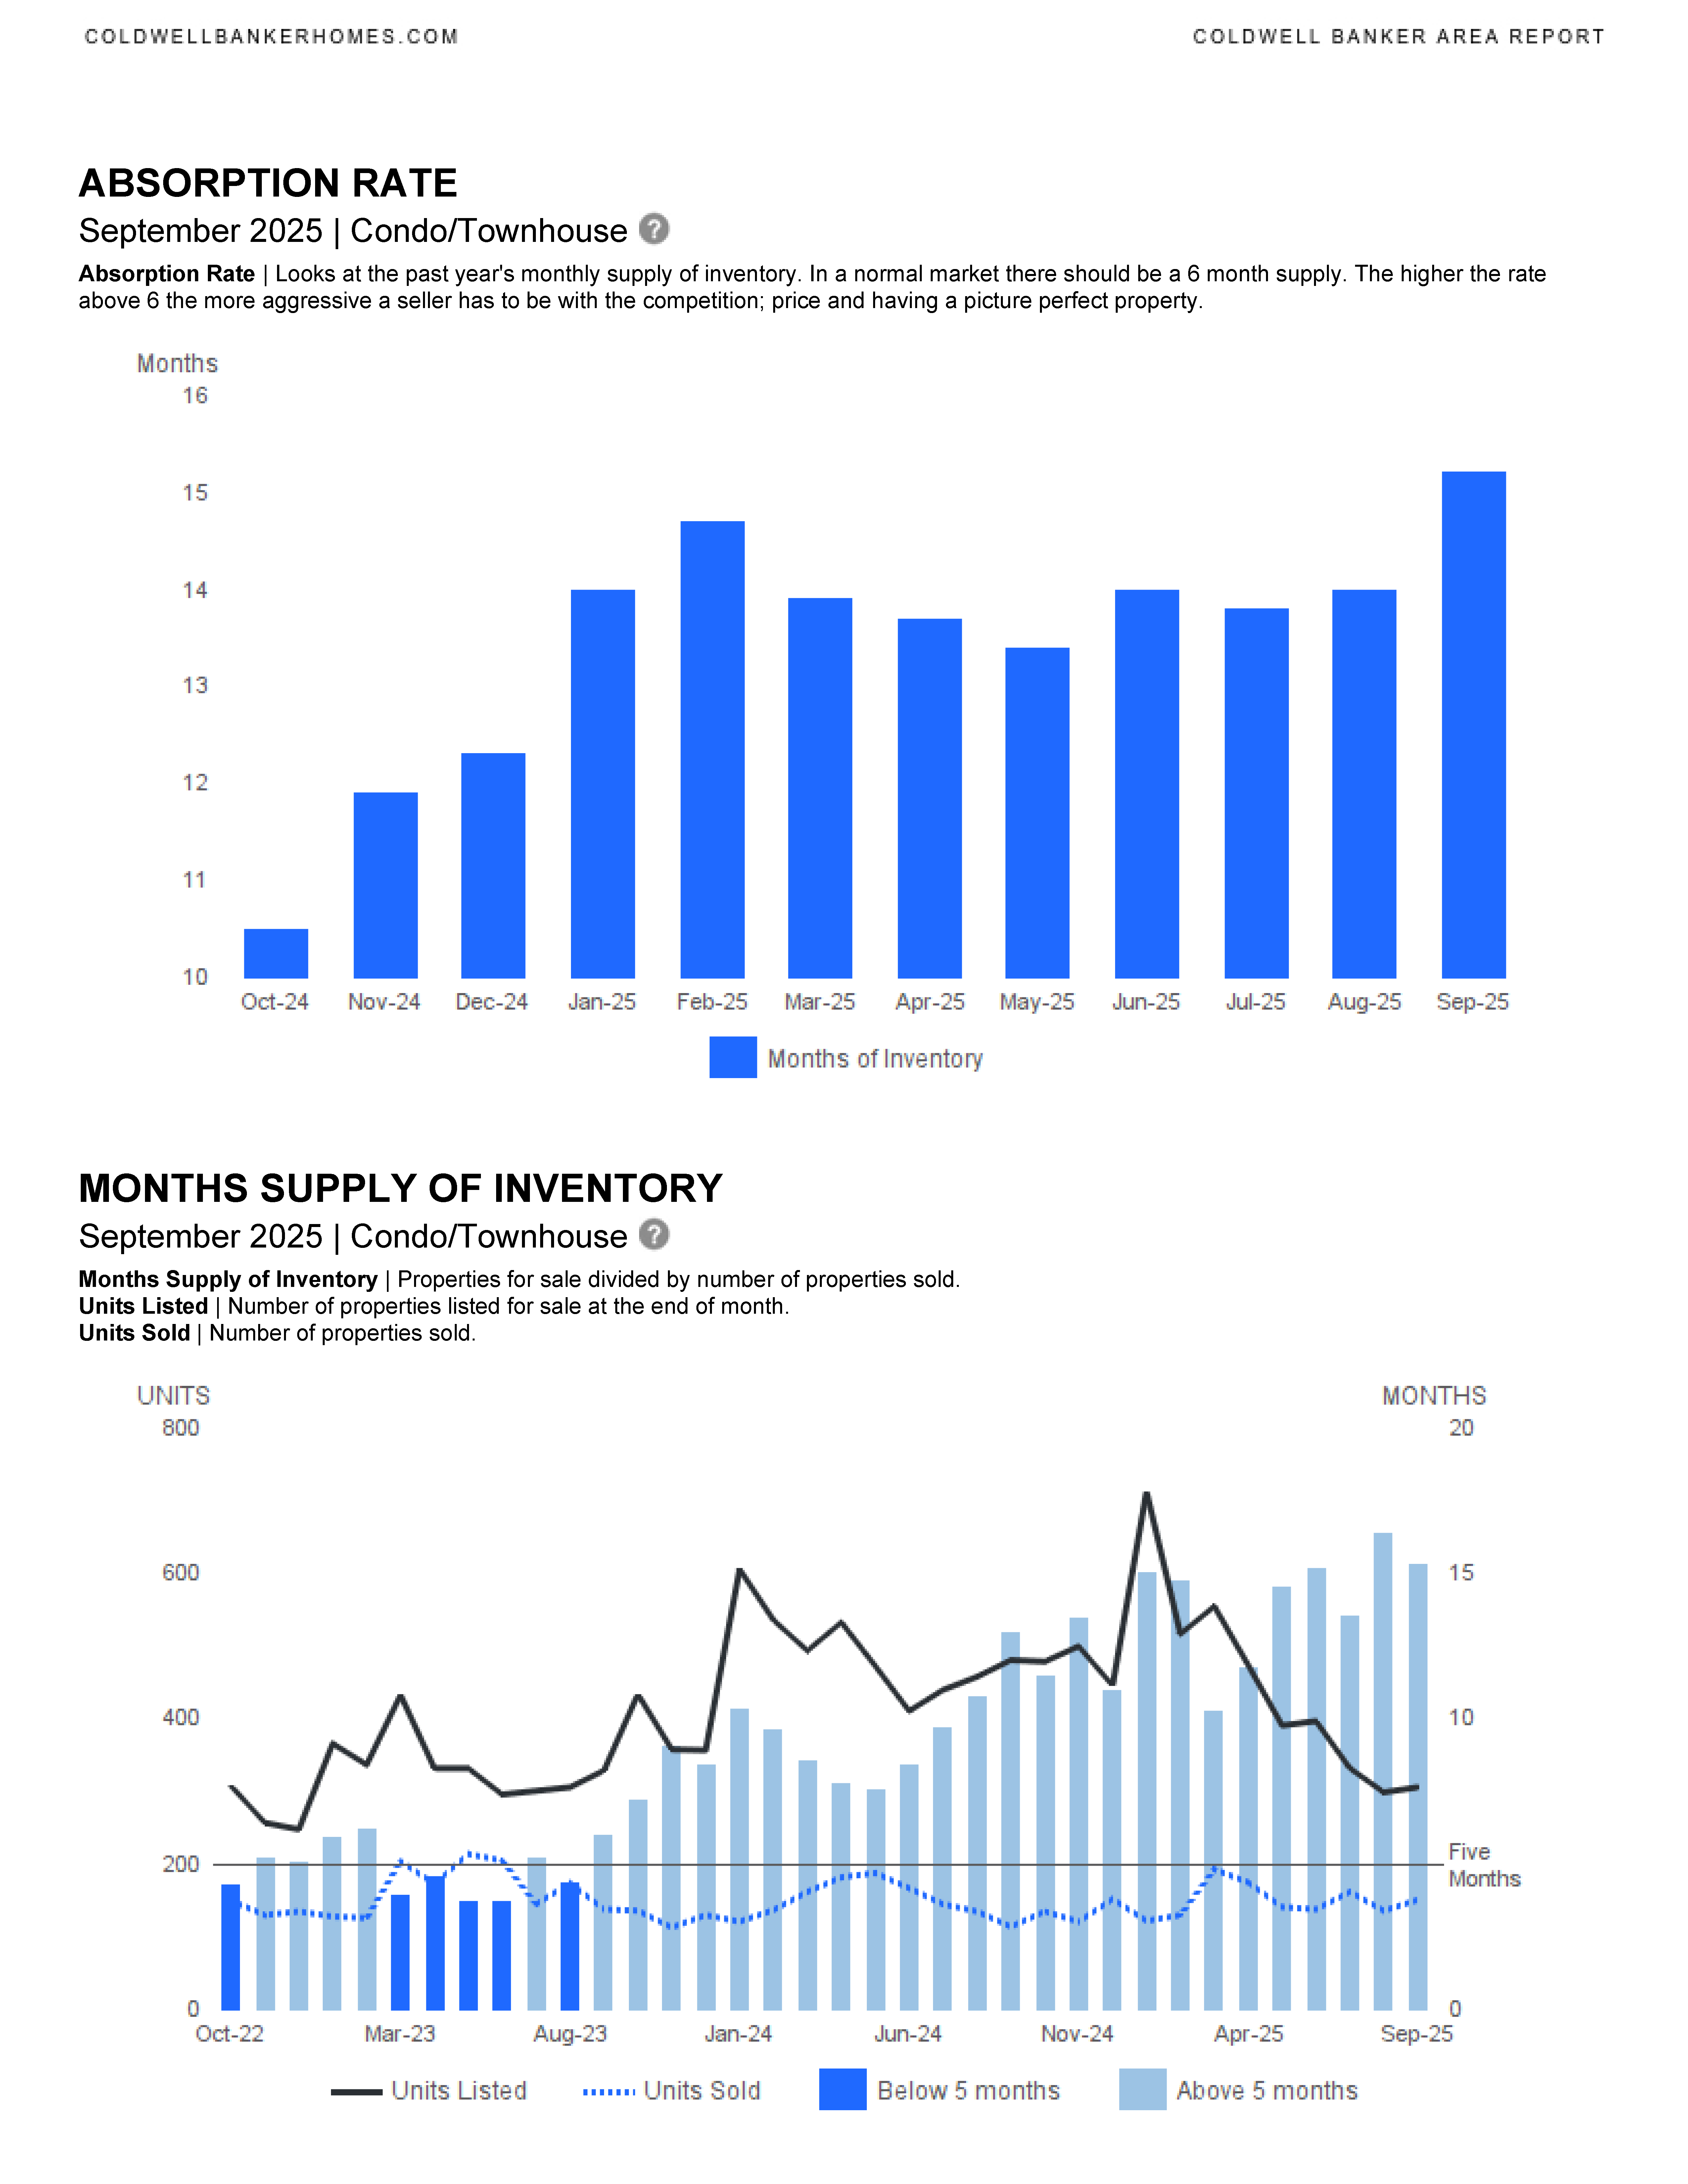
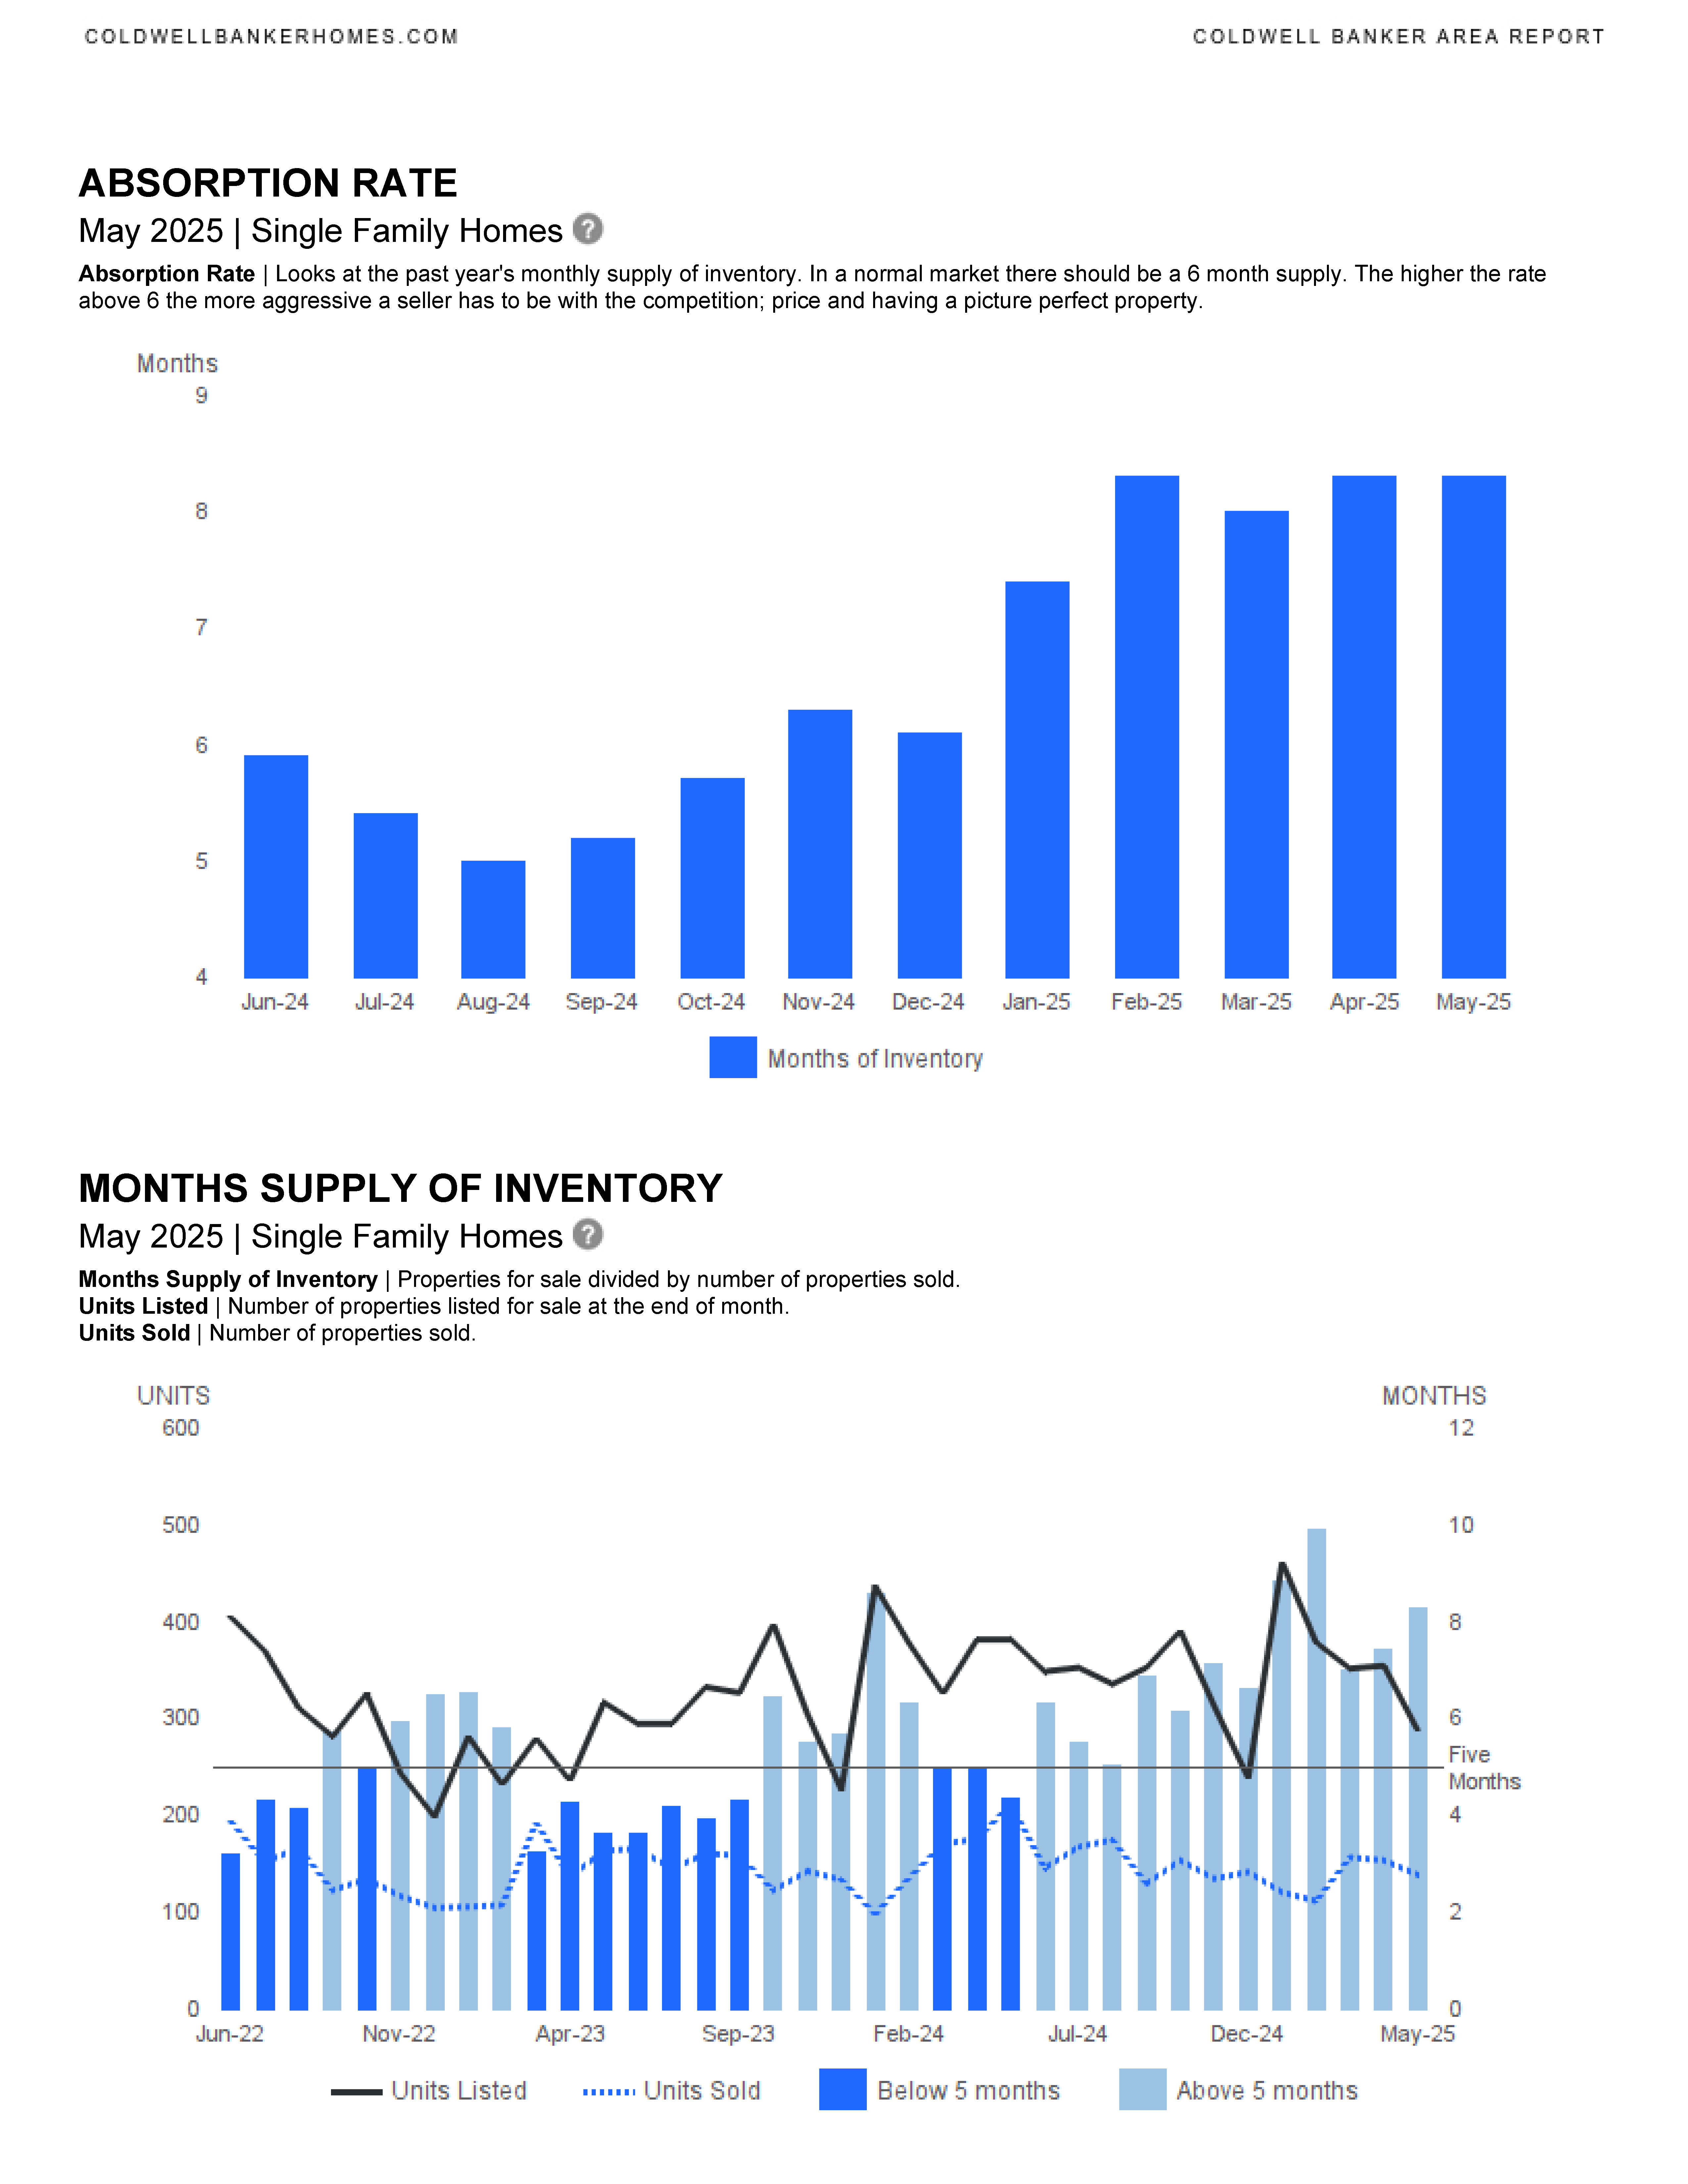
What does “Absorption Rate” mean?
Absorption Rate | Looks at the past year’s monthly supply of inventory. In a normal market there should be a 6 month supply. The higher the rate above 6 the more aggressive a seller has to be with the competition; price and having a picture perfect property.
Single Family Home Area Report listed first, Condo/Townhouses listed second:


We are entering a new real estate market in SE Florida. This is the time to work with an experienced and knowledgeable real estate professional. Please contact me if you would like to be sent updated market reports for Fort Lauderdale, or another SE Florida city. We can discuss the market, current trends and how we can work together to accomplish your real estate goals. I am here to help.
CONTACT ANNETTE
Let’s start working together!
Annette Dammeyer, REALTOR®, ABR®, AHWD®
Coldwell Banker Realty
901 E Las Olas Blvd STE 101, Fort Lauderdale, FL 33301
808.747.3686
SL 3535792
Fort Lauderdale April 2025 Area Report
Fort Lauderdale April 2025 real estate statistics have been released.
Fort Lauderdale Area Reports
Single Family Homes
Condominium & Townhouses
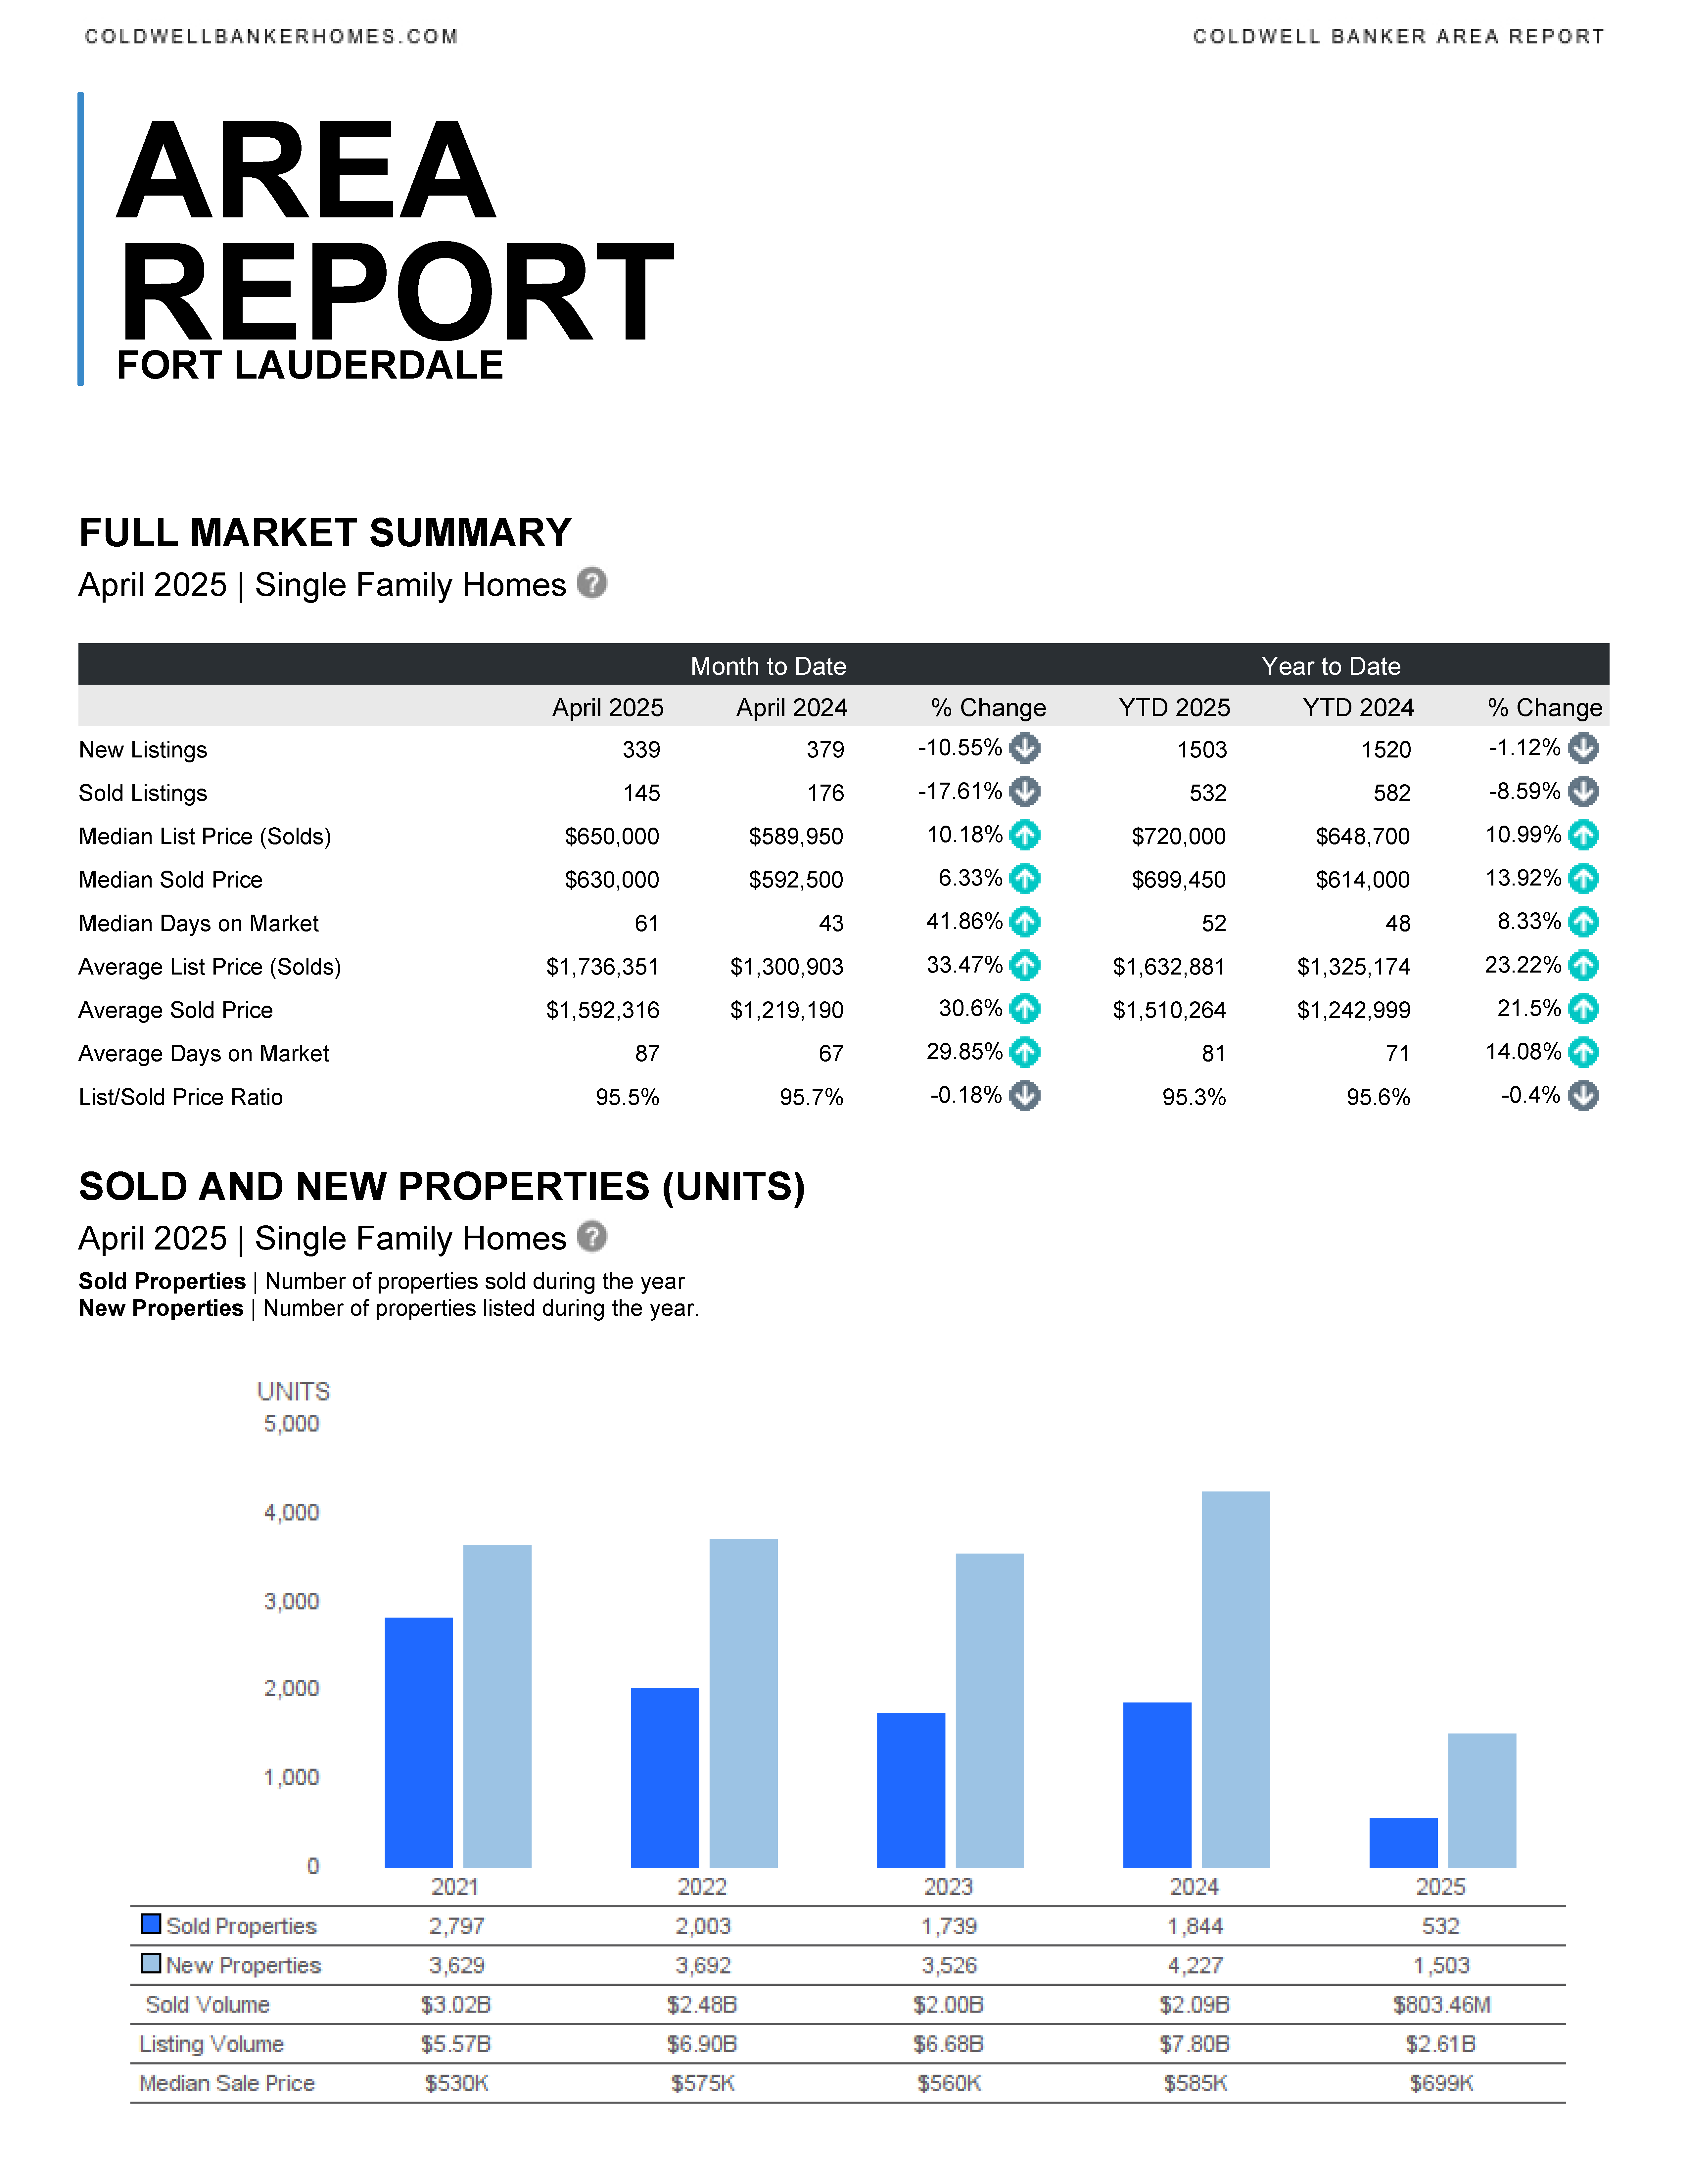
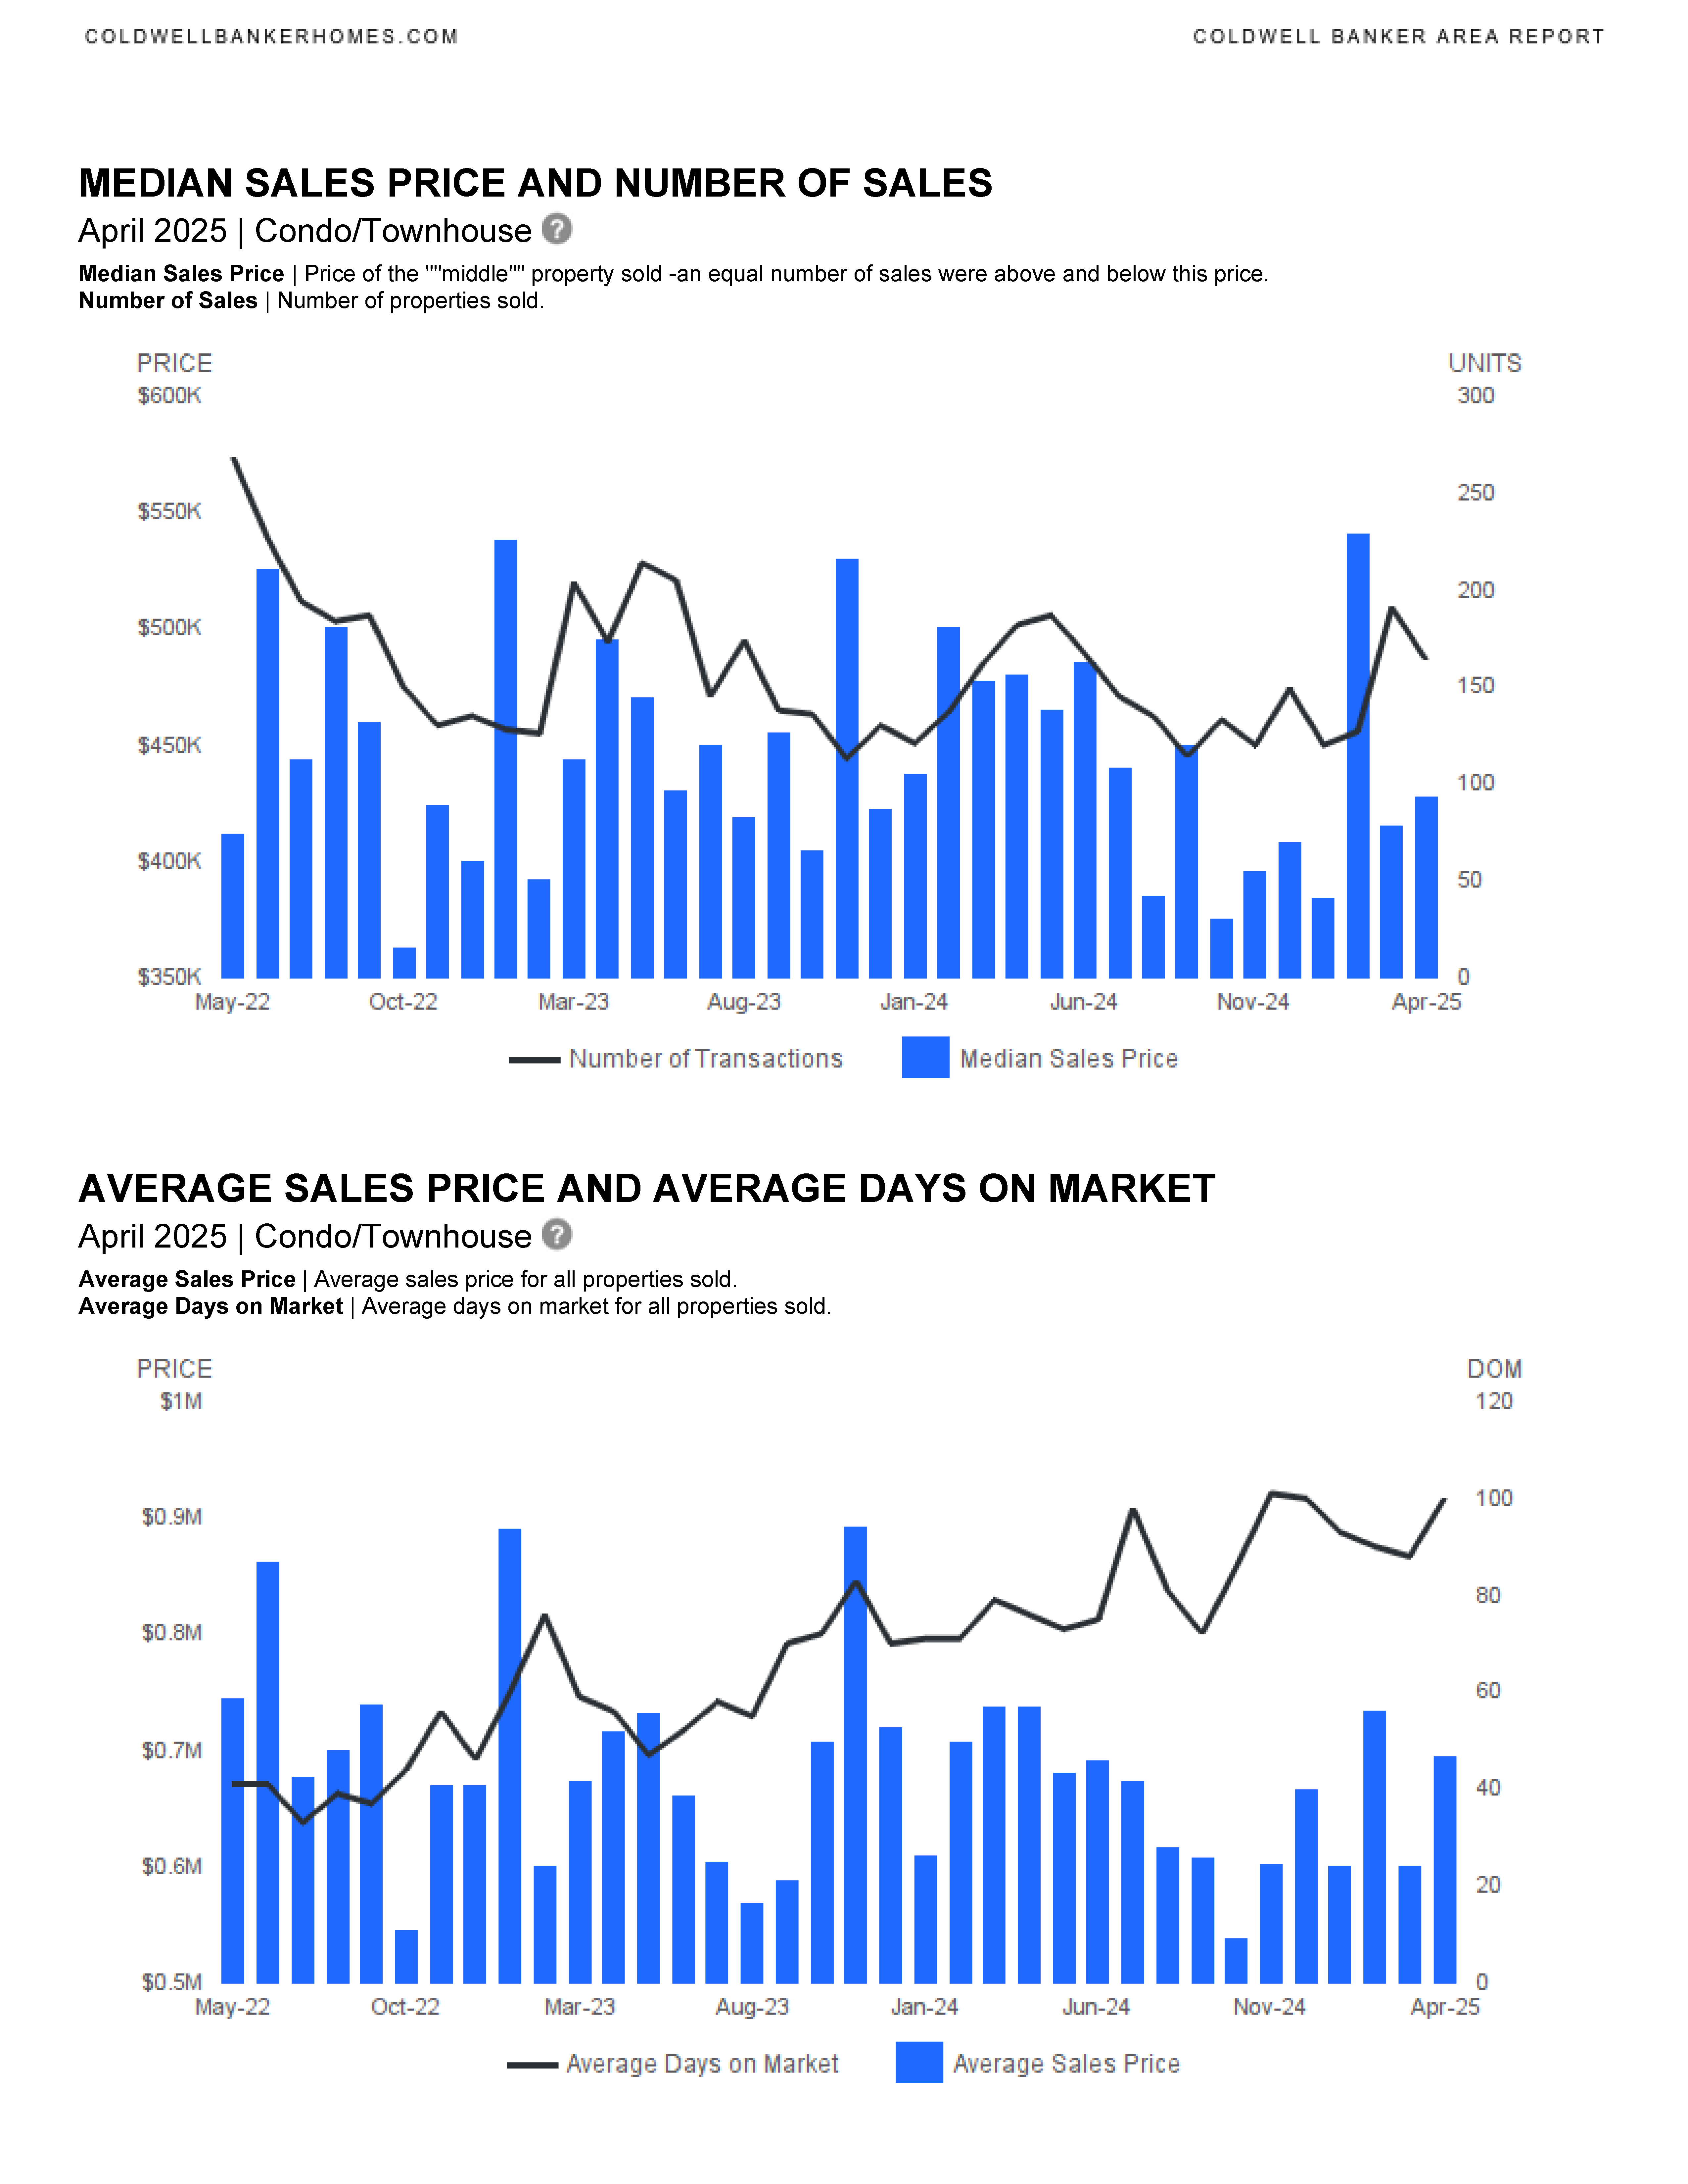
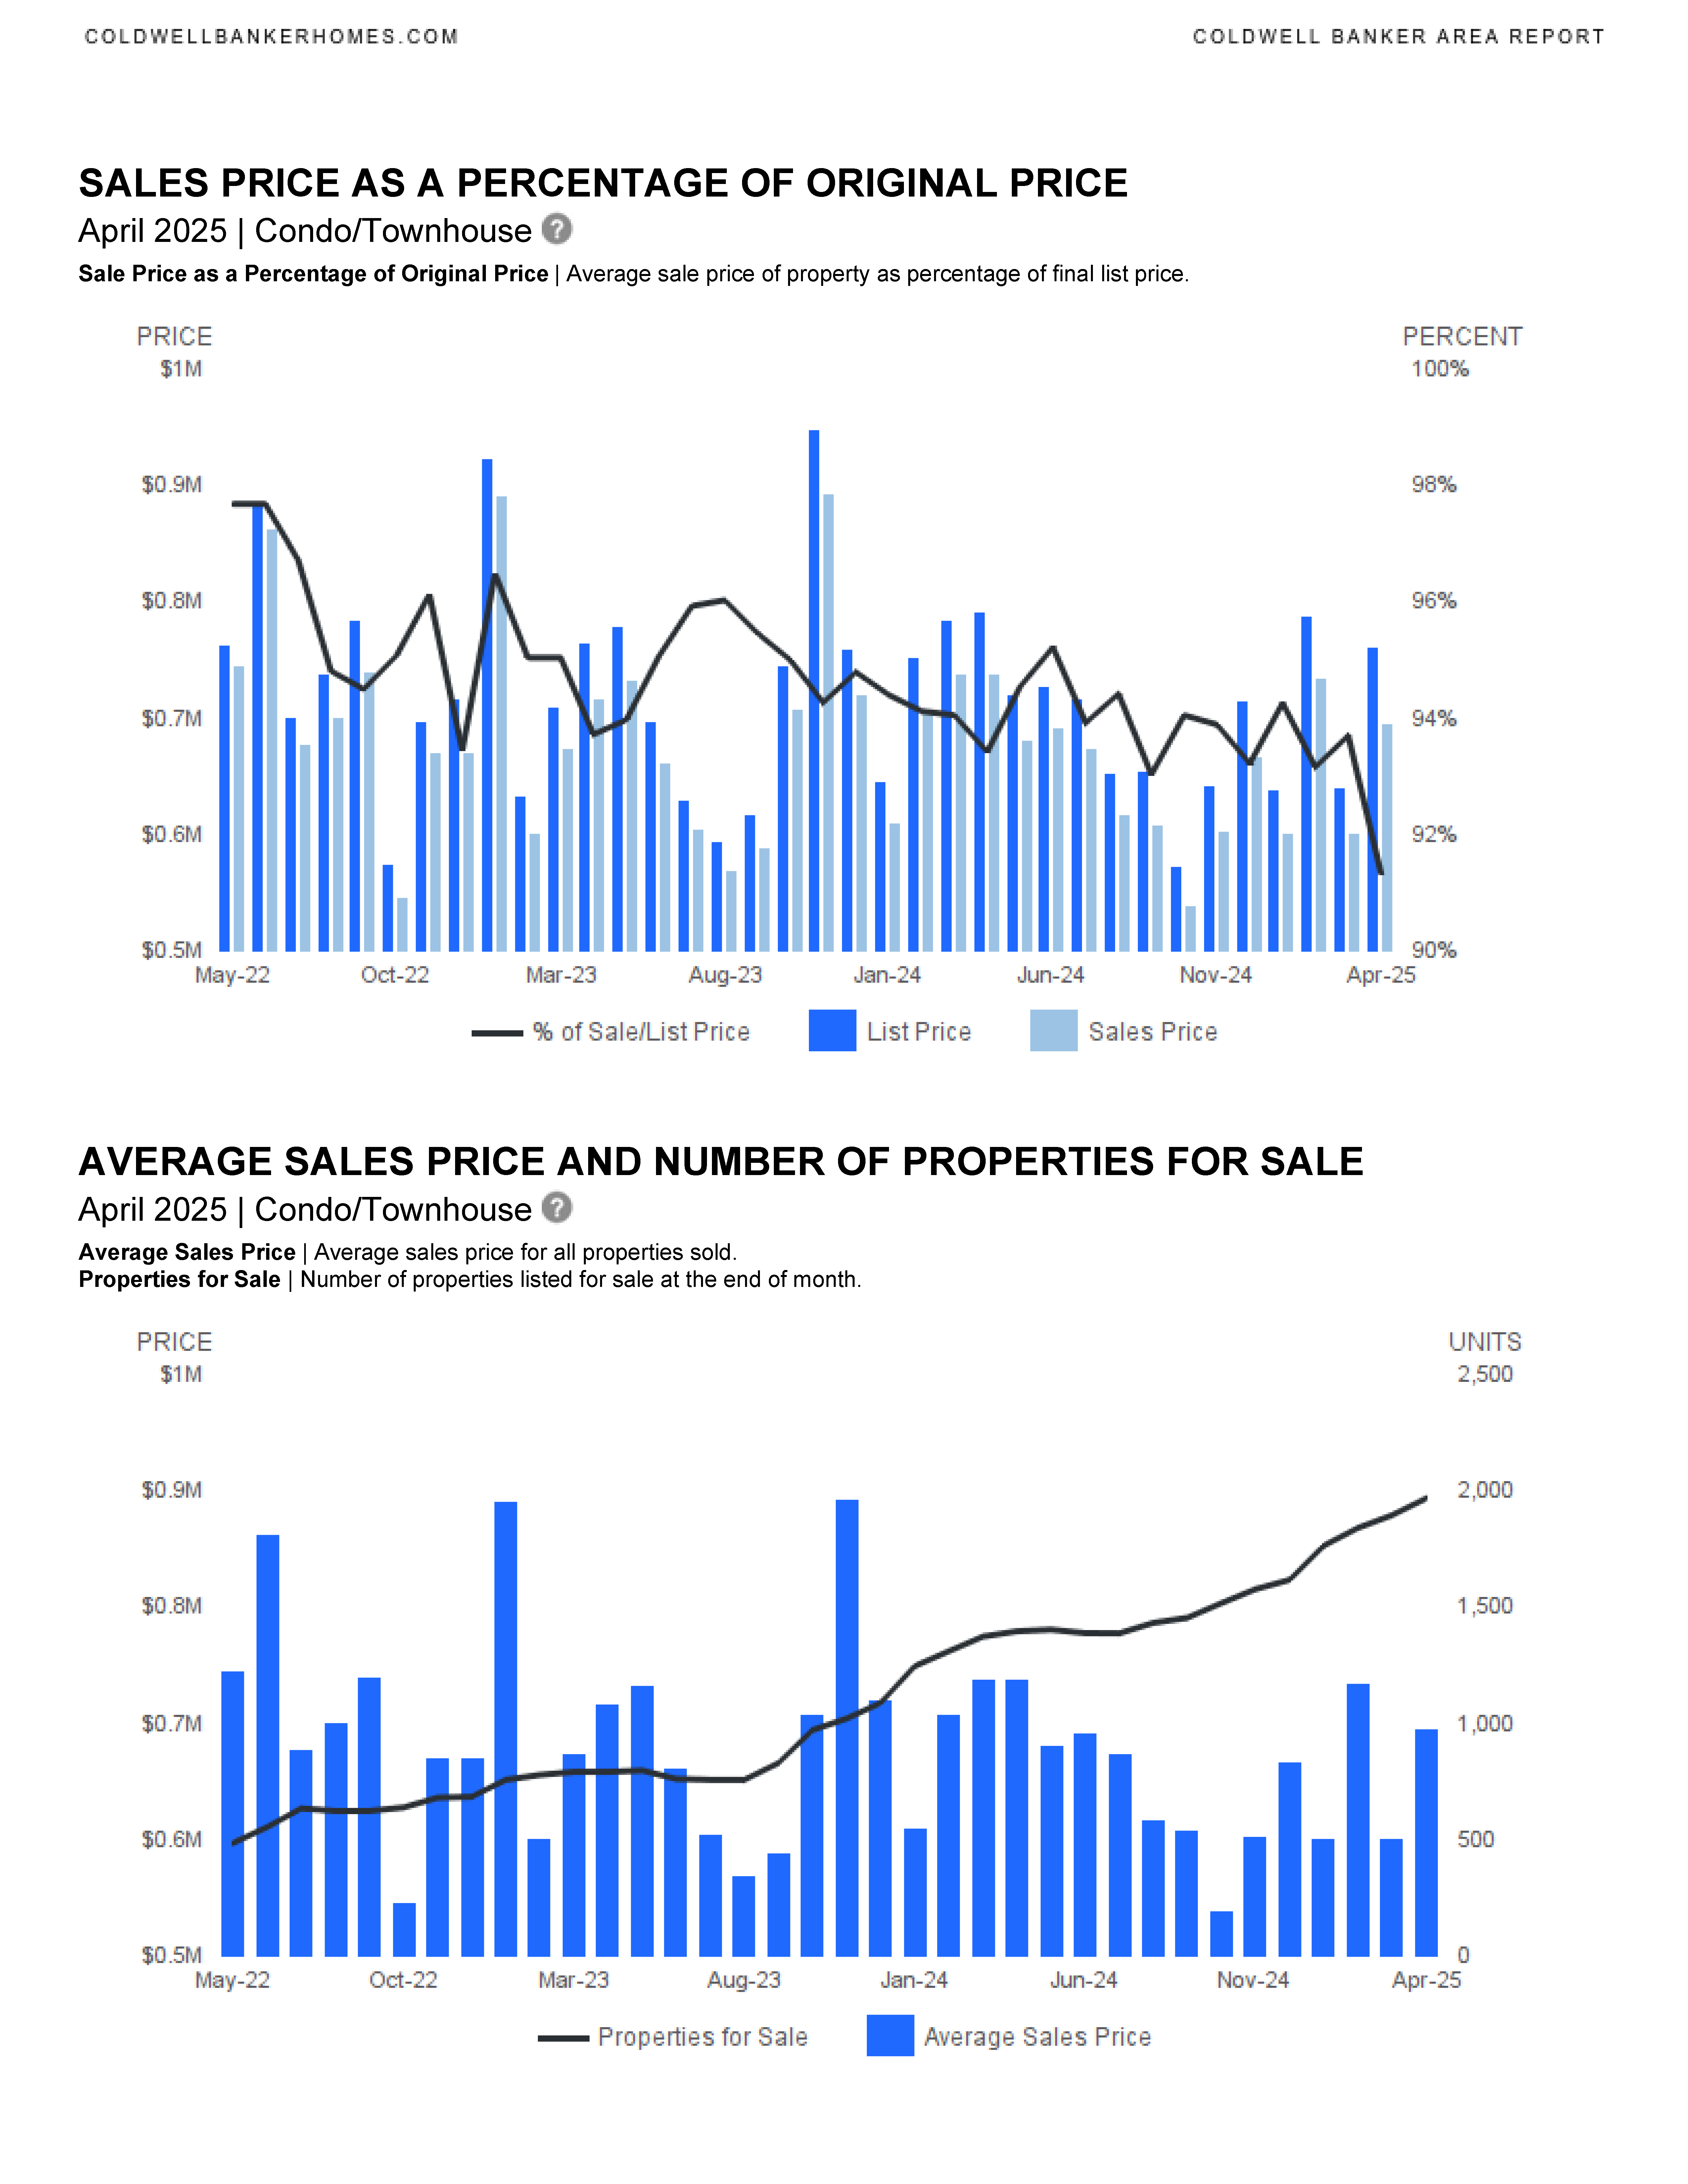
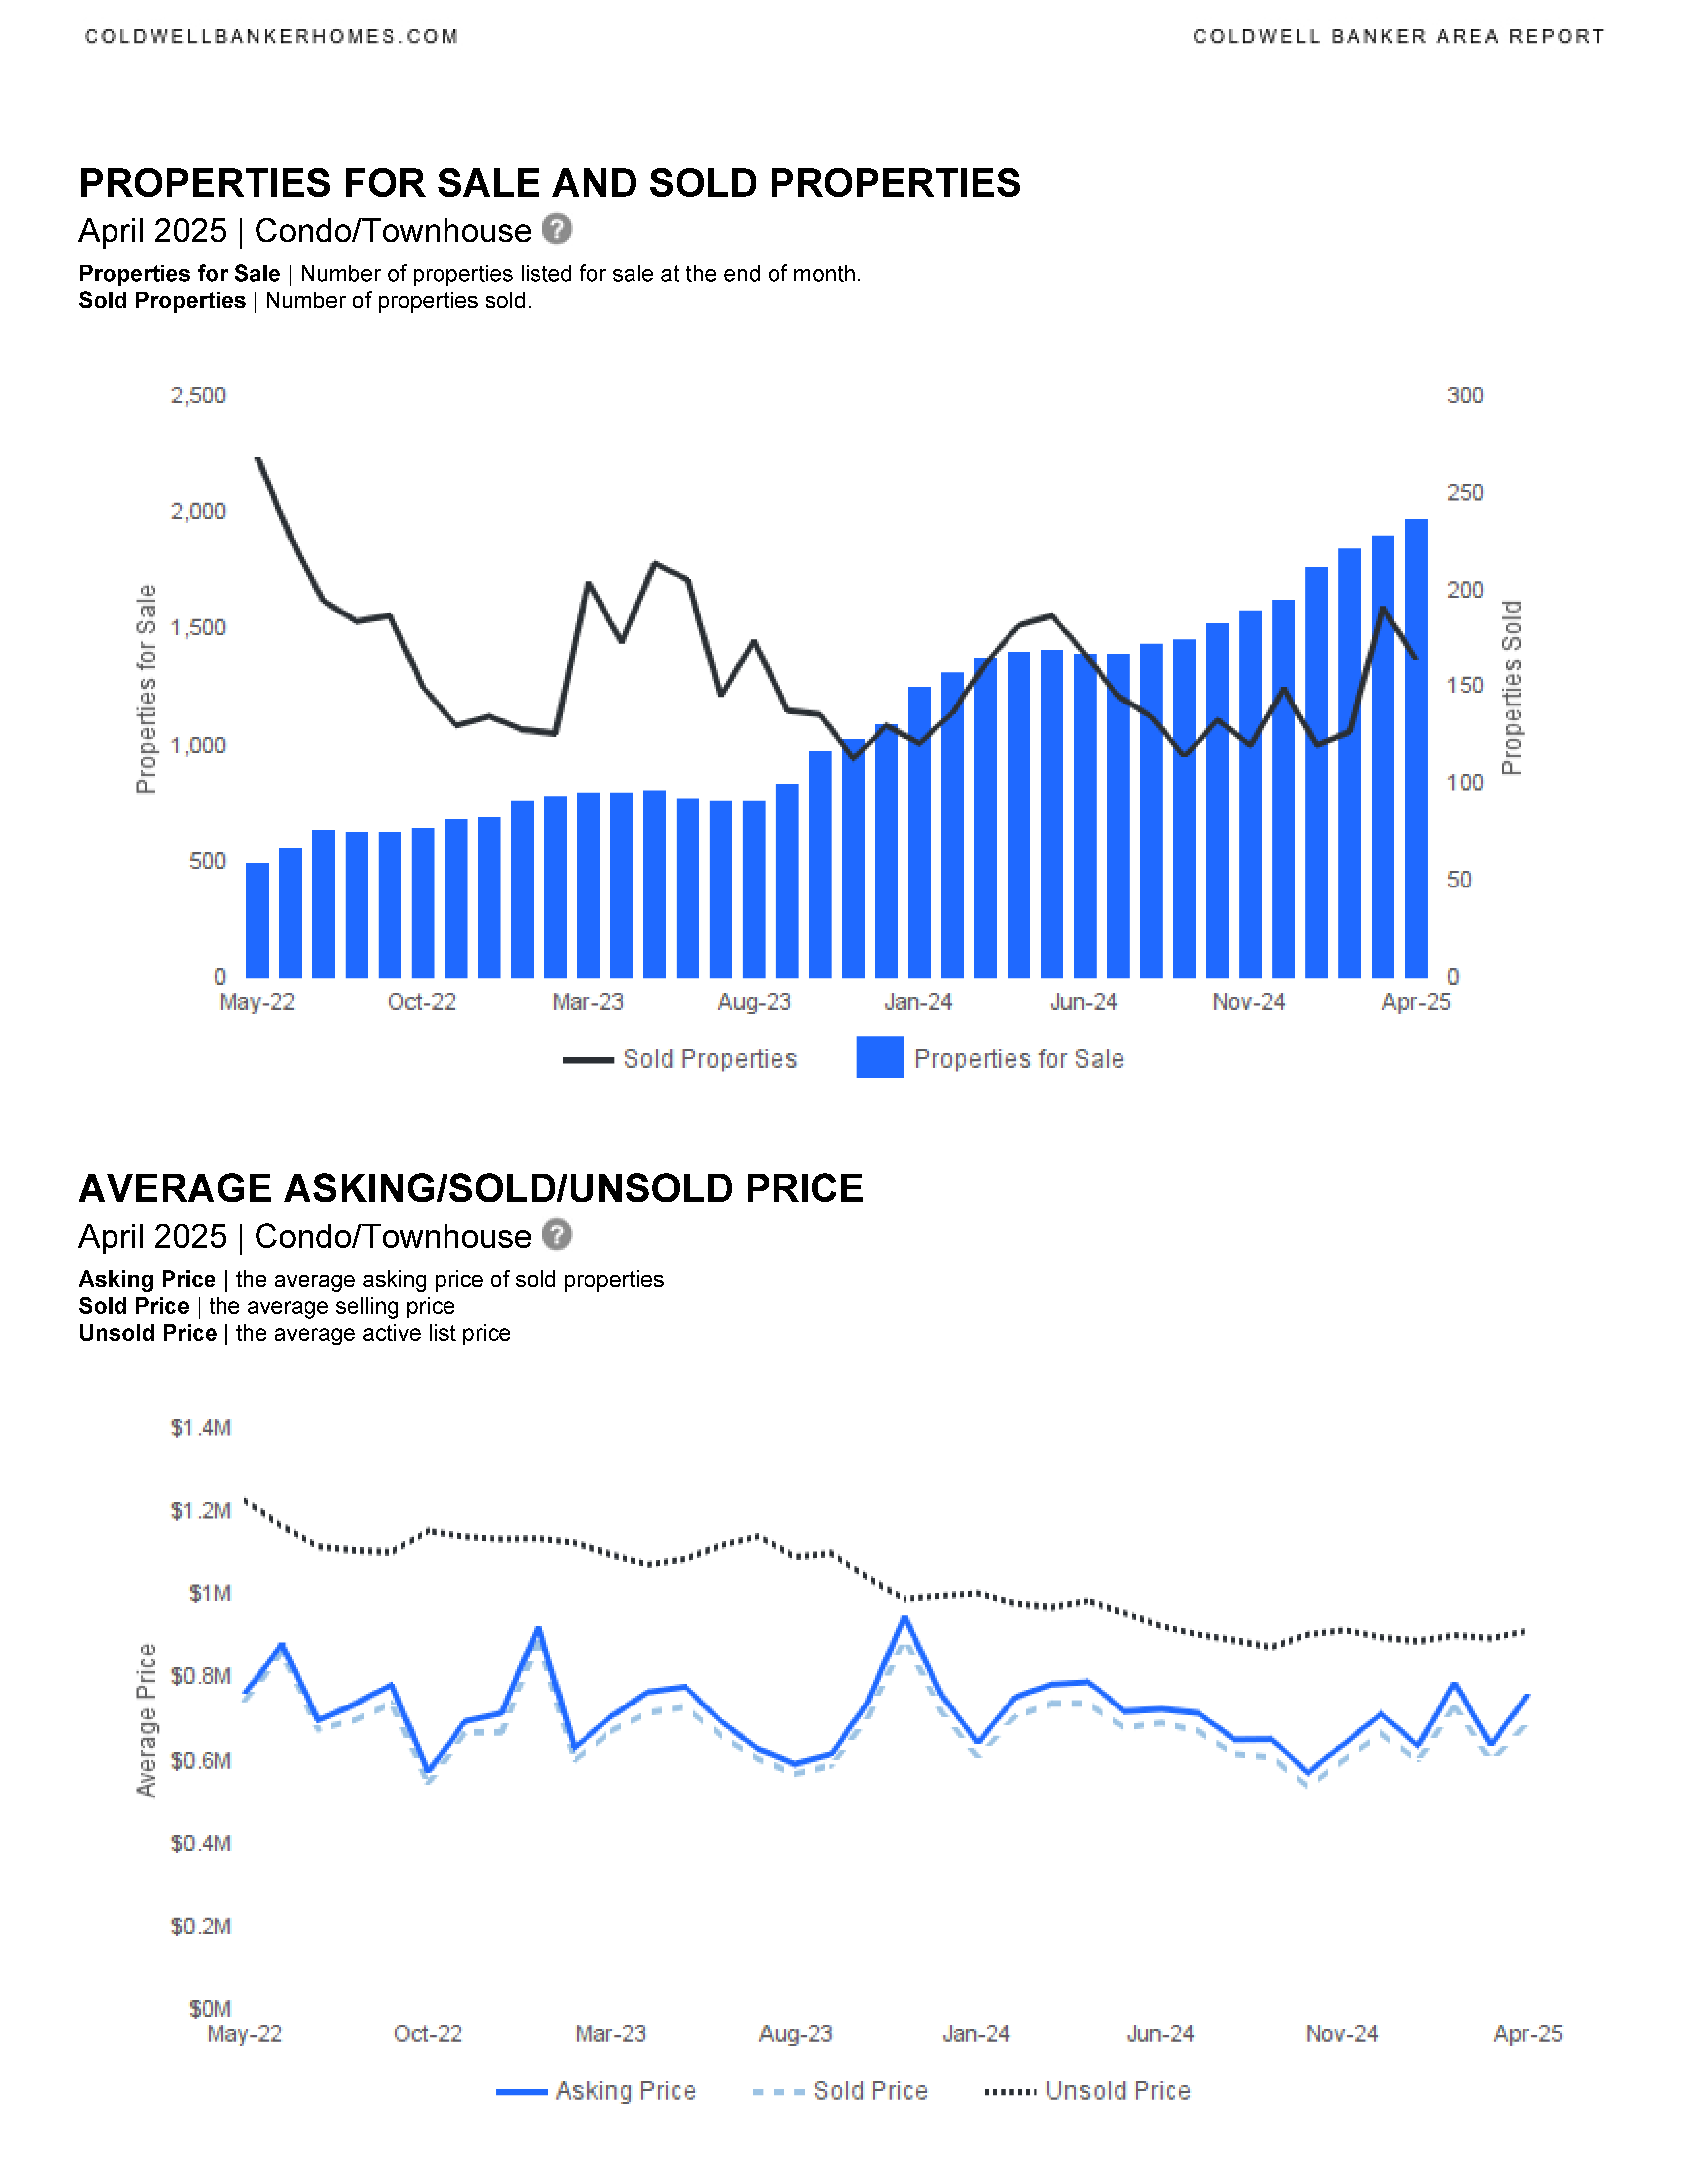
This is the April 2025 Area Report providing a detailed analysis of residential real estate market trends in Fort Lauderdale. It includes data for single-family homes and condos/townhouses, comparing April 2025 to April 2024 and year-to-date statistics.
Key Highlights
Single-Family Homes:
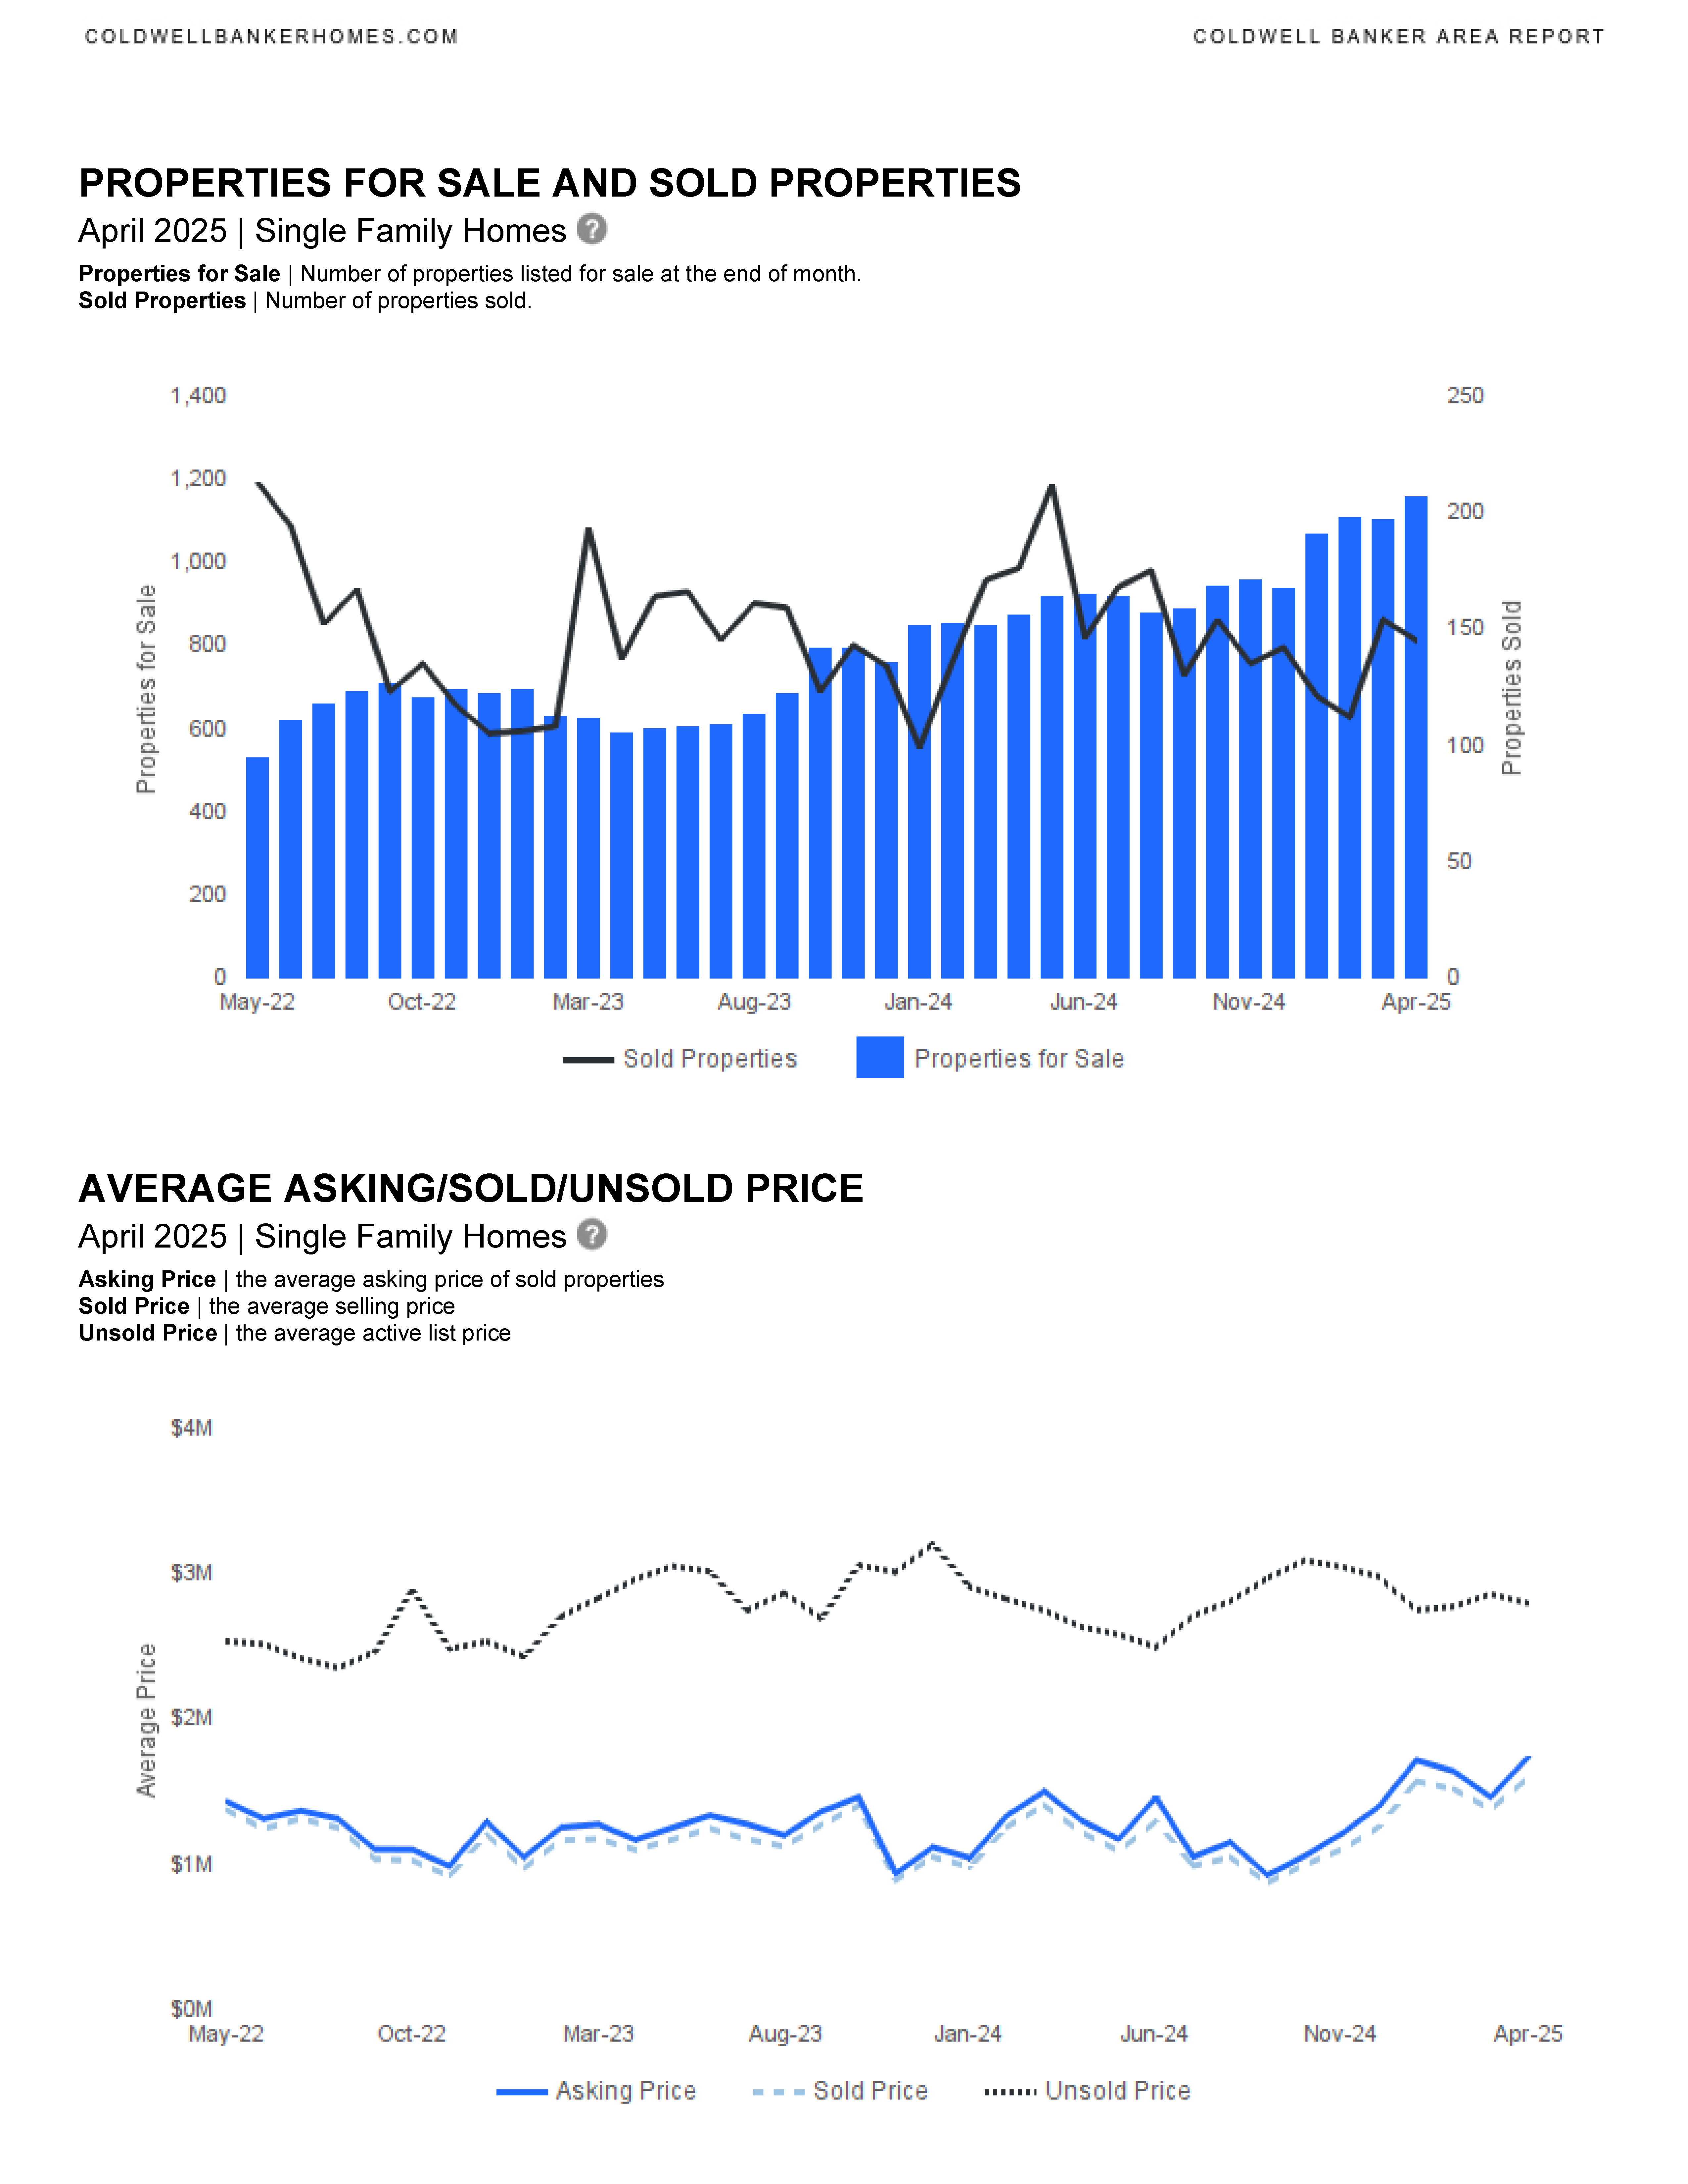
• New Listings: Down 10.55% month-to-date and 1.12% year-to-date.
• Sold Listings: Decreased by 17.61% month-to-date and 8.59% year-to-date.
• Median Sold Price: Increased by 6.33% month-to-date and 13.92% year-to-date.
• Average Sold Price: Up 30.6% month-to-date and 21.5% year-to-date.
• Median Days on Market: Increased by 41.86% month-to-date and 8.33% year-to-date.
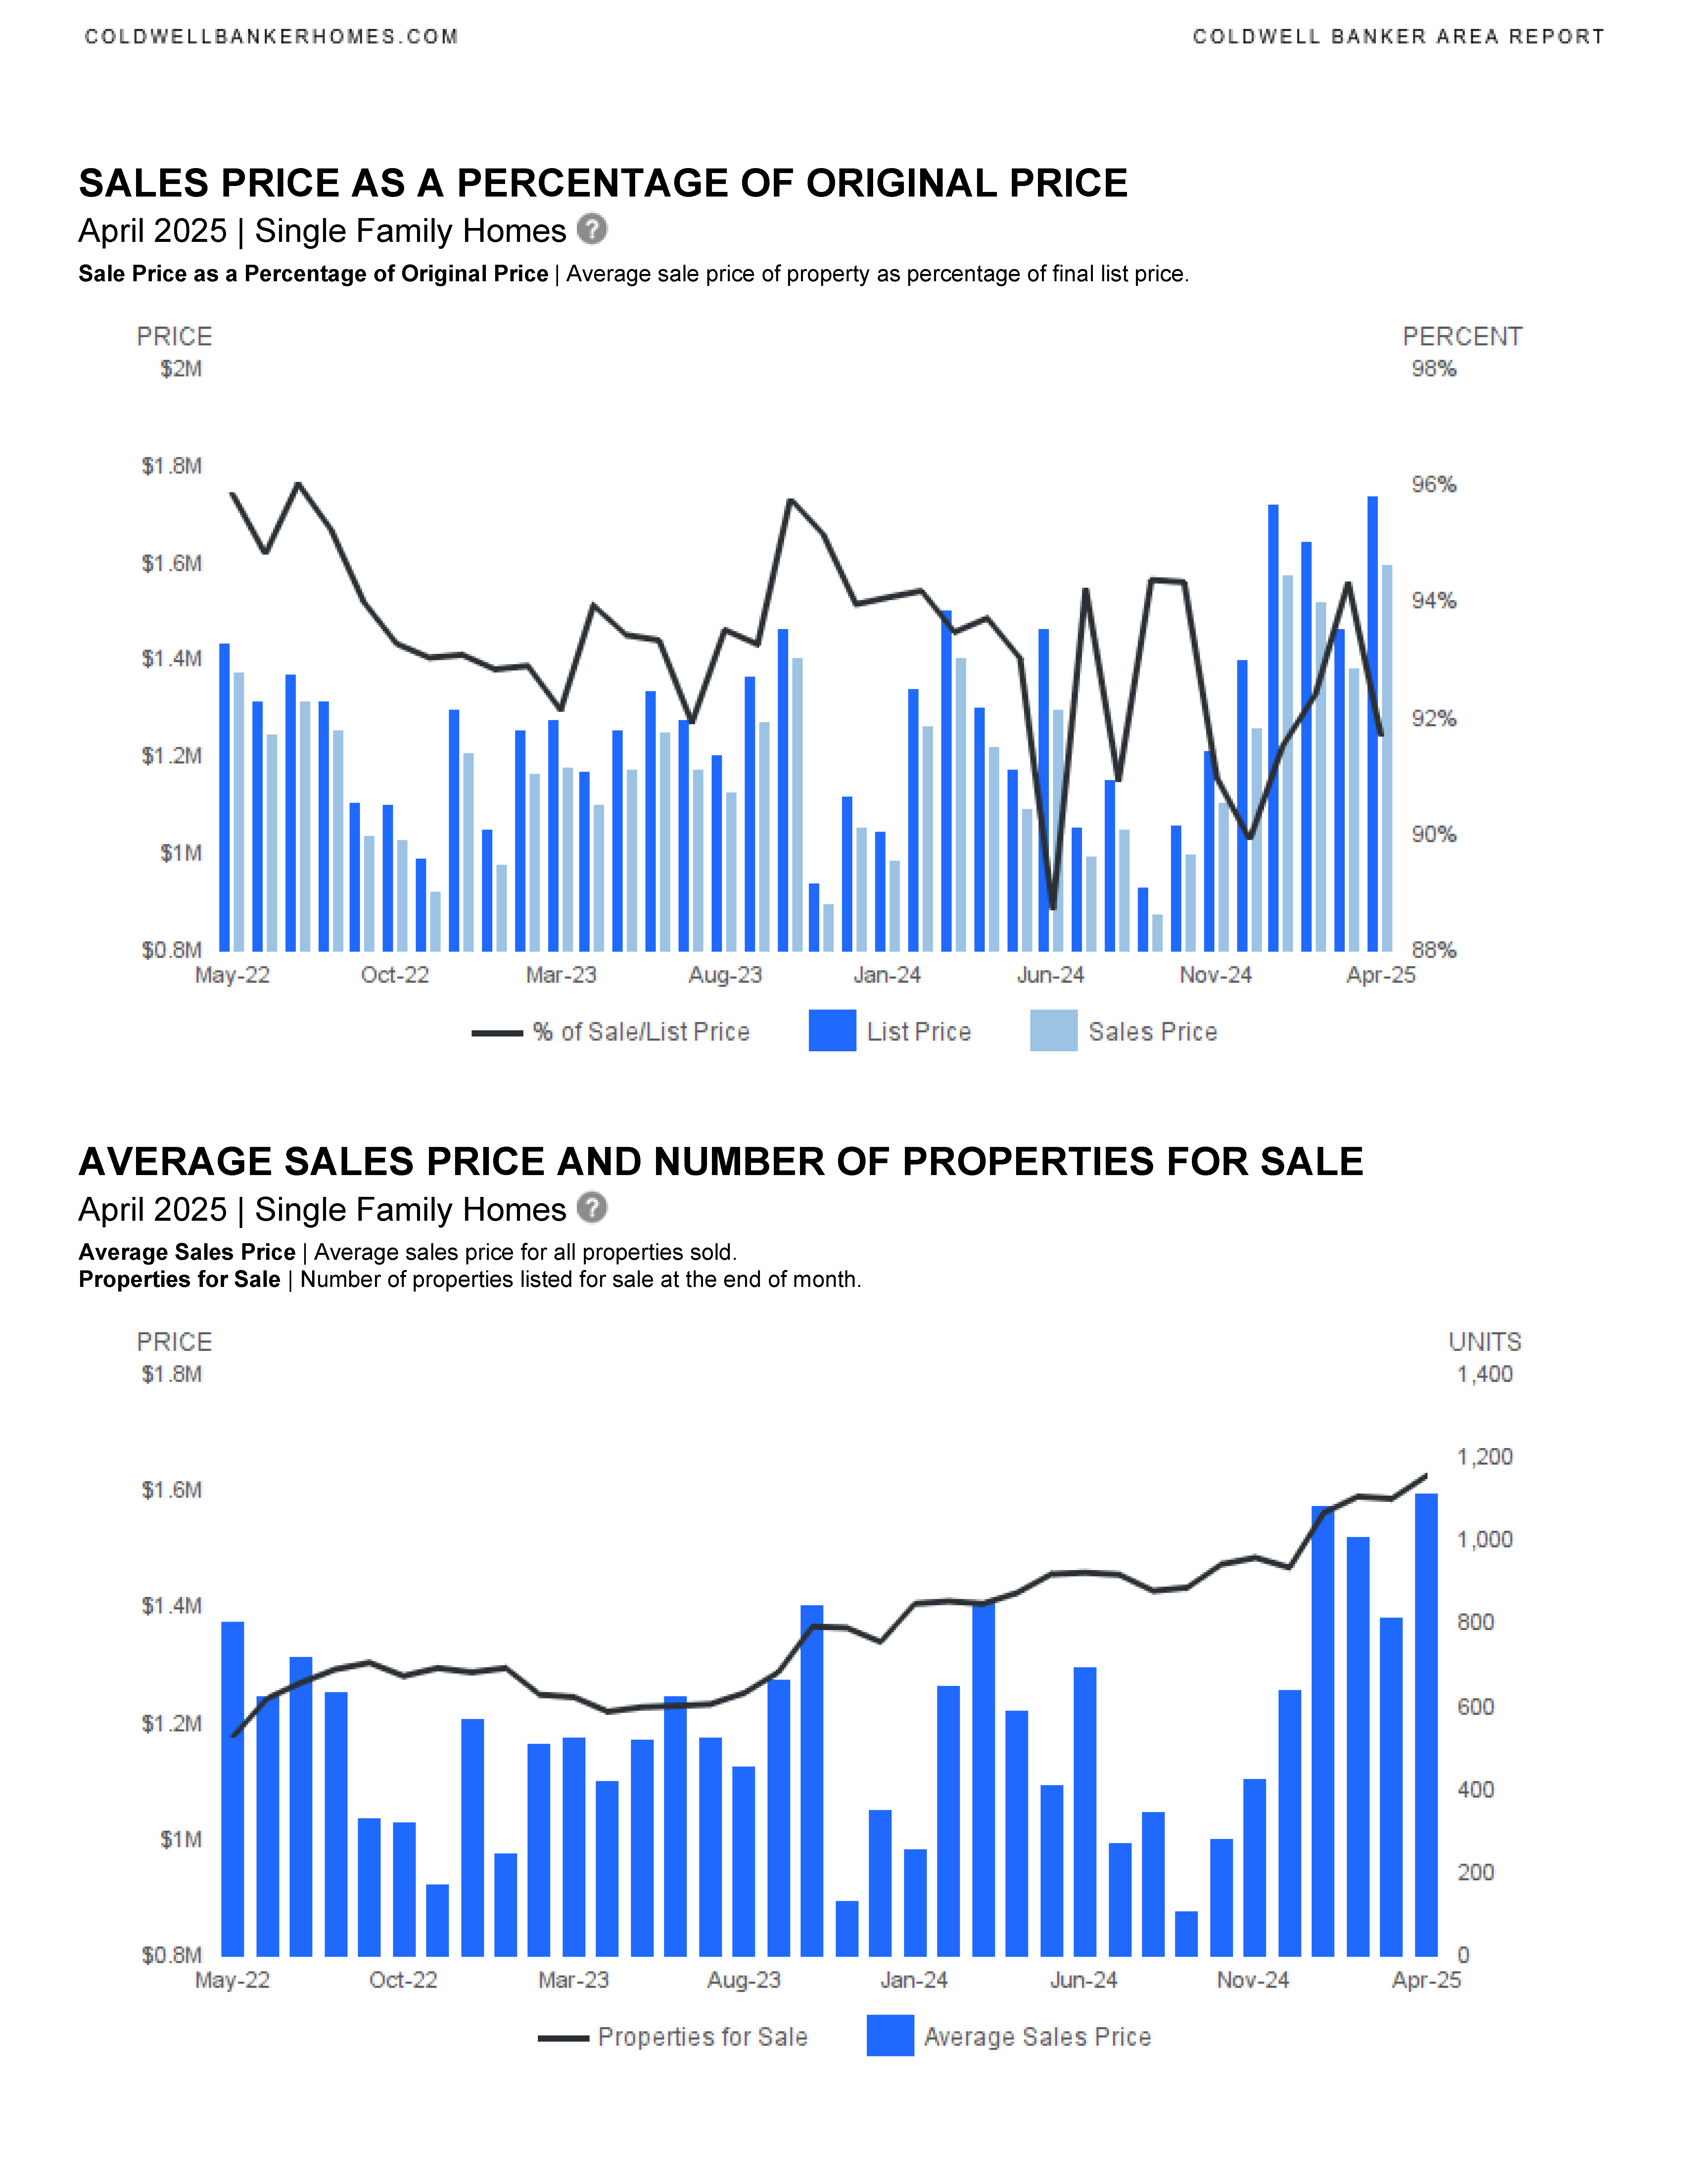
• List/Sold Price Ratio: Slight decrease (-0.18% month-to-date, -0.4% year-to-date).
Condos/Townhouses:
• New Listings: Down 24.47% month-to-date and 7.69% year-to-date.
• Sold Listings: Decreased by 9.89% month-to-date but remained flat year-to-date.
• Median Sold Price: Declined by 10.99% month-to-date and 10.34% year-to-date.
• Average Sold Price: Down 5.98% month-to-date and 7.3% year-to-date.
• Median Days on Market: Increased by 47.06% month-to-date and 35.29% year-to-date.
• List/Sold Price Ratio: Slight decrease (-1.28% month-to-date, -0.85% year-to-date).
Commonly asked questions while reviewing the reports:
What is the difference between “Median Sales Price” and “Average Sales Price”?
Median Sales Price | Price of the “”middle”” property sold -an equal number of sales were above and below this price.
Average Sales Price | Average sales price for all properties sold.
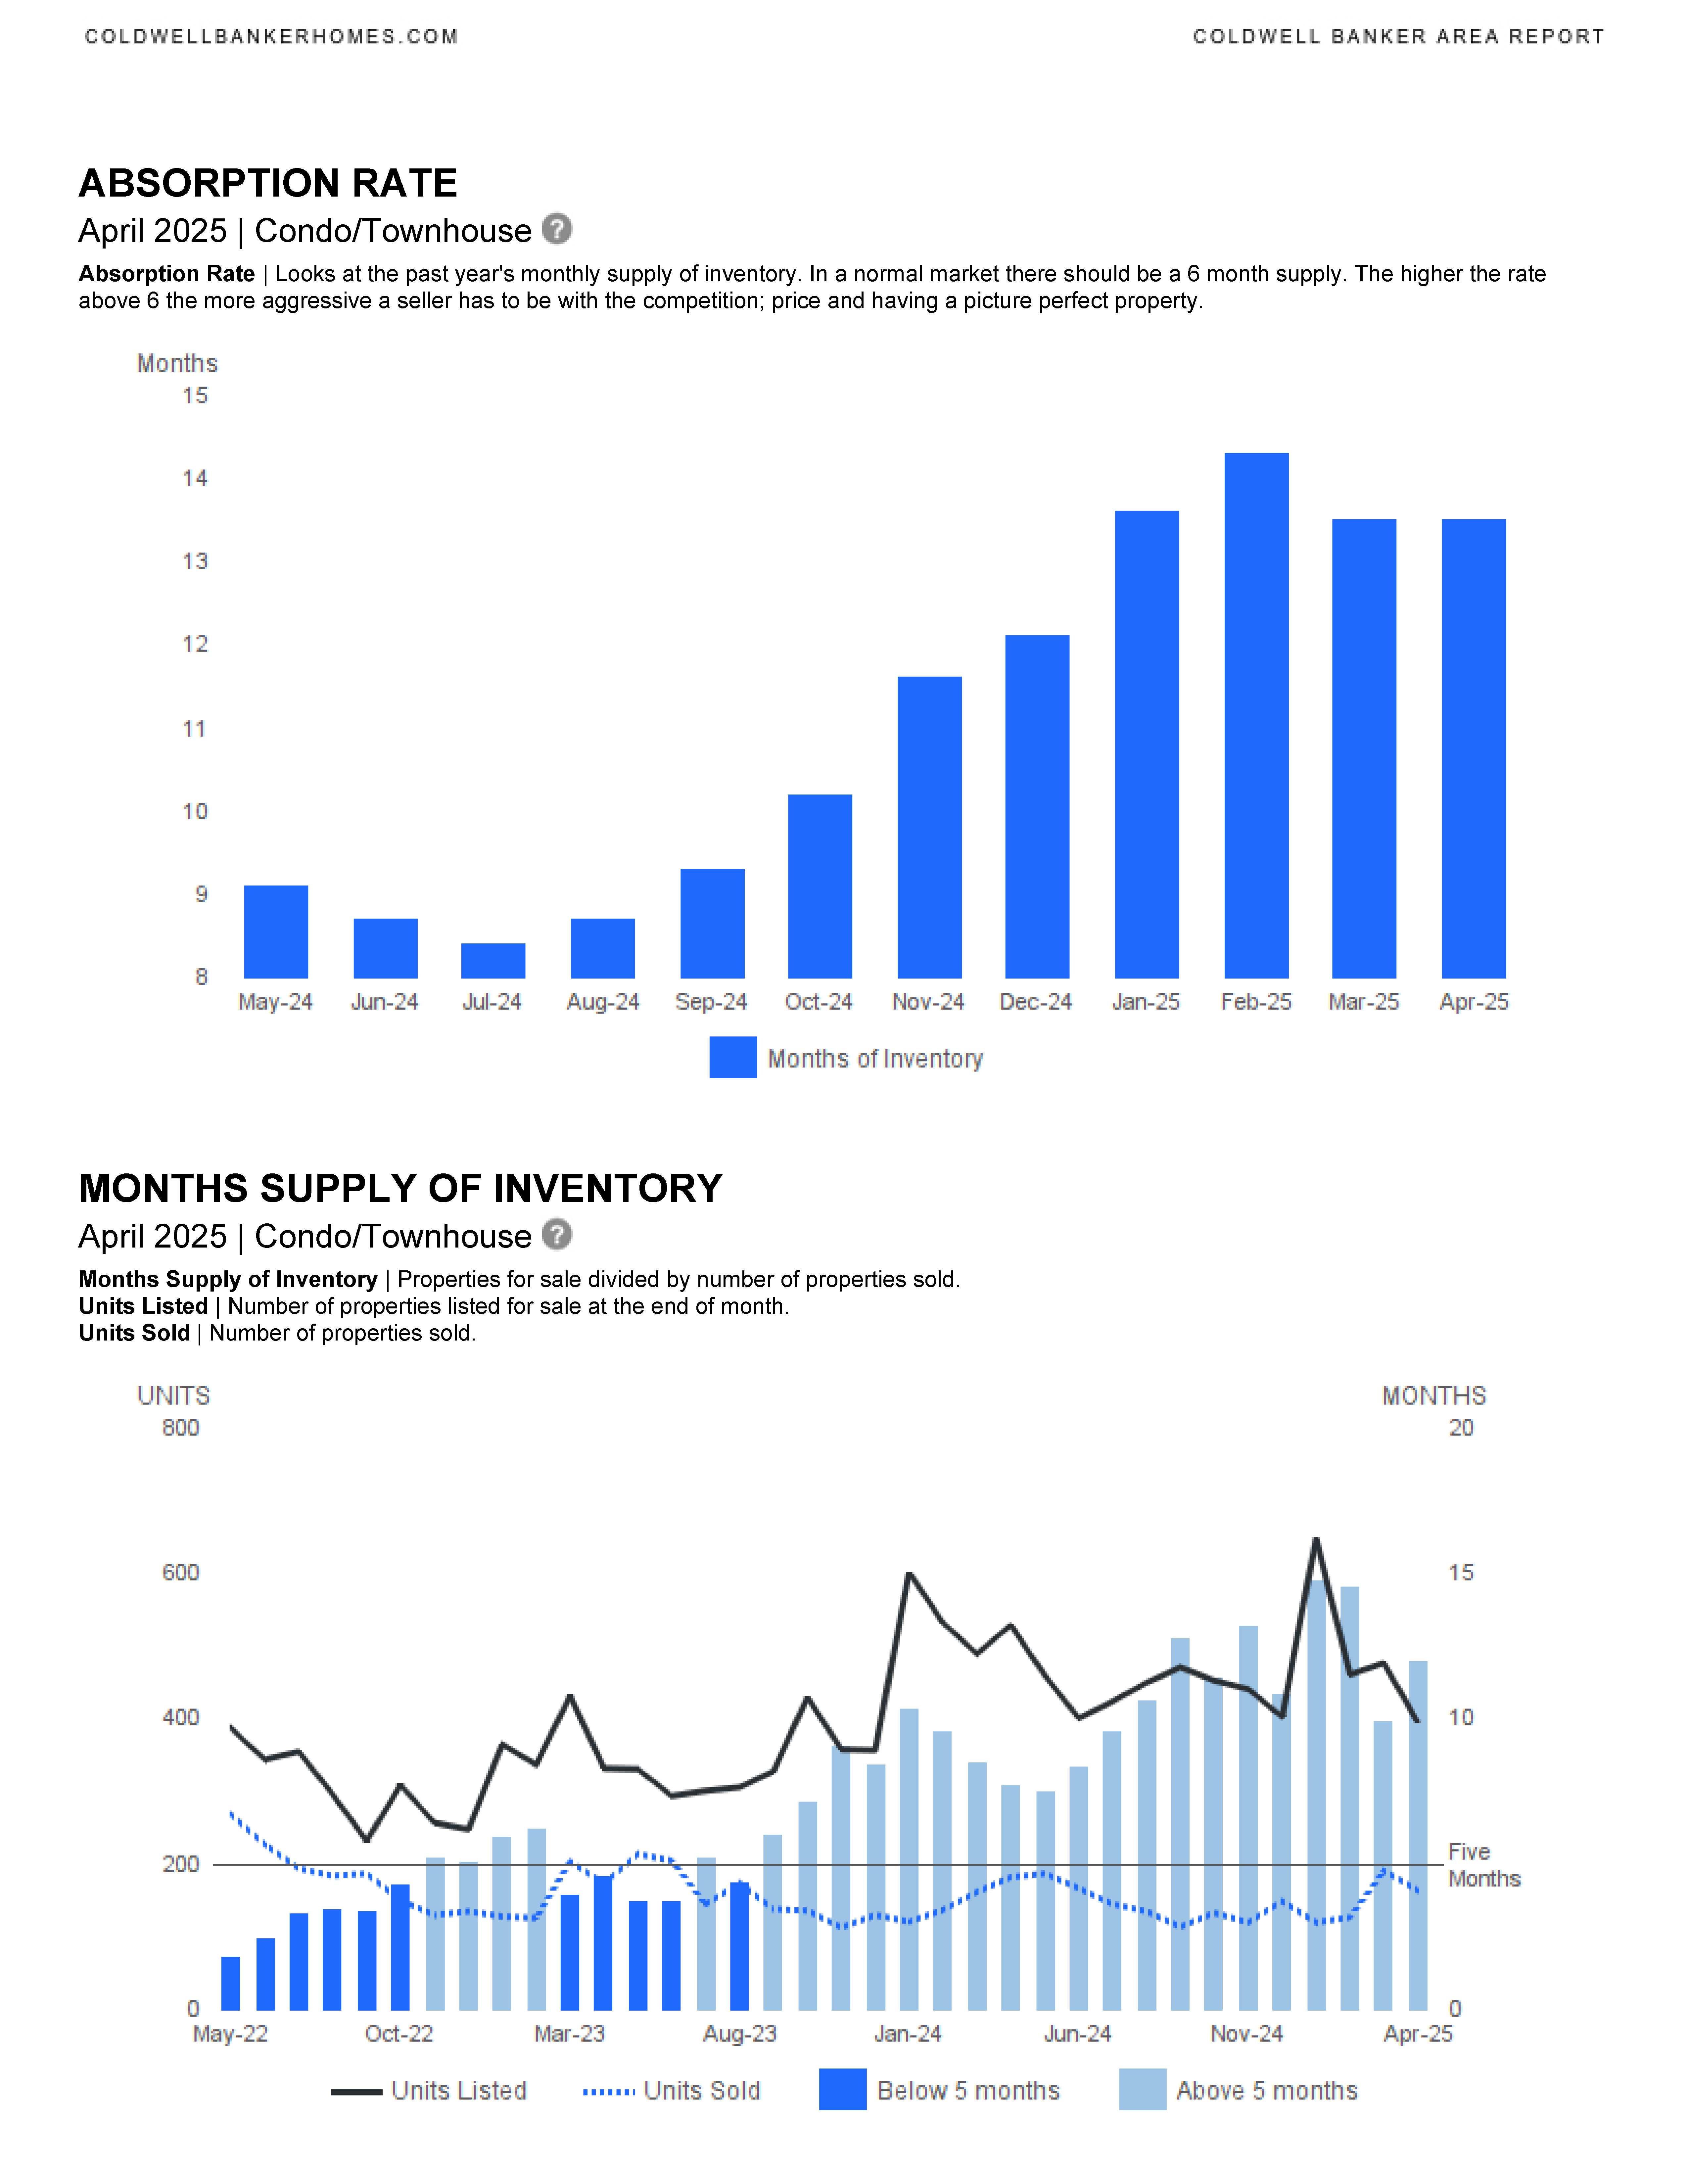
What does “Absorption Rate” mean?
Absorption Rate | Looks at the past year’s monthly supply of inventory. In a normal market there should be a 6 month supply. The higher the rate above 6 the more aggressive a seller has to be with the competition; price and having a picture perfect property.
Single Family Home Area Report listed first, Condo/Townhouses listed second:


We are entering a new real estate market in SE Florida. This is the time to work with an experienced and knowledgeable real estate professional. Please contact me if you would like to be sent updated market reports for Fort Lauderdale, or another SE Florida city. We can discuss the market, current trends and how we can work together to accomplish your real estate goals. I am here to help.
CONTACT ANNETTE
Let’s start working together!
Annette Dammeyer, REALTOR®, ABR®, AHWD®
Coldwell Banker Realty
901 E Las Olas Blvd STE 101, Fort Lauderdale, FL 33301
808.747.3686
SL 3535792
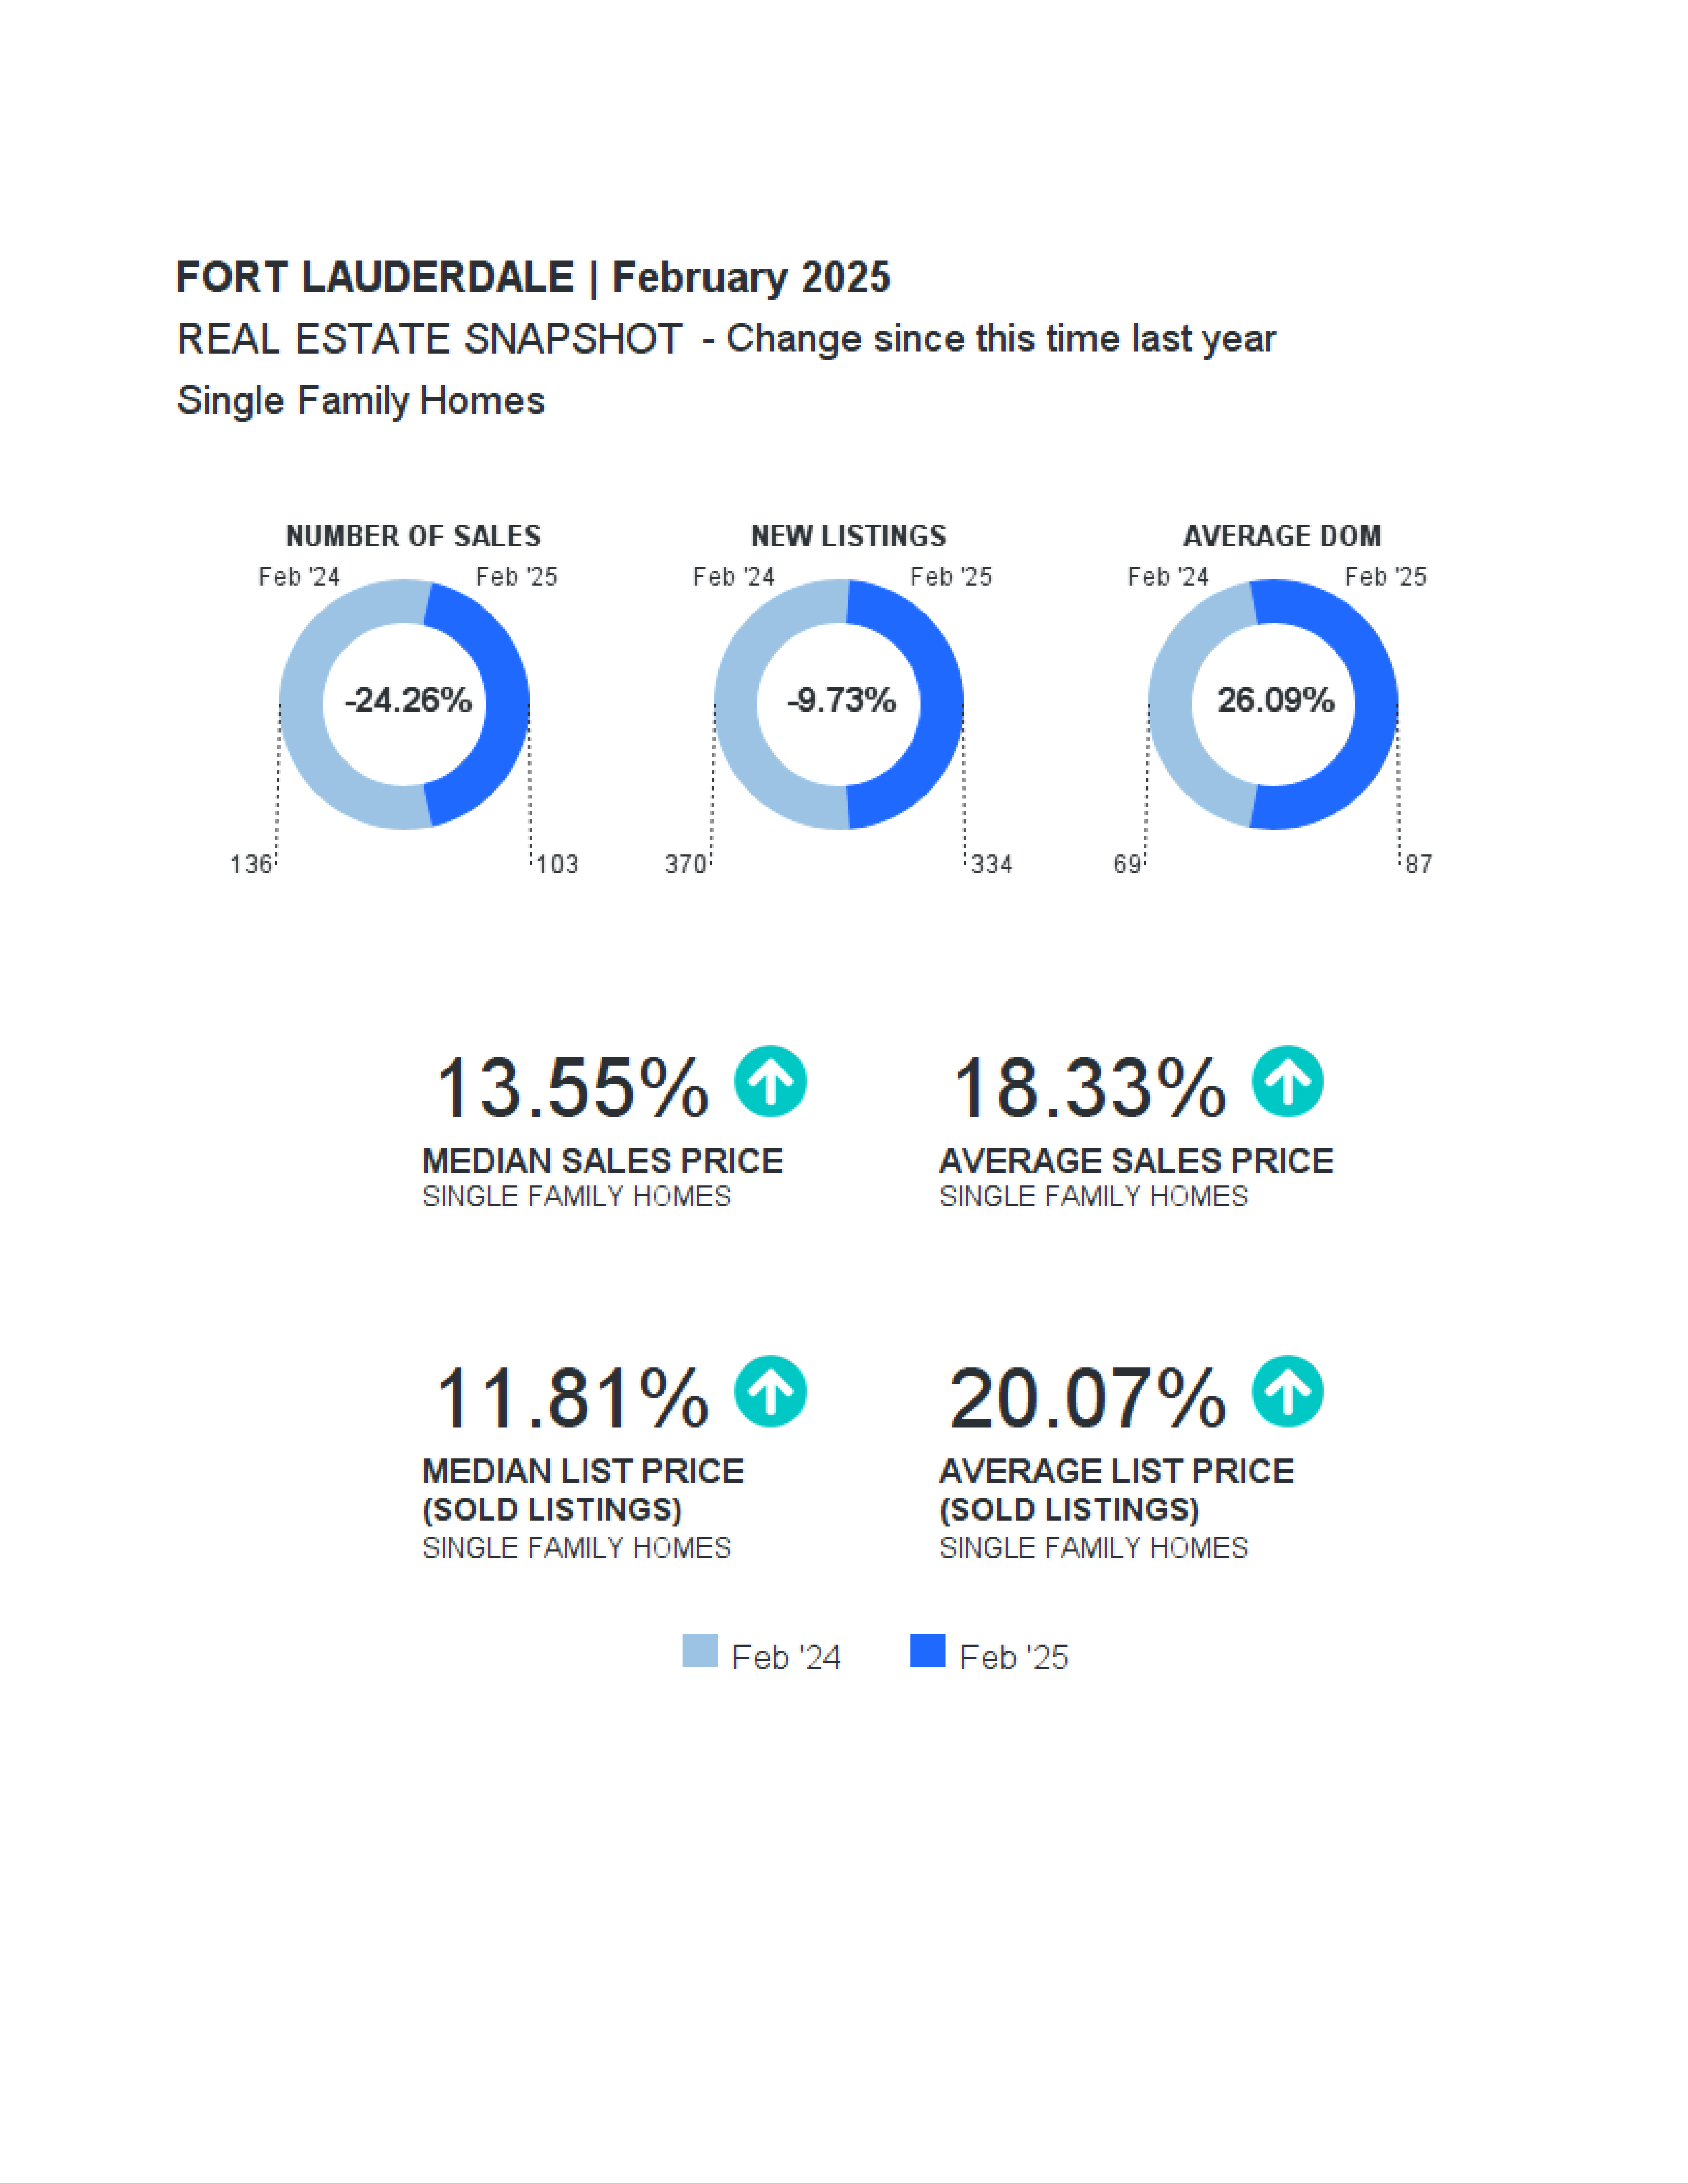
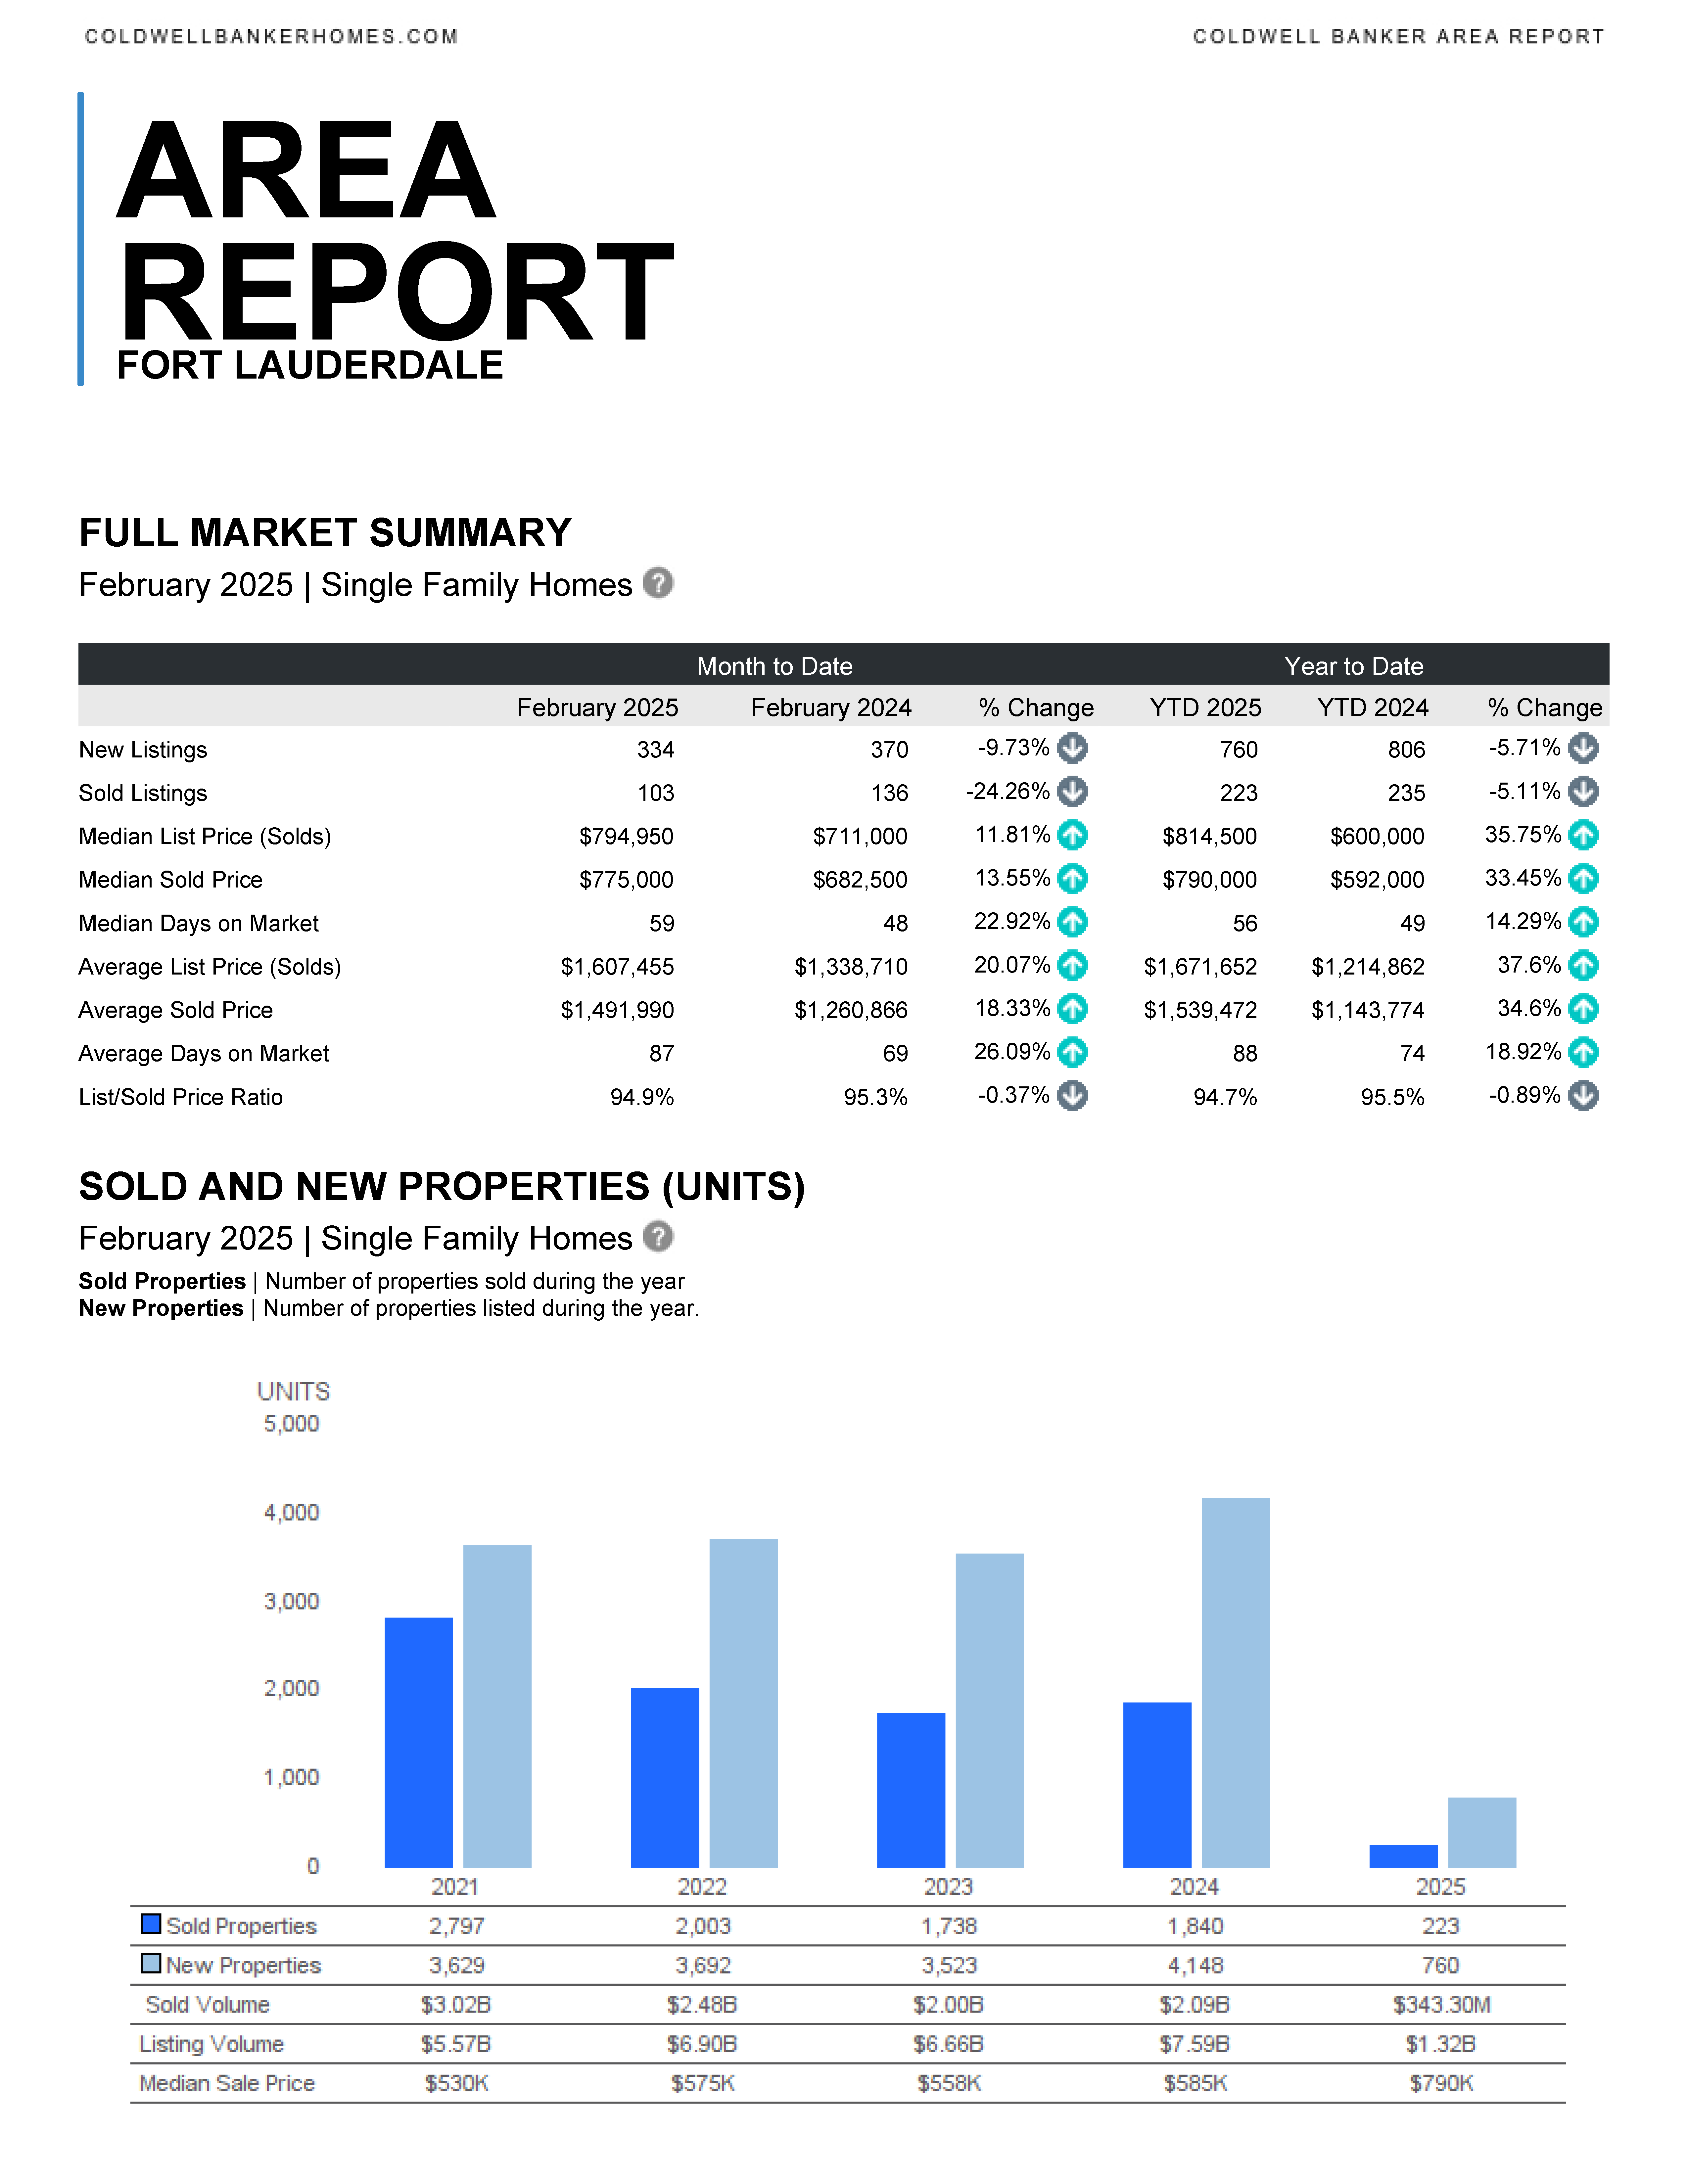
Fort Lauderdale February 2025 Area Report
Fort Lauderdale February 2025 real estate statistics have been released.
Fort Lauderdale Area Reports
Single Family Homes
Condominium & Townhouses
Commonly asked questions while reviewing the reports:
What is the difference between “Median Sales Price” and “Average Sales Price”?
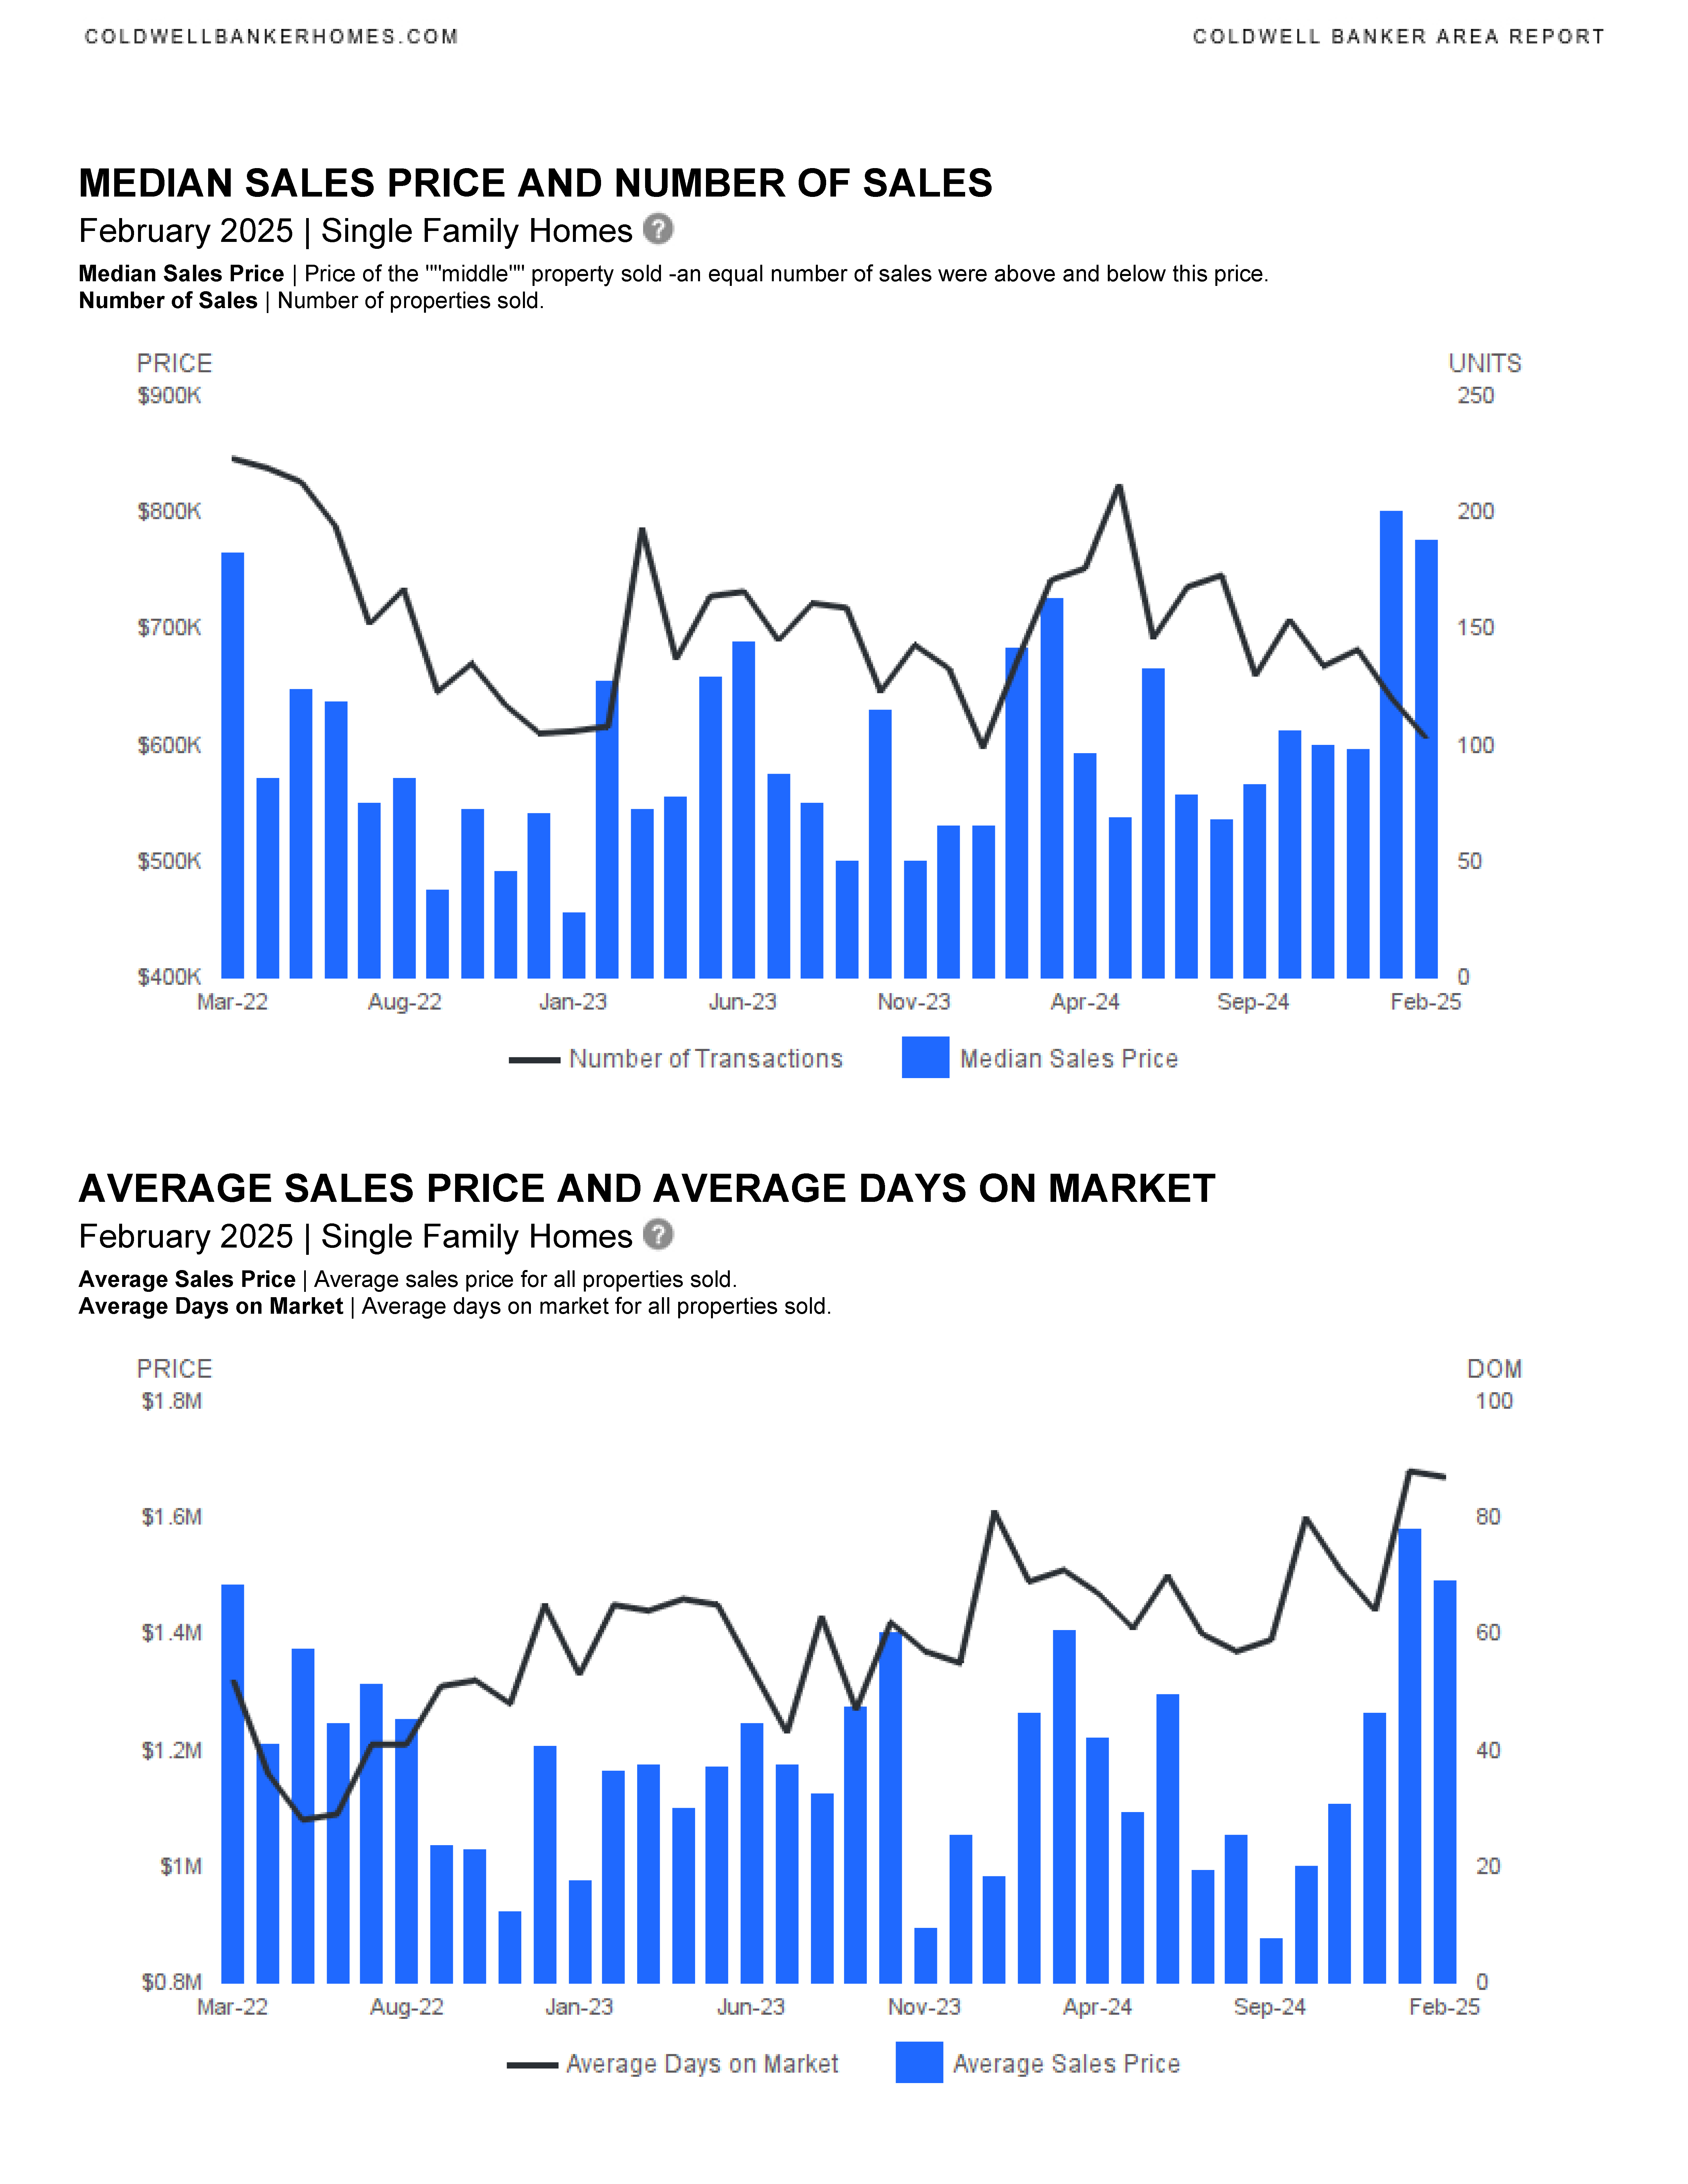
Median Sales Price | Price of the “”middle”” property sold -an equal number of sales were above and below this price.
Average Sales Price | Average sales price for all properties sold.
What does “Absorption Rate” mean?
Absorption Rate | Looks at the past year’s monthly supply of inventory. In a normal market there should be a 6 month supply. The higher the rate above 6 the more aggressive a seller has to be with the competition; price and having a picture perfect property.
Single Family Home Area Report listed first, Condo/Townhouses listed second:


We are entering a new real estate market in SE Florida. Please contact me if you would like to be sent updated area market reports for Fort Lauderdale or another SE Florida city. We can discuss the market, current trends and how we can work together to accomplish your real estate goals. I am here to help.
CONTACT ANNETTE
Let’s start working together!
Annette Dammeyer, REALTOR®, ABR®, AHWD®
Coldwell Banker Realty
901 E Las Olas Blvd STE 101, Fort Lauderdale, FL 33301
808.747.3686
SL 3535792
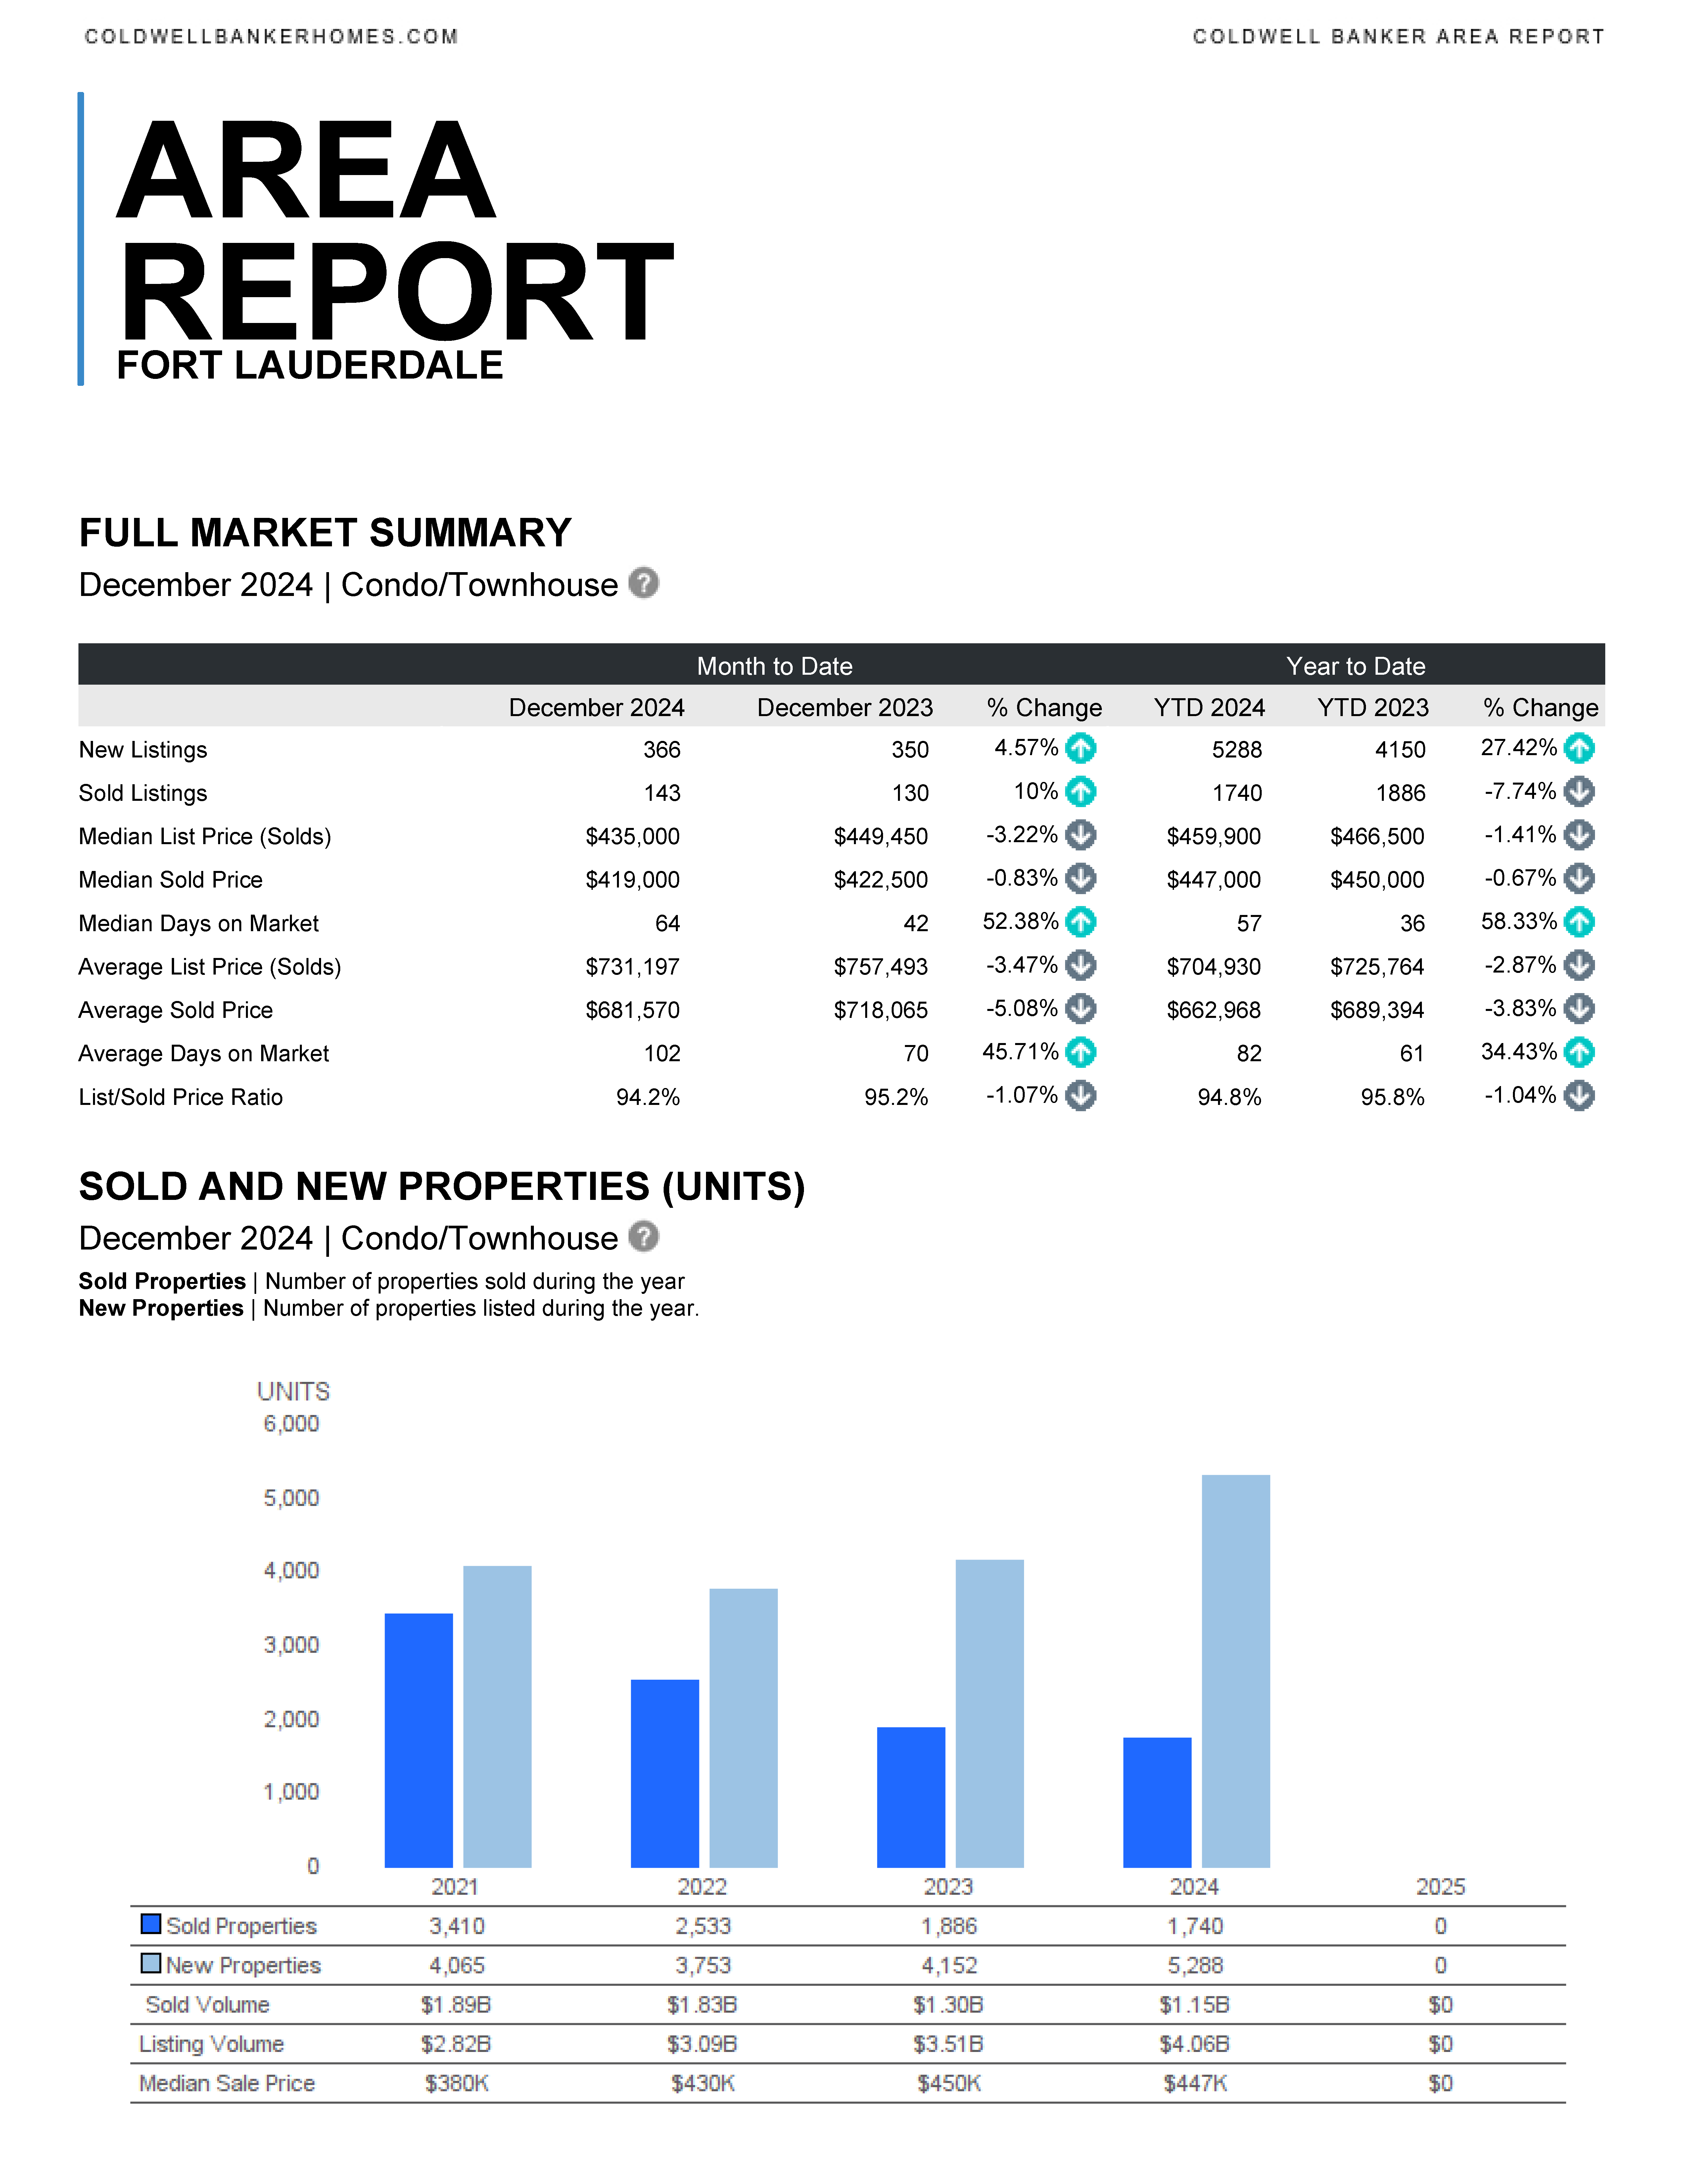
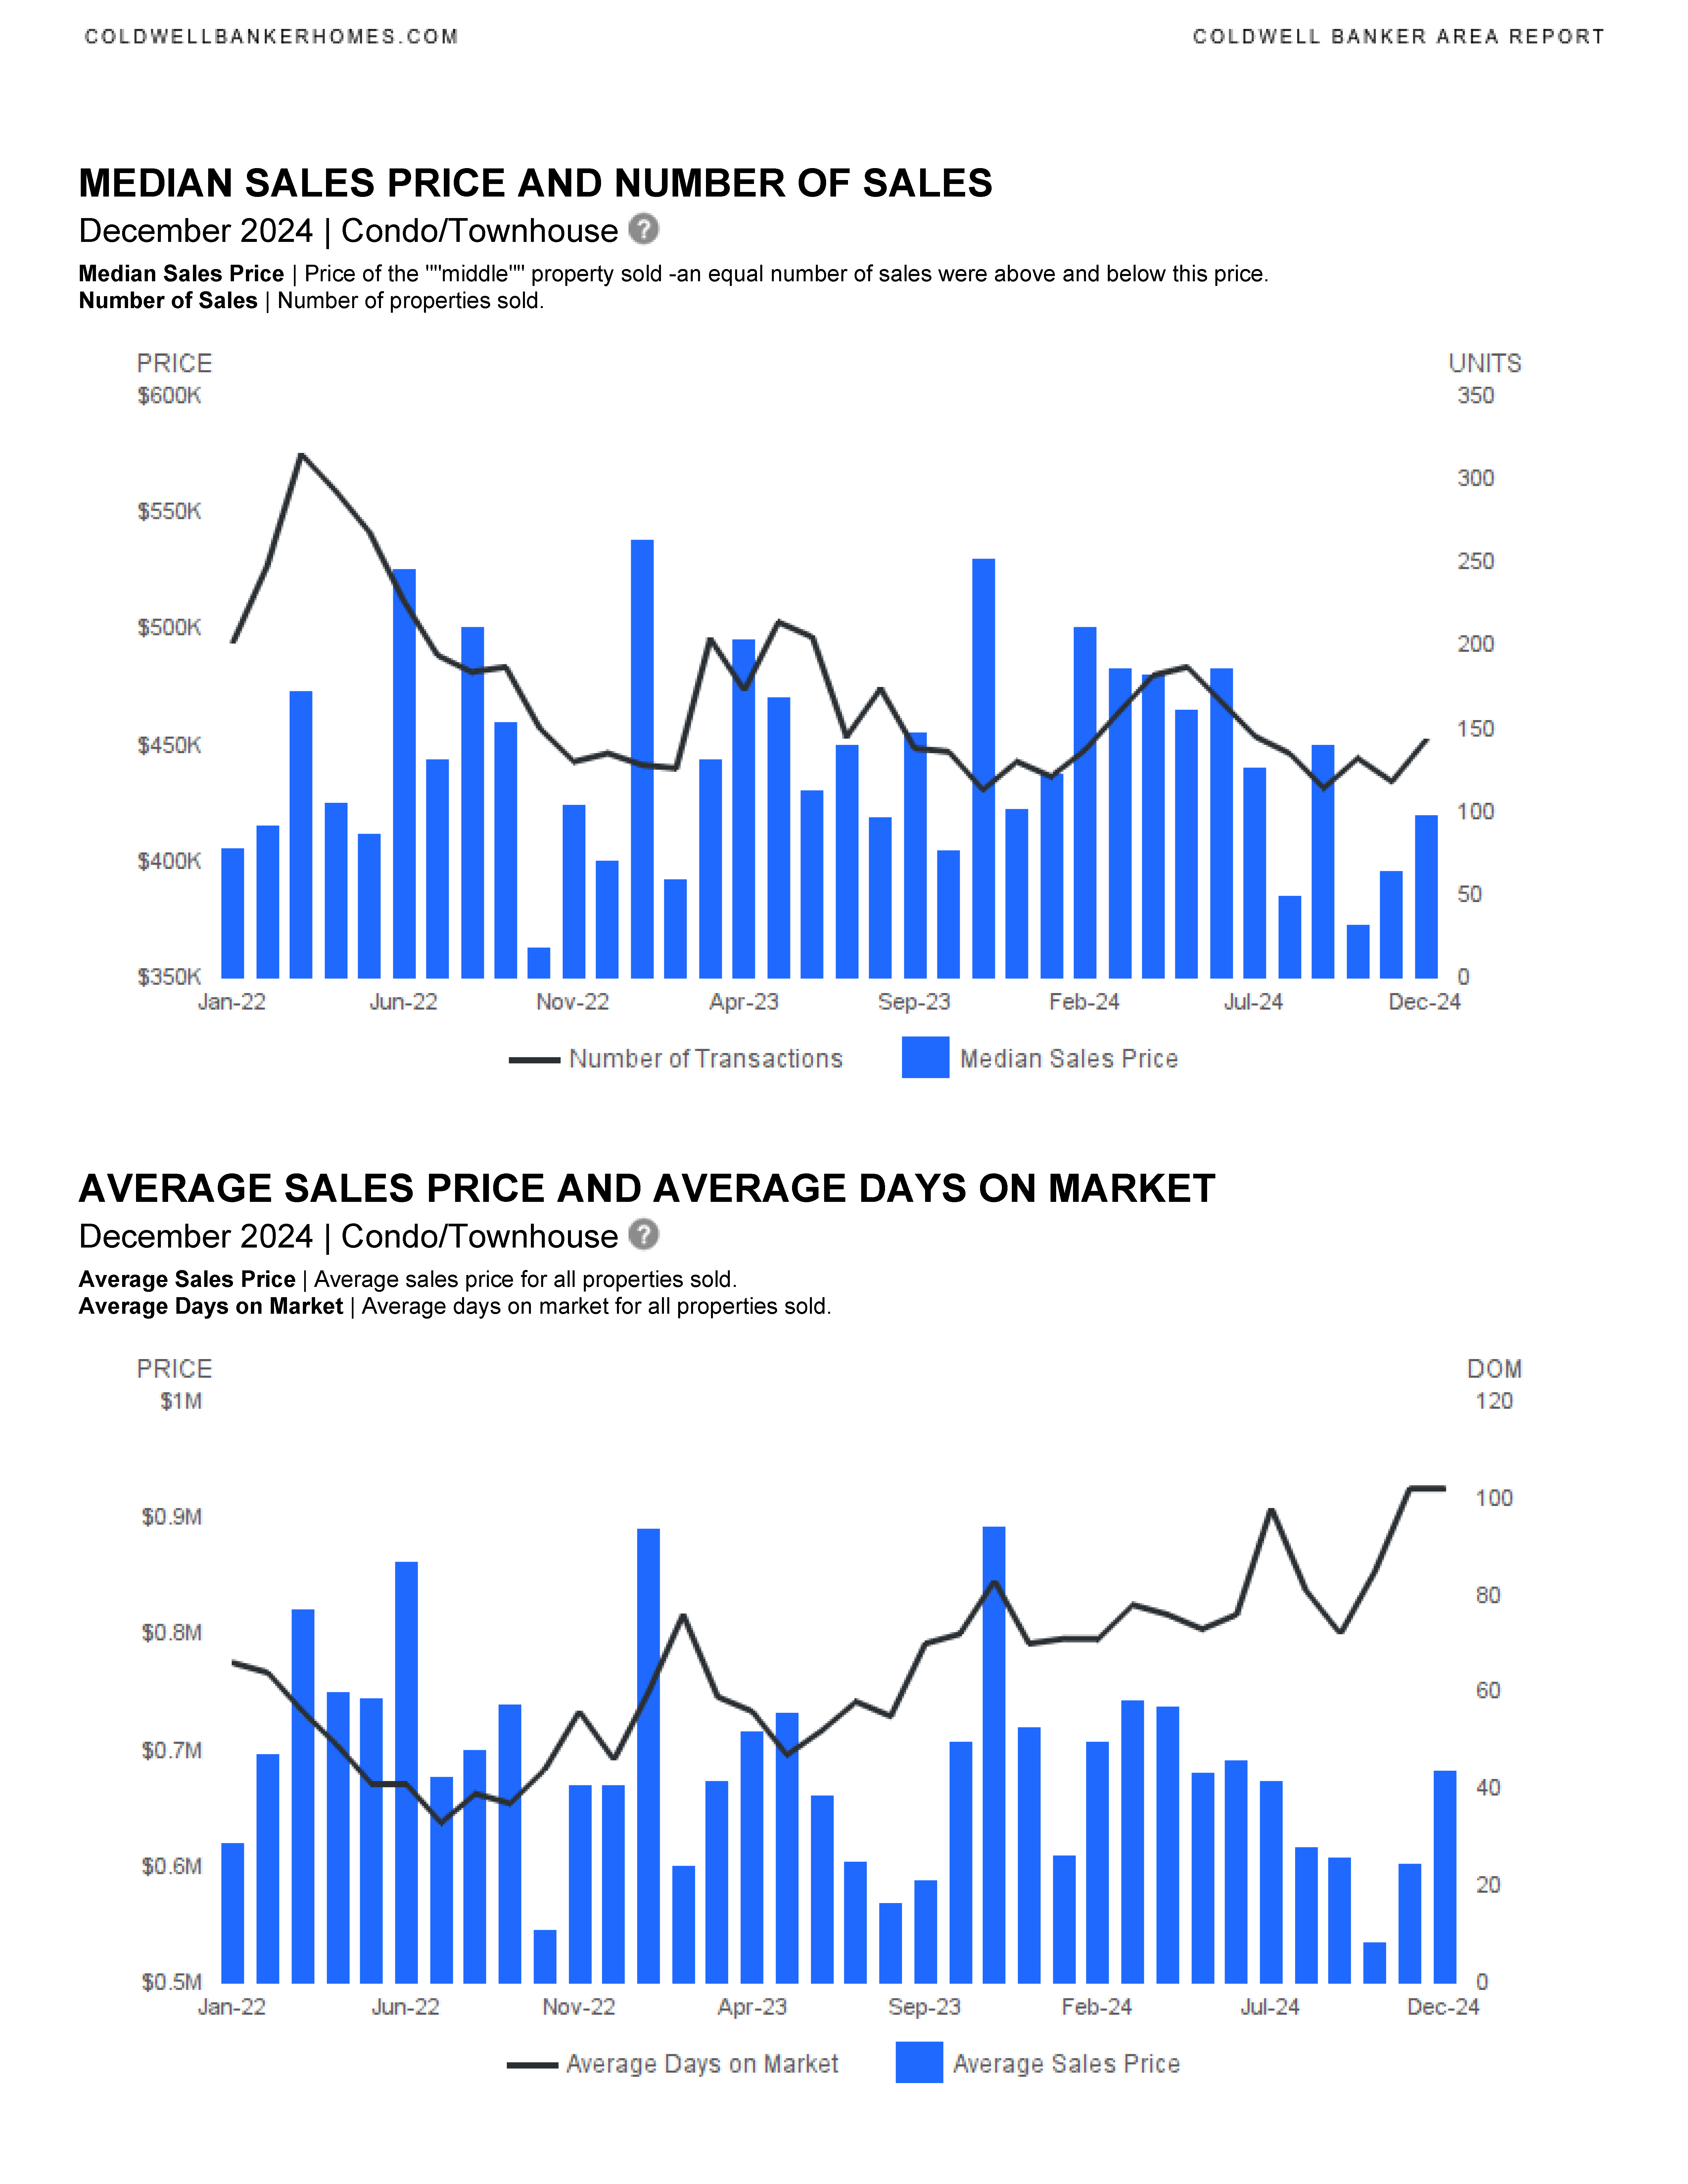
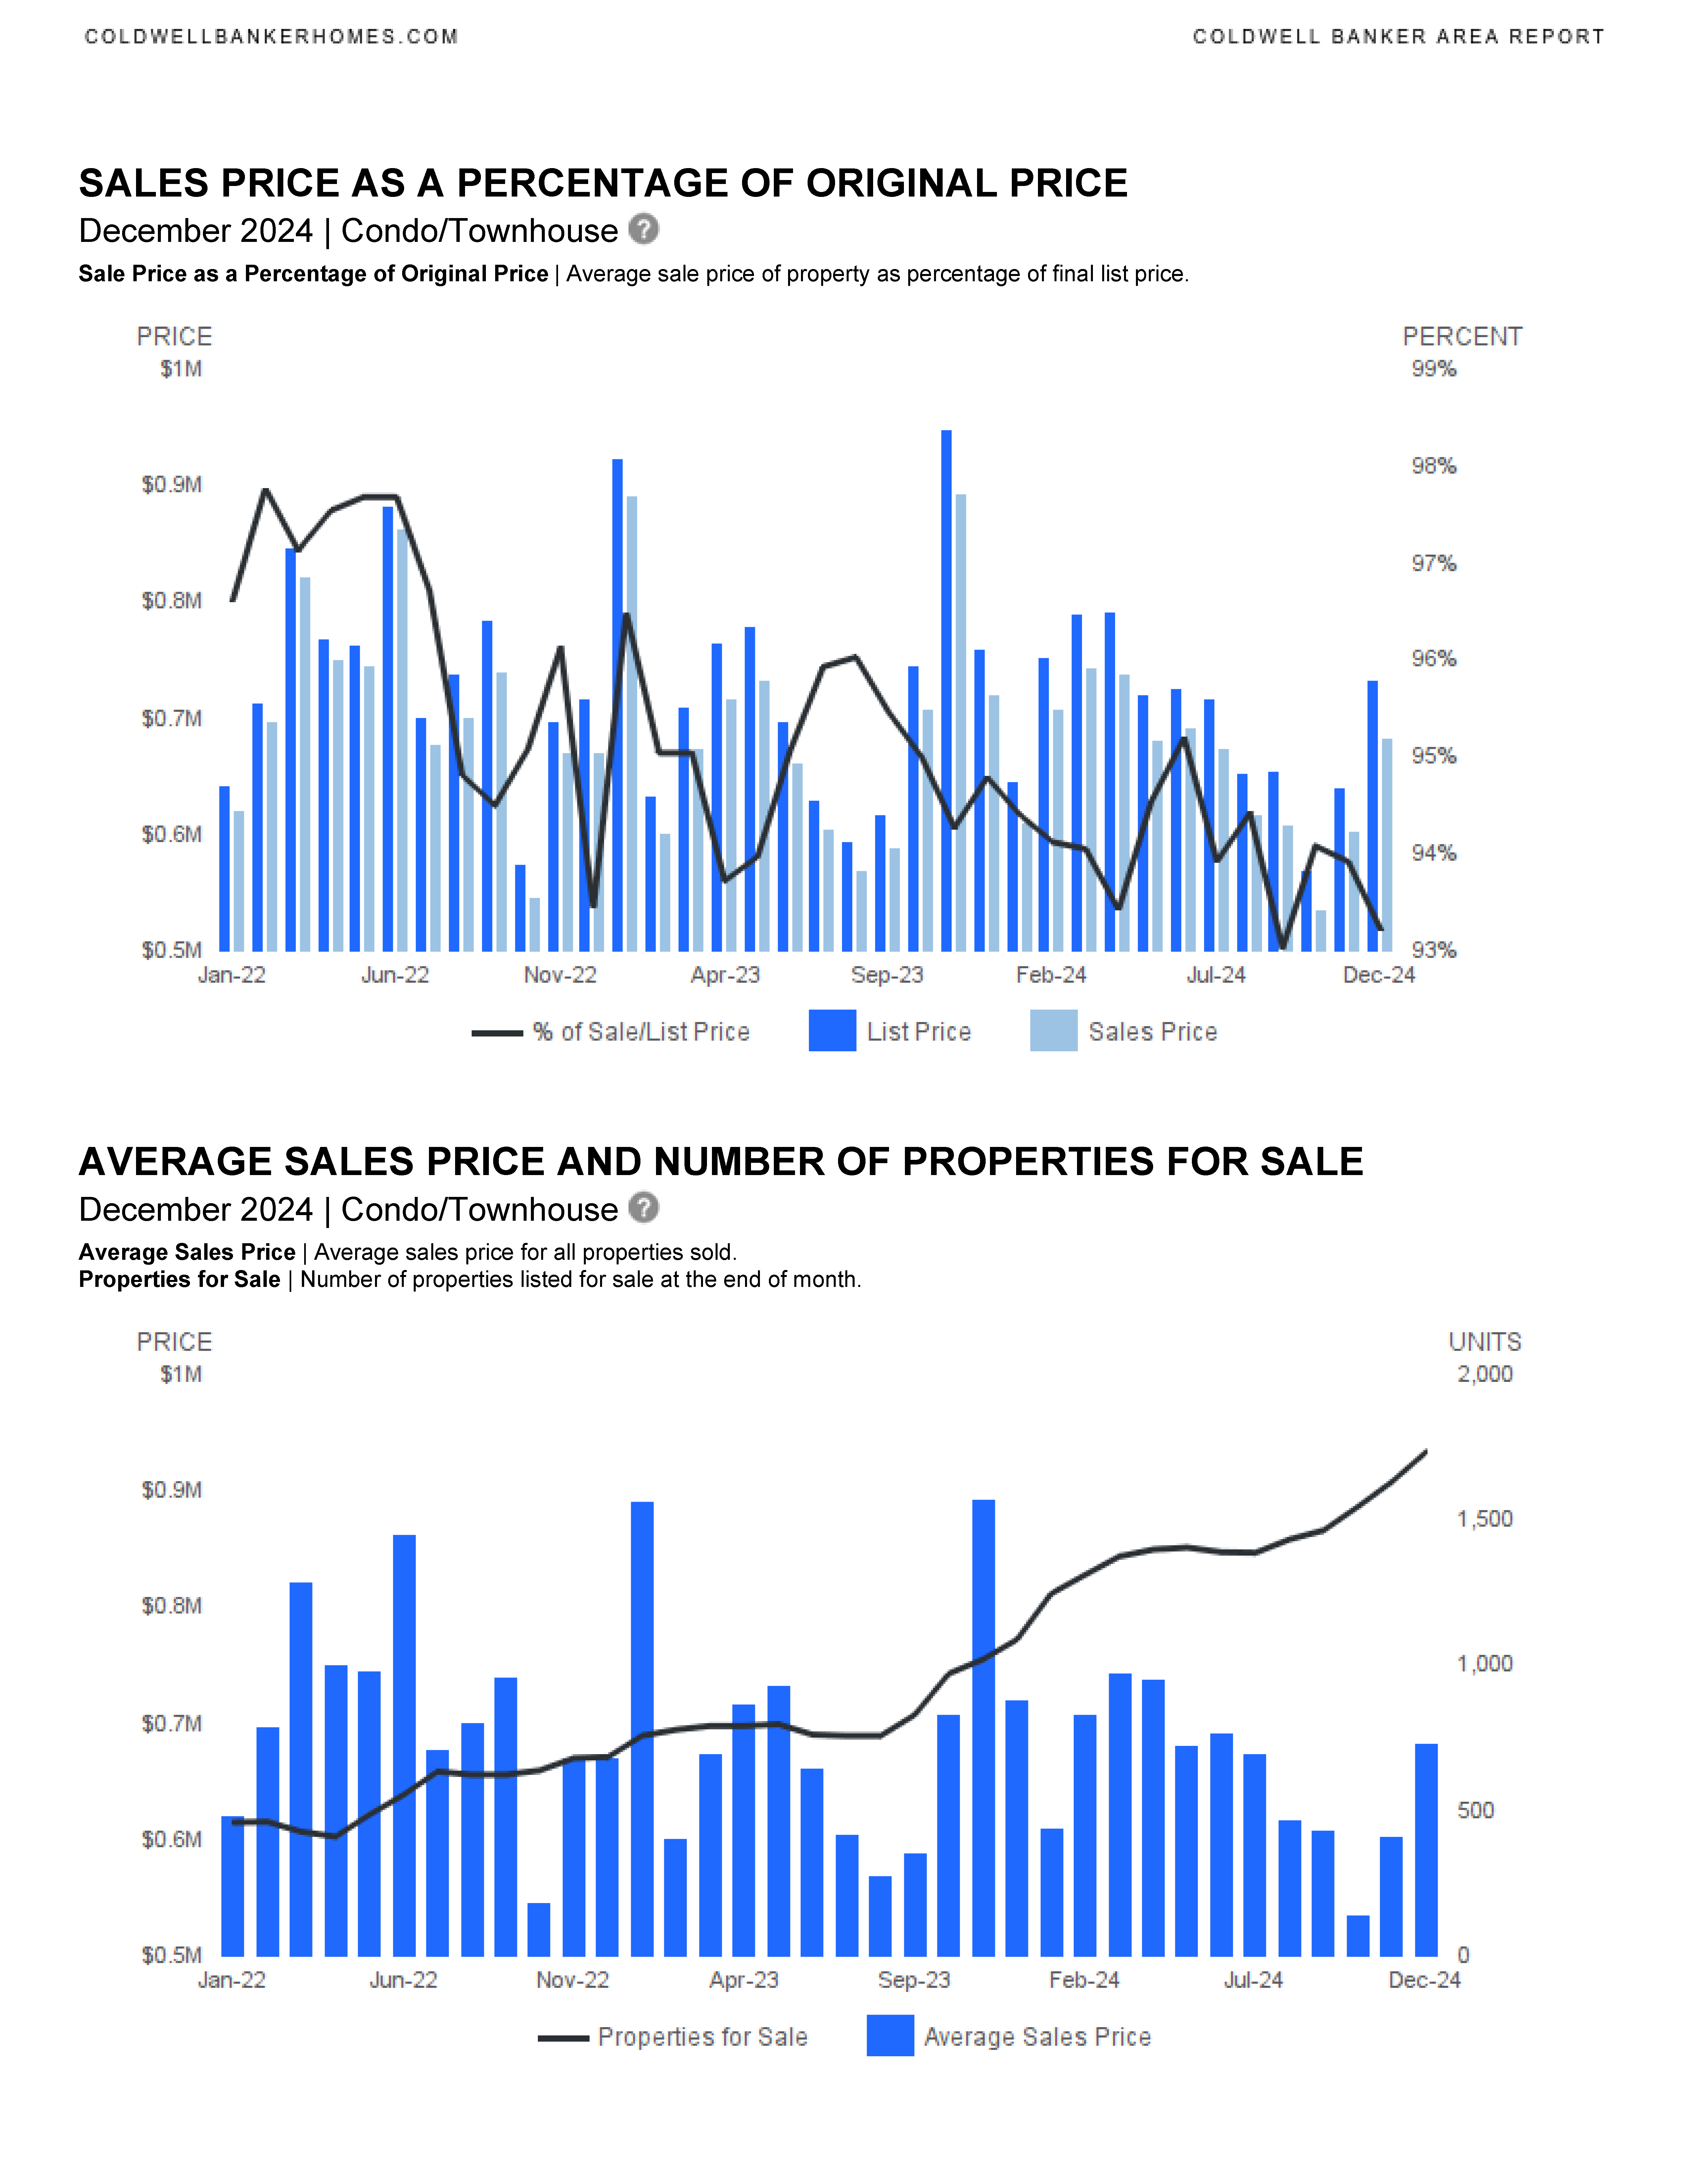
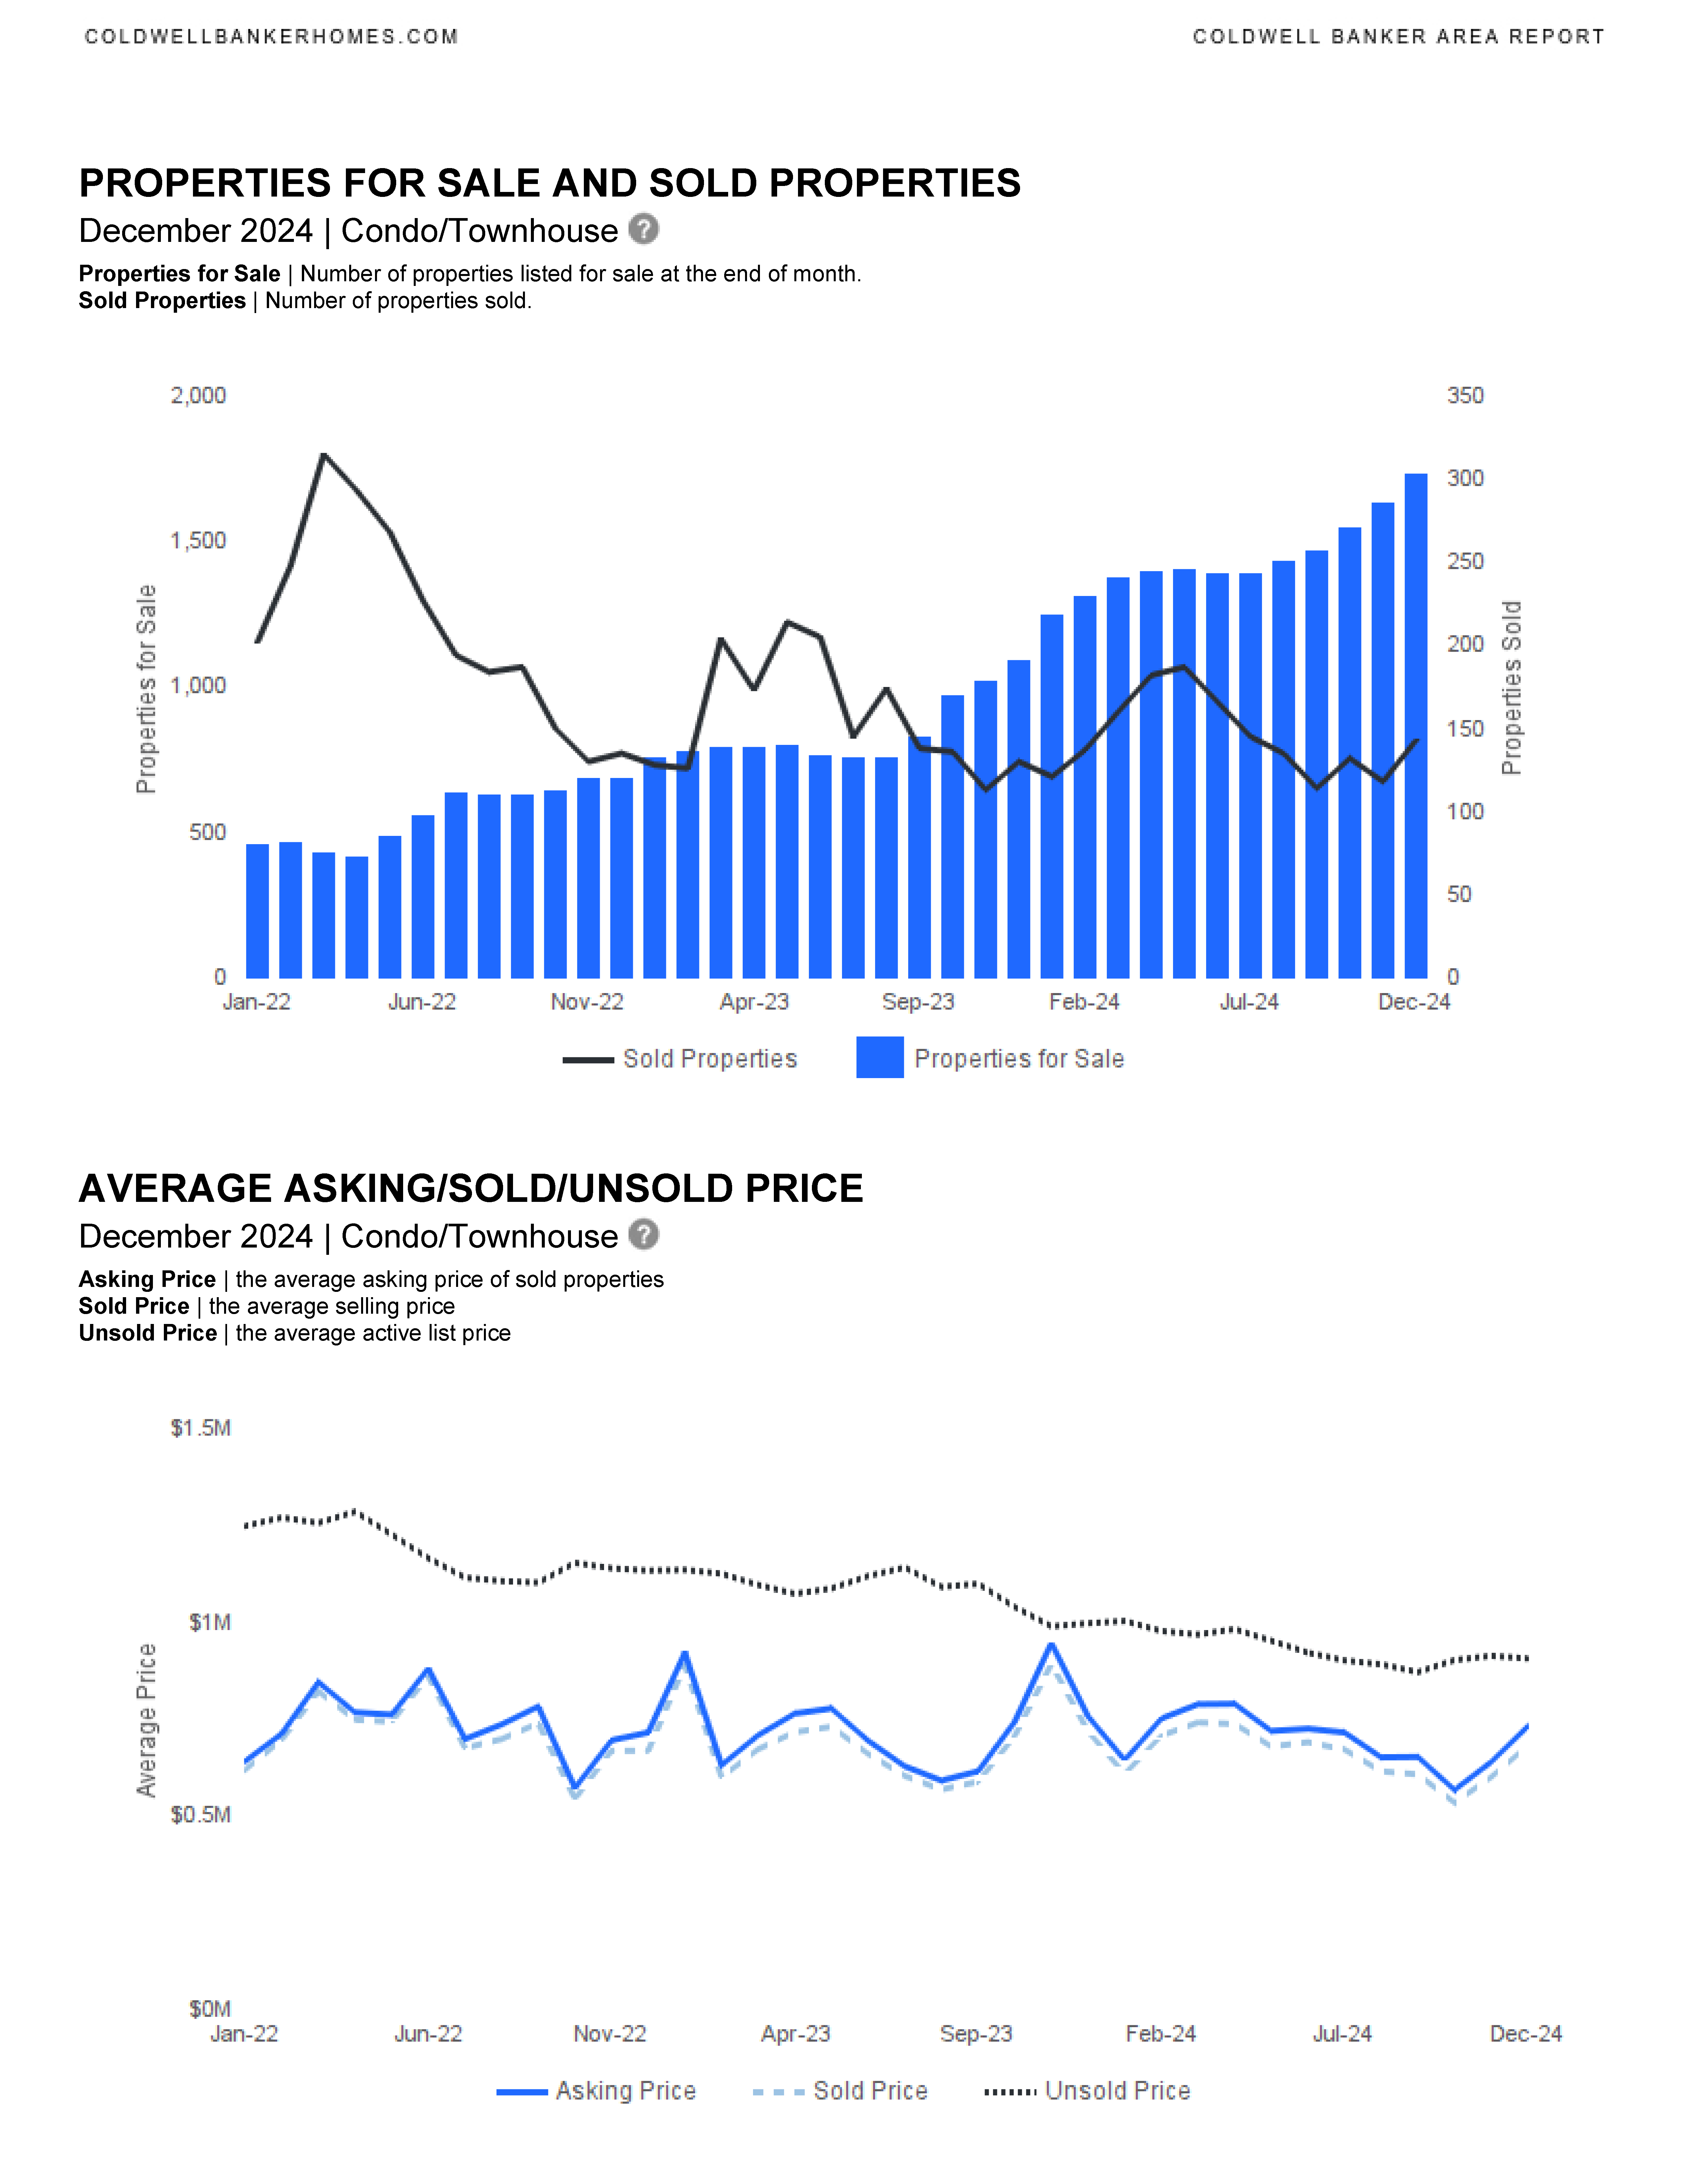
Fort Lauderdale December 2024 Area Report
Fort Lauderdale December 2024 real estate statistics have been released.
Fort Lauderdale Area Reports
Single Family Homes
Condominium & Townhouses
Commonly asked questions while reviewing the reports:
What is the difference between “Median Sales Price” and “Average Sales Price”?
Median Sales Price | Price of the “”middle”” property sold -an equal number of sales were above and below this price.
Average Sales Price | Average sales price for all properties sold.
What does “Absorption Rate” mean?
Absorption Rate | Looks at the past year’s monthly supply of inventory. In a normal market there should be a 6 month supply. The higher the rate above 6 the more aggressive a seller has to be with the competition; price and having a picture perfect property.
Single Family Home Area Report listed first, Condo/Townhouses listed second:


Please contact me if you would like to be sent updated area market reports for Fort Lauderdale or another SE Florida city. We can discuss the market, current trends and how we can work together to accomplish your real estate goals.
CONTACT ANNETTE
Let’s start working together!
Annette Dammeyer, REALTOR®, ABR®, AHWD®
Coldwell Banker Realty
901 E Las Olas Blvd STE 101, Fort Lauderdale, FL 33301
808.747.3686
SL 353579
Fort Lauderdale October 2024 Area Report
Fort Lauderdale October 2024 real estate statistics have been released.
Fort Lauderdale Area Reports
Single Family Homes
Condominium & Townhouses
Commonly asked questions while reviewing the reports:
What is the difference between “Median Sales Price” and “Average Sales Price”?
Median Sales Price | Price of the “”middle”” property sold -an equal number of sales were above and below this price.
Average Sales Price | Average sales price for all properties sold.
What does “Absorption Rate” mean?
Absorption Rate | Looks at the past year’s monthly supply of inventory. In a normal market there should be a 6 month supply. The higher the rate above 6 the more aggressive a seller has to be with the competition; price and having a picture perfect property.
Single Family Home Area Report listed first, Condo/Townhouses listed second:


Please contact me if you would like to be sent updated area market reports for Fort Lauderdale or another SE Florida city. We can discuss the market, current trends and how we can work together to accomplish your real estate goals.
CONTACT ANNETTE
Let’s start working together!

Annette Dammeyer, REALTOR®, ABR®, AHWD®
Coldwell Banker Realty
901 E Las Olas Blvd STE 101, Fort Lauderdale, FL 33301
808.747.3686
SL 353579
Fort Lauderdale September 2024 Area Report
Fort Lauderdale September 2024 real estate statistics have been released.
Fort Lauderdale Area Reports
Single Family Homes
Condominium & Townhouses
Commonly asked questions while reviewing the reports:
What is the difference between “Median Sales Price” and “Average Sales Price”?
Median Sales Price | Price of the “”middle”” property sold -an equal number of sales were above and below this price.
Average Sales Price | Average sales price for all properties sold.
What does “Absorption Rate” mean?
Absorption Rate | Looks at the past year’s monthly supply of inventory. In a normal market there should be a 6 month supply. The higher the rate above 6 the more aggressive a seller has to be with the competition; price and having a picture perfect property.
Single Family Home Area Report listed first, Condo/Townhouses listed second:


Please contact me if you would like to be automatically sent updated area market reports for Fort Lauderdale or another SE Florida city. We can discuss the market, current trends and how I can help you.
CONTACT ANNETTE
Let’s start working together!
Annette Dammeyer, REALTOR
Coldwell Banker Realty
901 E Las Olas Blvd STE 101, Fort Lauderdale, FL 33301
808.747.3686
SL 353579
Fort Lauderdale August 2024 Area Report
Fort Lauderdale August 2024 real estate statistics have been released.
Fort Lauderdale Area Reports
Single Family Homes
Condominium & Townhouses
Commonly asked questions while reviewing the reports:
What is the difference between “Median Sales Price” and “Average Sales Price”?
Median Sales Price | Price of the “”middle”” property sold -an equal number of sales were above and below this price.
Average Sales Price | Average sales price for all properties sold.
What does “Absorption Rate” mean?
Absorption Rate | Looks at the past year’s monthly supply of inventory. In a normal market there should be a 6 month supply. The higher the rate above 6 the more aggressive a seller has to be with the competition; price and having a picture perfect property.
Single Family Home Area Report listed first, Condo/Townhouses listed second:


Please contact me if you would like to be automatically sent updated area market reports for Fort Lauderdale or another SE Florida city. I am here to help.
CONTACT ANNETTE
Let’s start working together!
Annette Dammeyer, REALTOR
Coldwell Banker Realty
901 E Las Olas Blvd STE 101, Fort Lauderdale, FL 33301
808.747.3686
SL 353579
Fort Lauderdale July 2024 Area Report

Fort Lauderdale July 2024 real estate statistics have been released.
Fort Lauderdale Area Reports
Single Family Homes
Condominium & Townhouses
Commonly asked questions while reviewing the reports:
What is the difference between “Median Sales Price” and “Average Sales Price”?
Median Sales Price | Price of the “”middle”” property sold -an equal number of sales were above and below this price.
Average Sales Price | Average sales price for all properties sold.
What does “Absorption Rate” mean?
Absorption Rate | Looks at the past year’s monthly supply of inventory. In a normal market there should be a 6 month supply. The higher the rate above 6 the more aggressive a seller has to be with the competition; price and having a picture perfect property.
Single Family Home Area Report listed first, Condo/Townhouses listed second:


Please contact me if you would like to be automatically sent updated area market reports for Fort Lauderdale or another SE Florida city. I am here to help.
CONTACT ANNETTE
Let’s start working together!
Annette Dammeyer, REALTOR
Coldwell Banker Realty
901 E Las Olas Blvd STE 101, Fort Lauderdale, FL 33301
808.747.3686
SL 353579


