
 Facebook
 X
X
 Pinterest
 Copy Link
Fort Lauderdale May 2026 Area Report
Fort Lauderdale May 2026 real estate statistics have been published.
Single Family Homes
Condominium & Townhouses
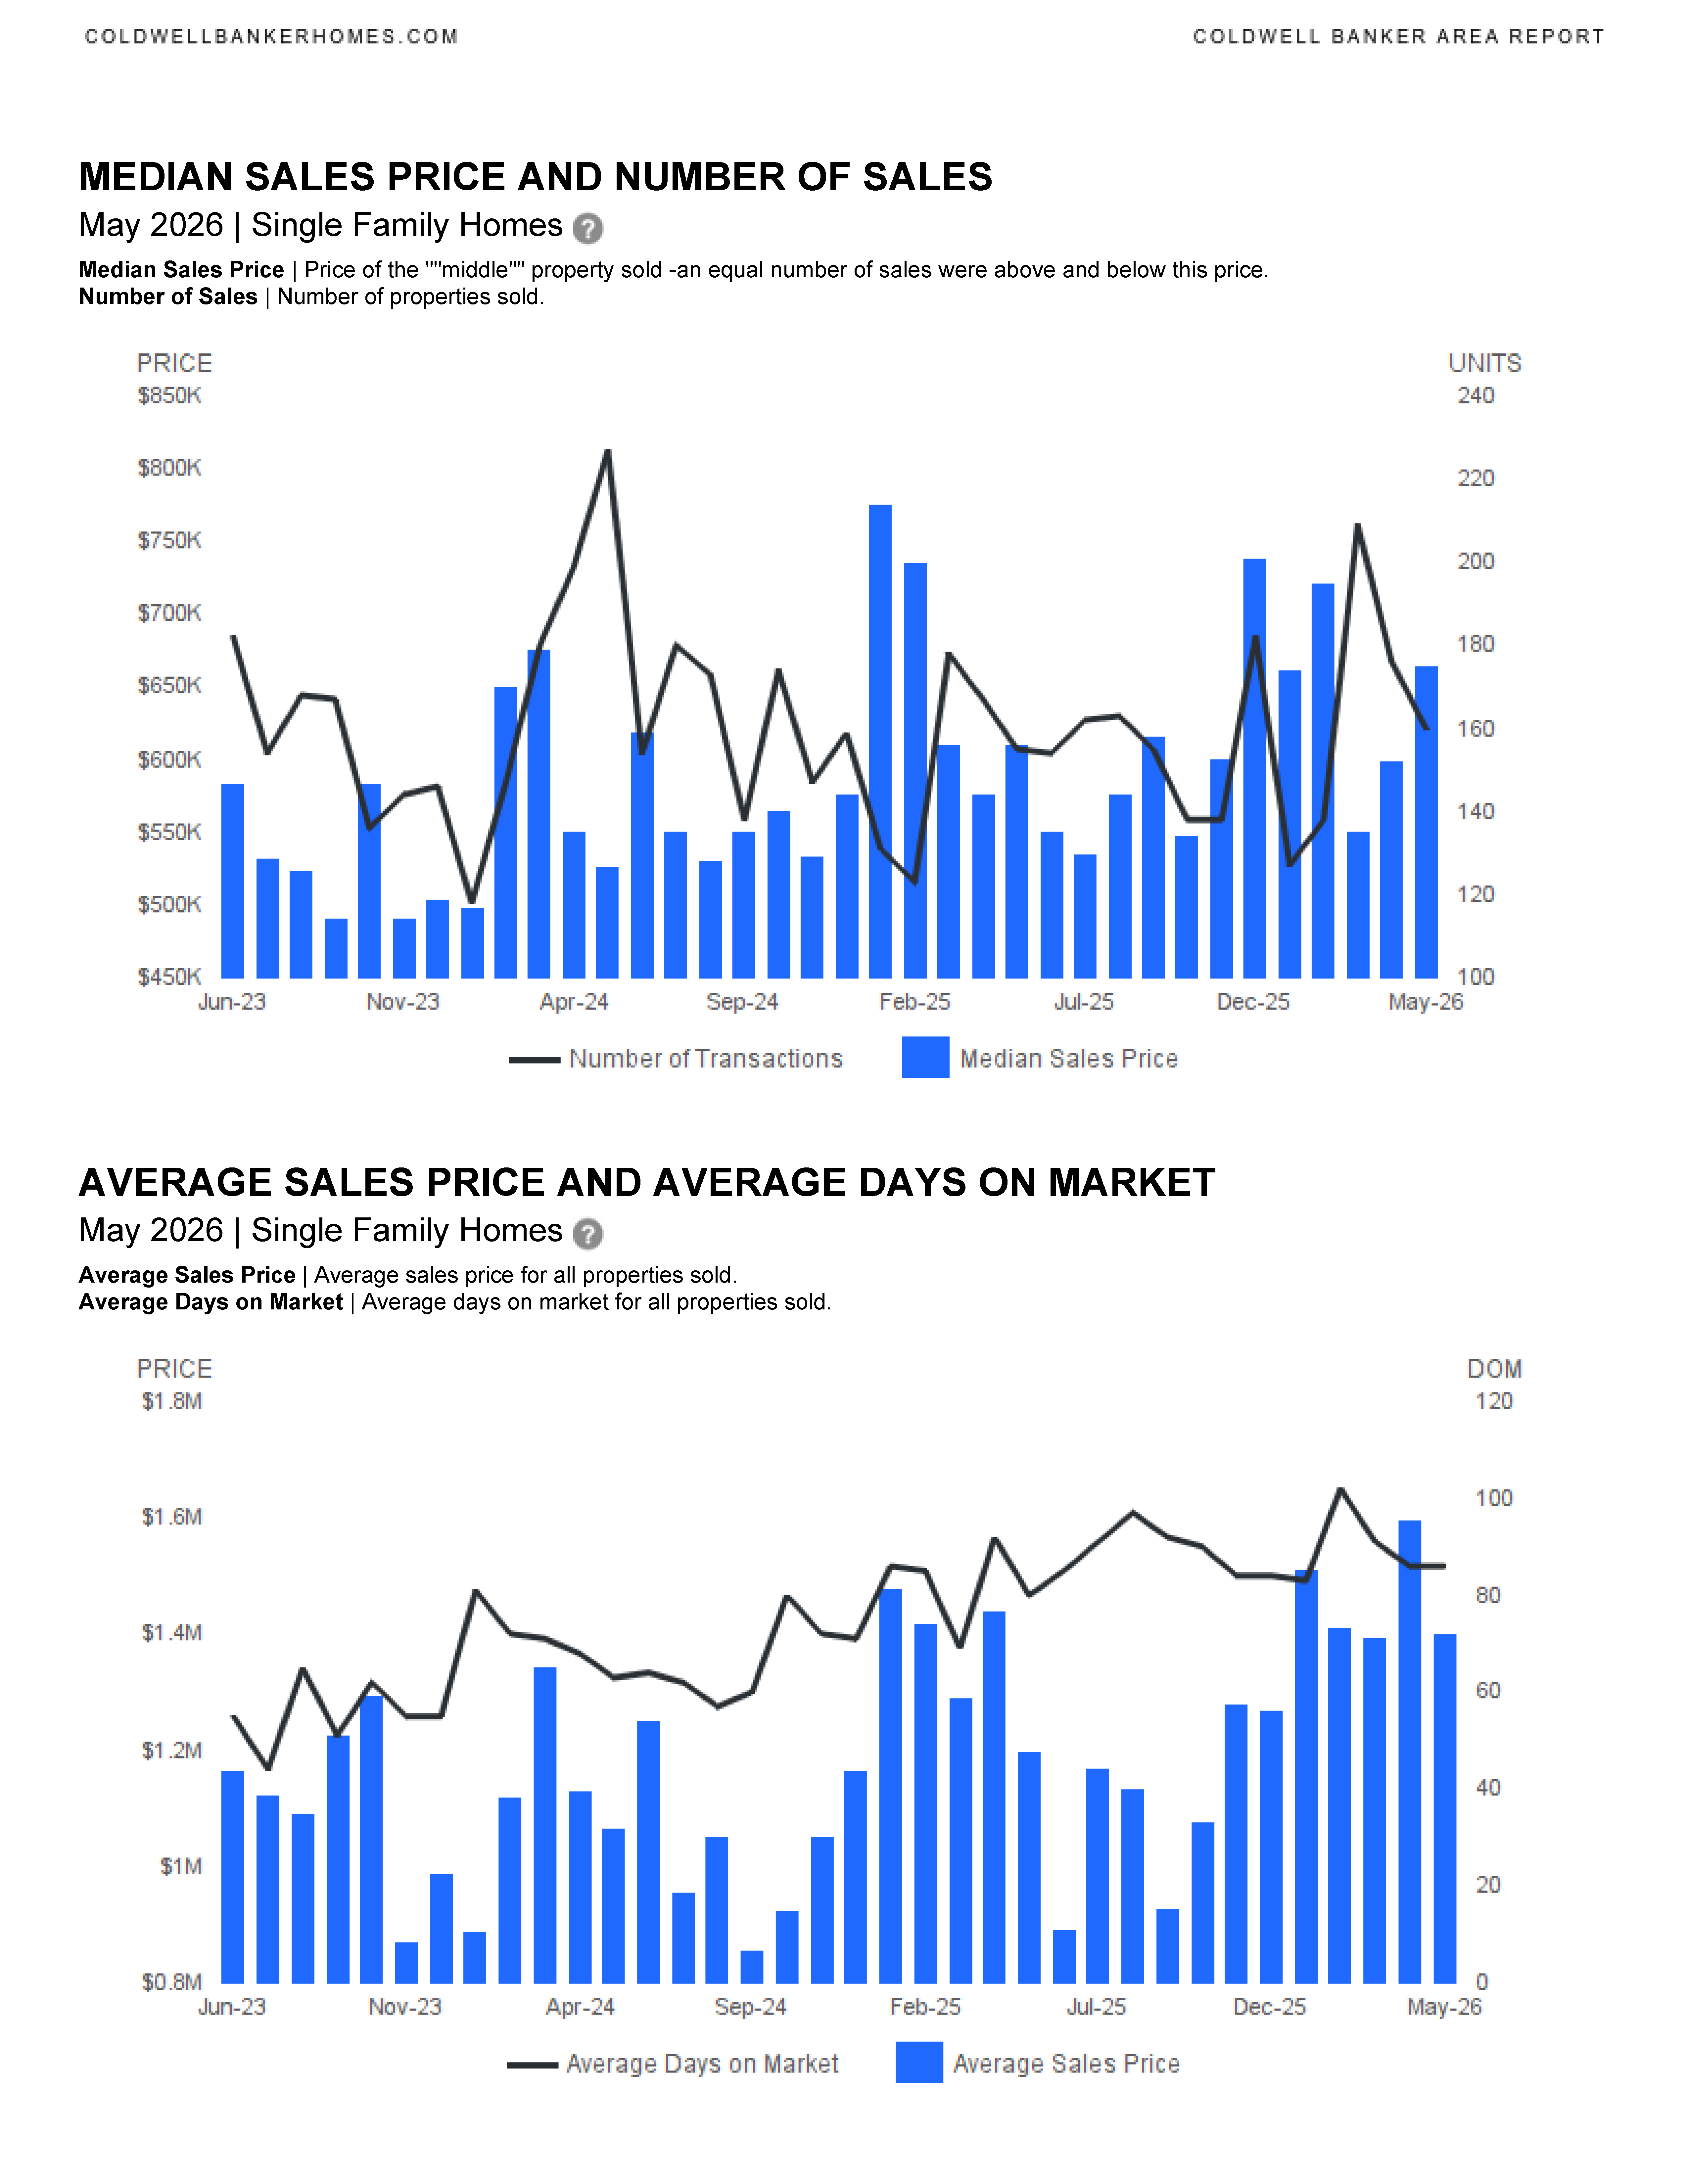
🏡 Single Family Homes – May 2026 Highlights
(Fort Lauderdale)
📈 Price Trends
- Median sales price ↑ 8.81% YoY to ~$663,750
- Average sales price ↑ 17.08% YoY
- Median list price (sold homes) ↑ 4.01%
- Average list price ↑ 19.84%
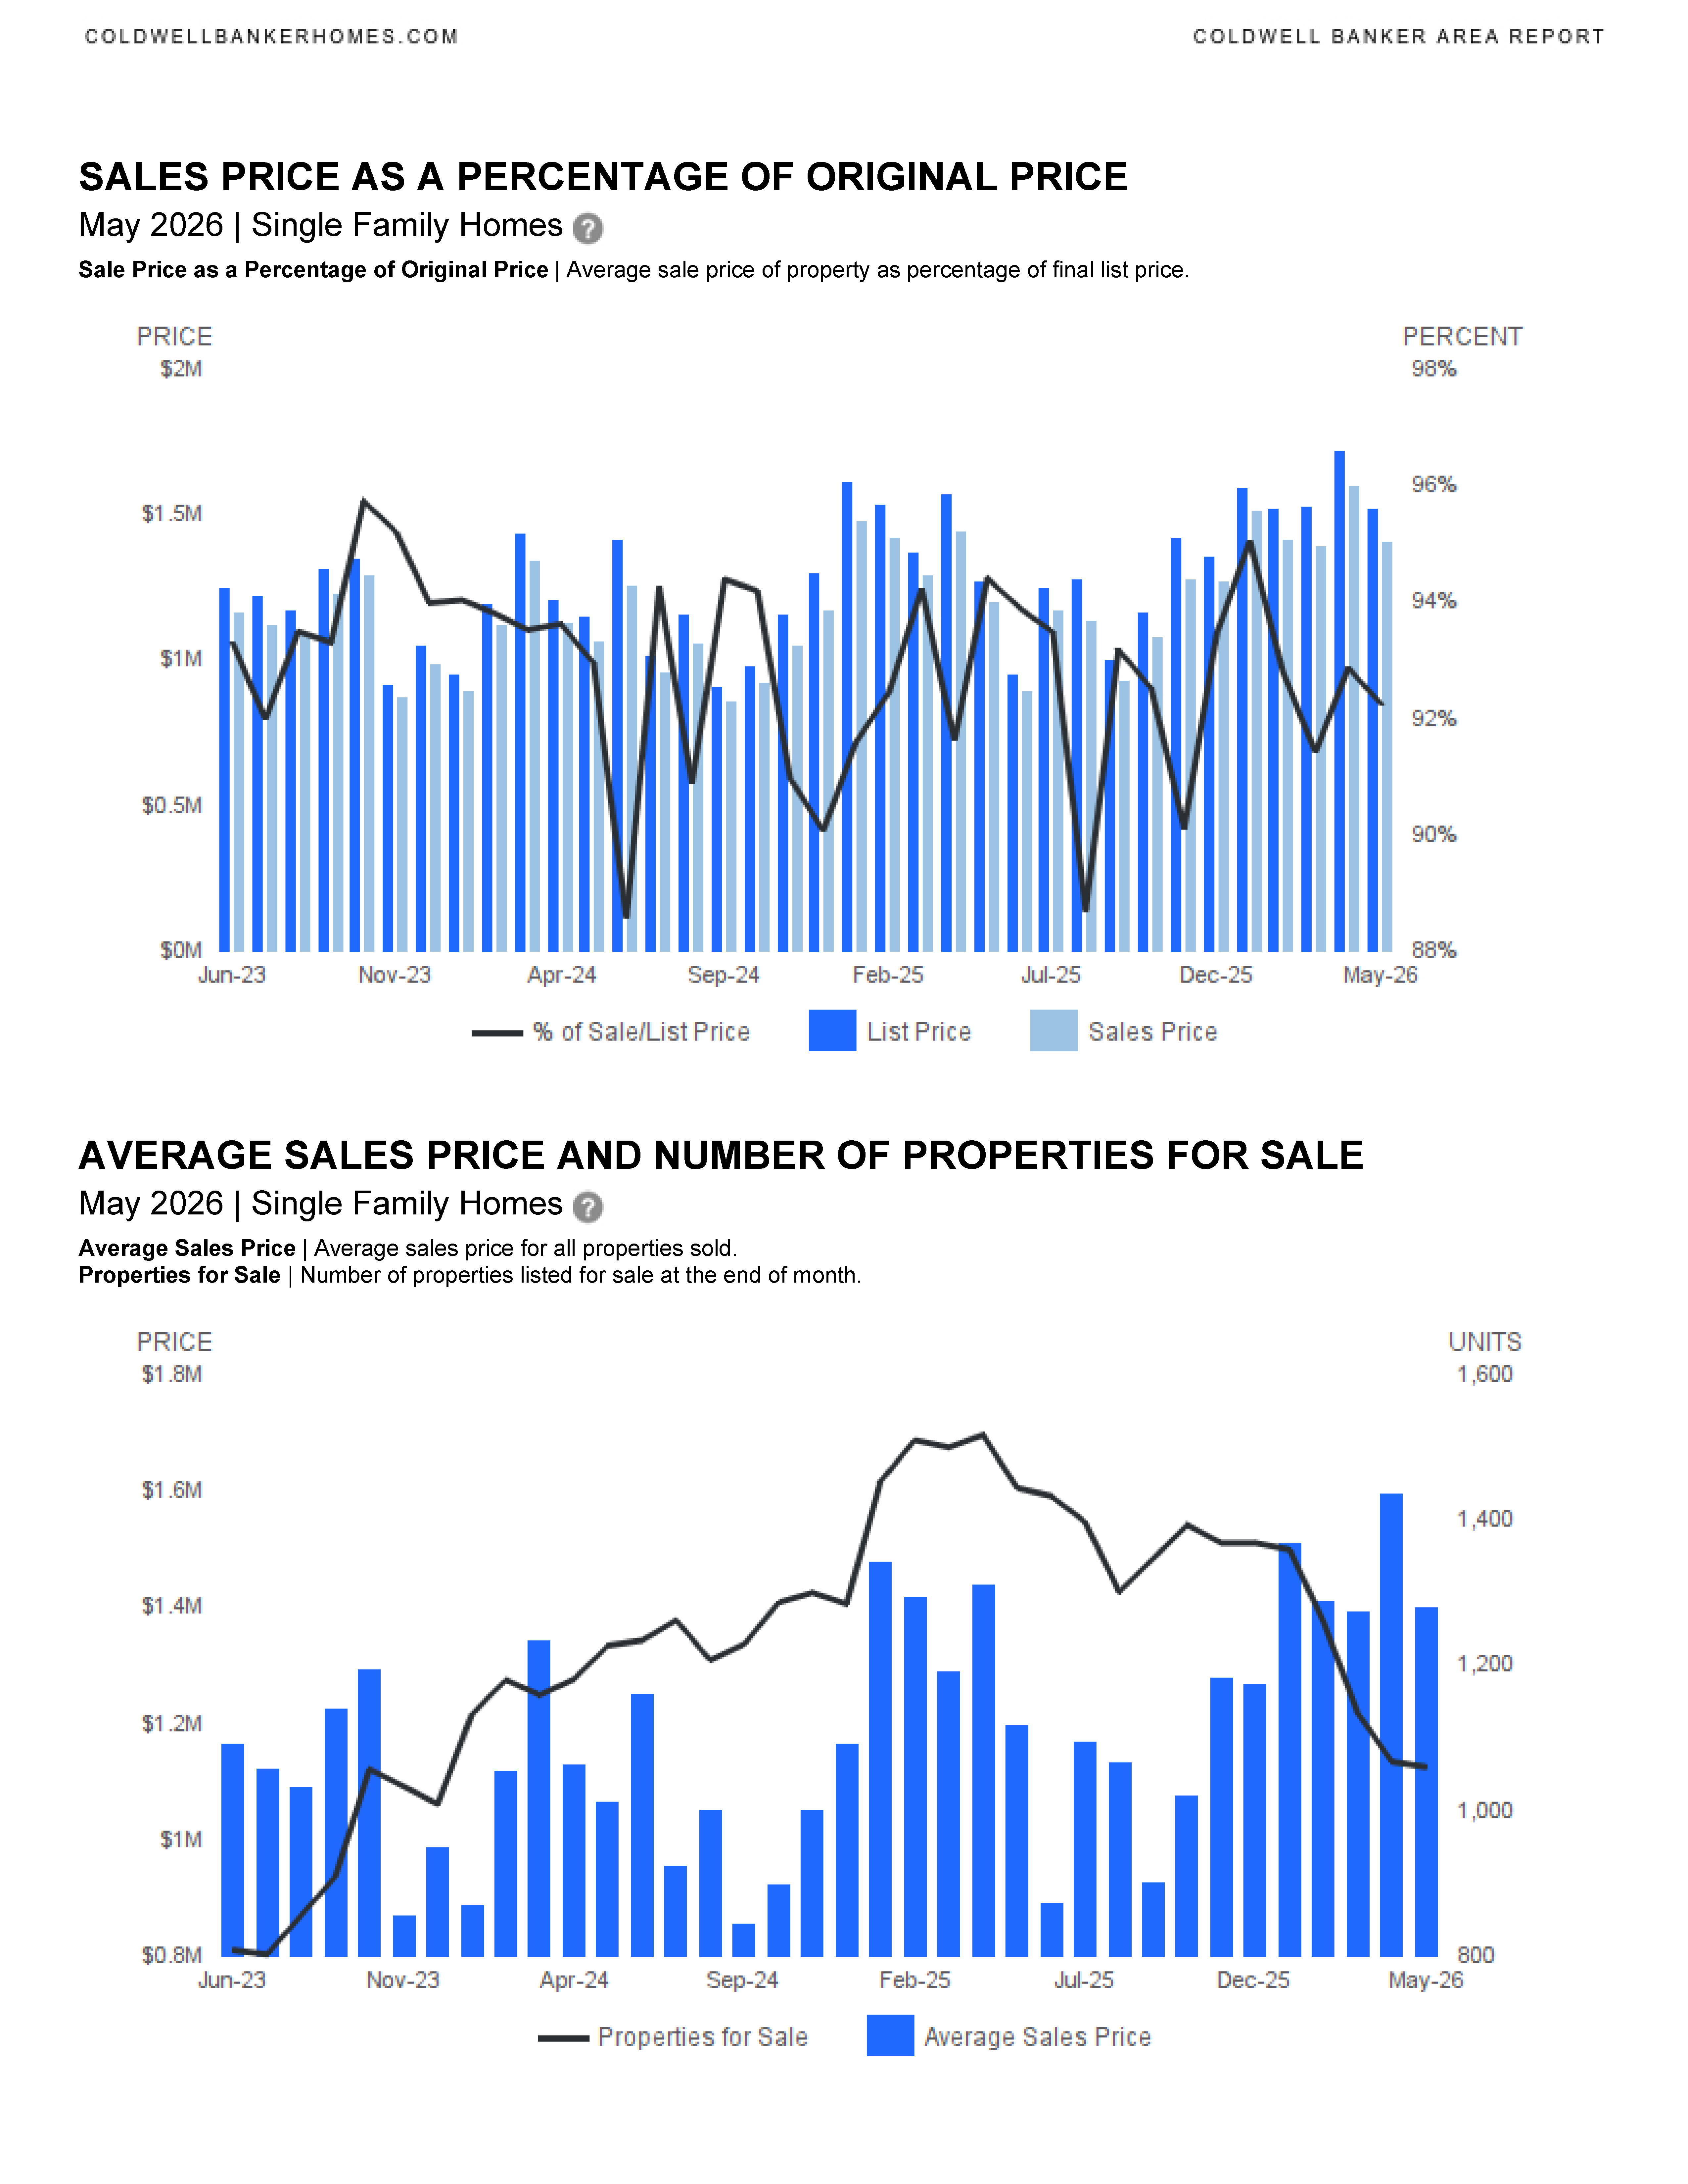
📉 Inventory & Supply
- New listings ↓ 18.21% YoY
- Year-to-date new listings ↓ 27.54%
- Months of inventory trending around ~6 months (balanced range) based on chart
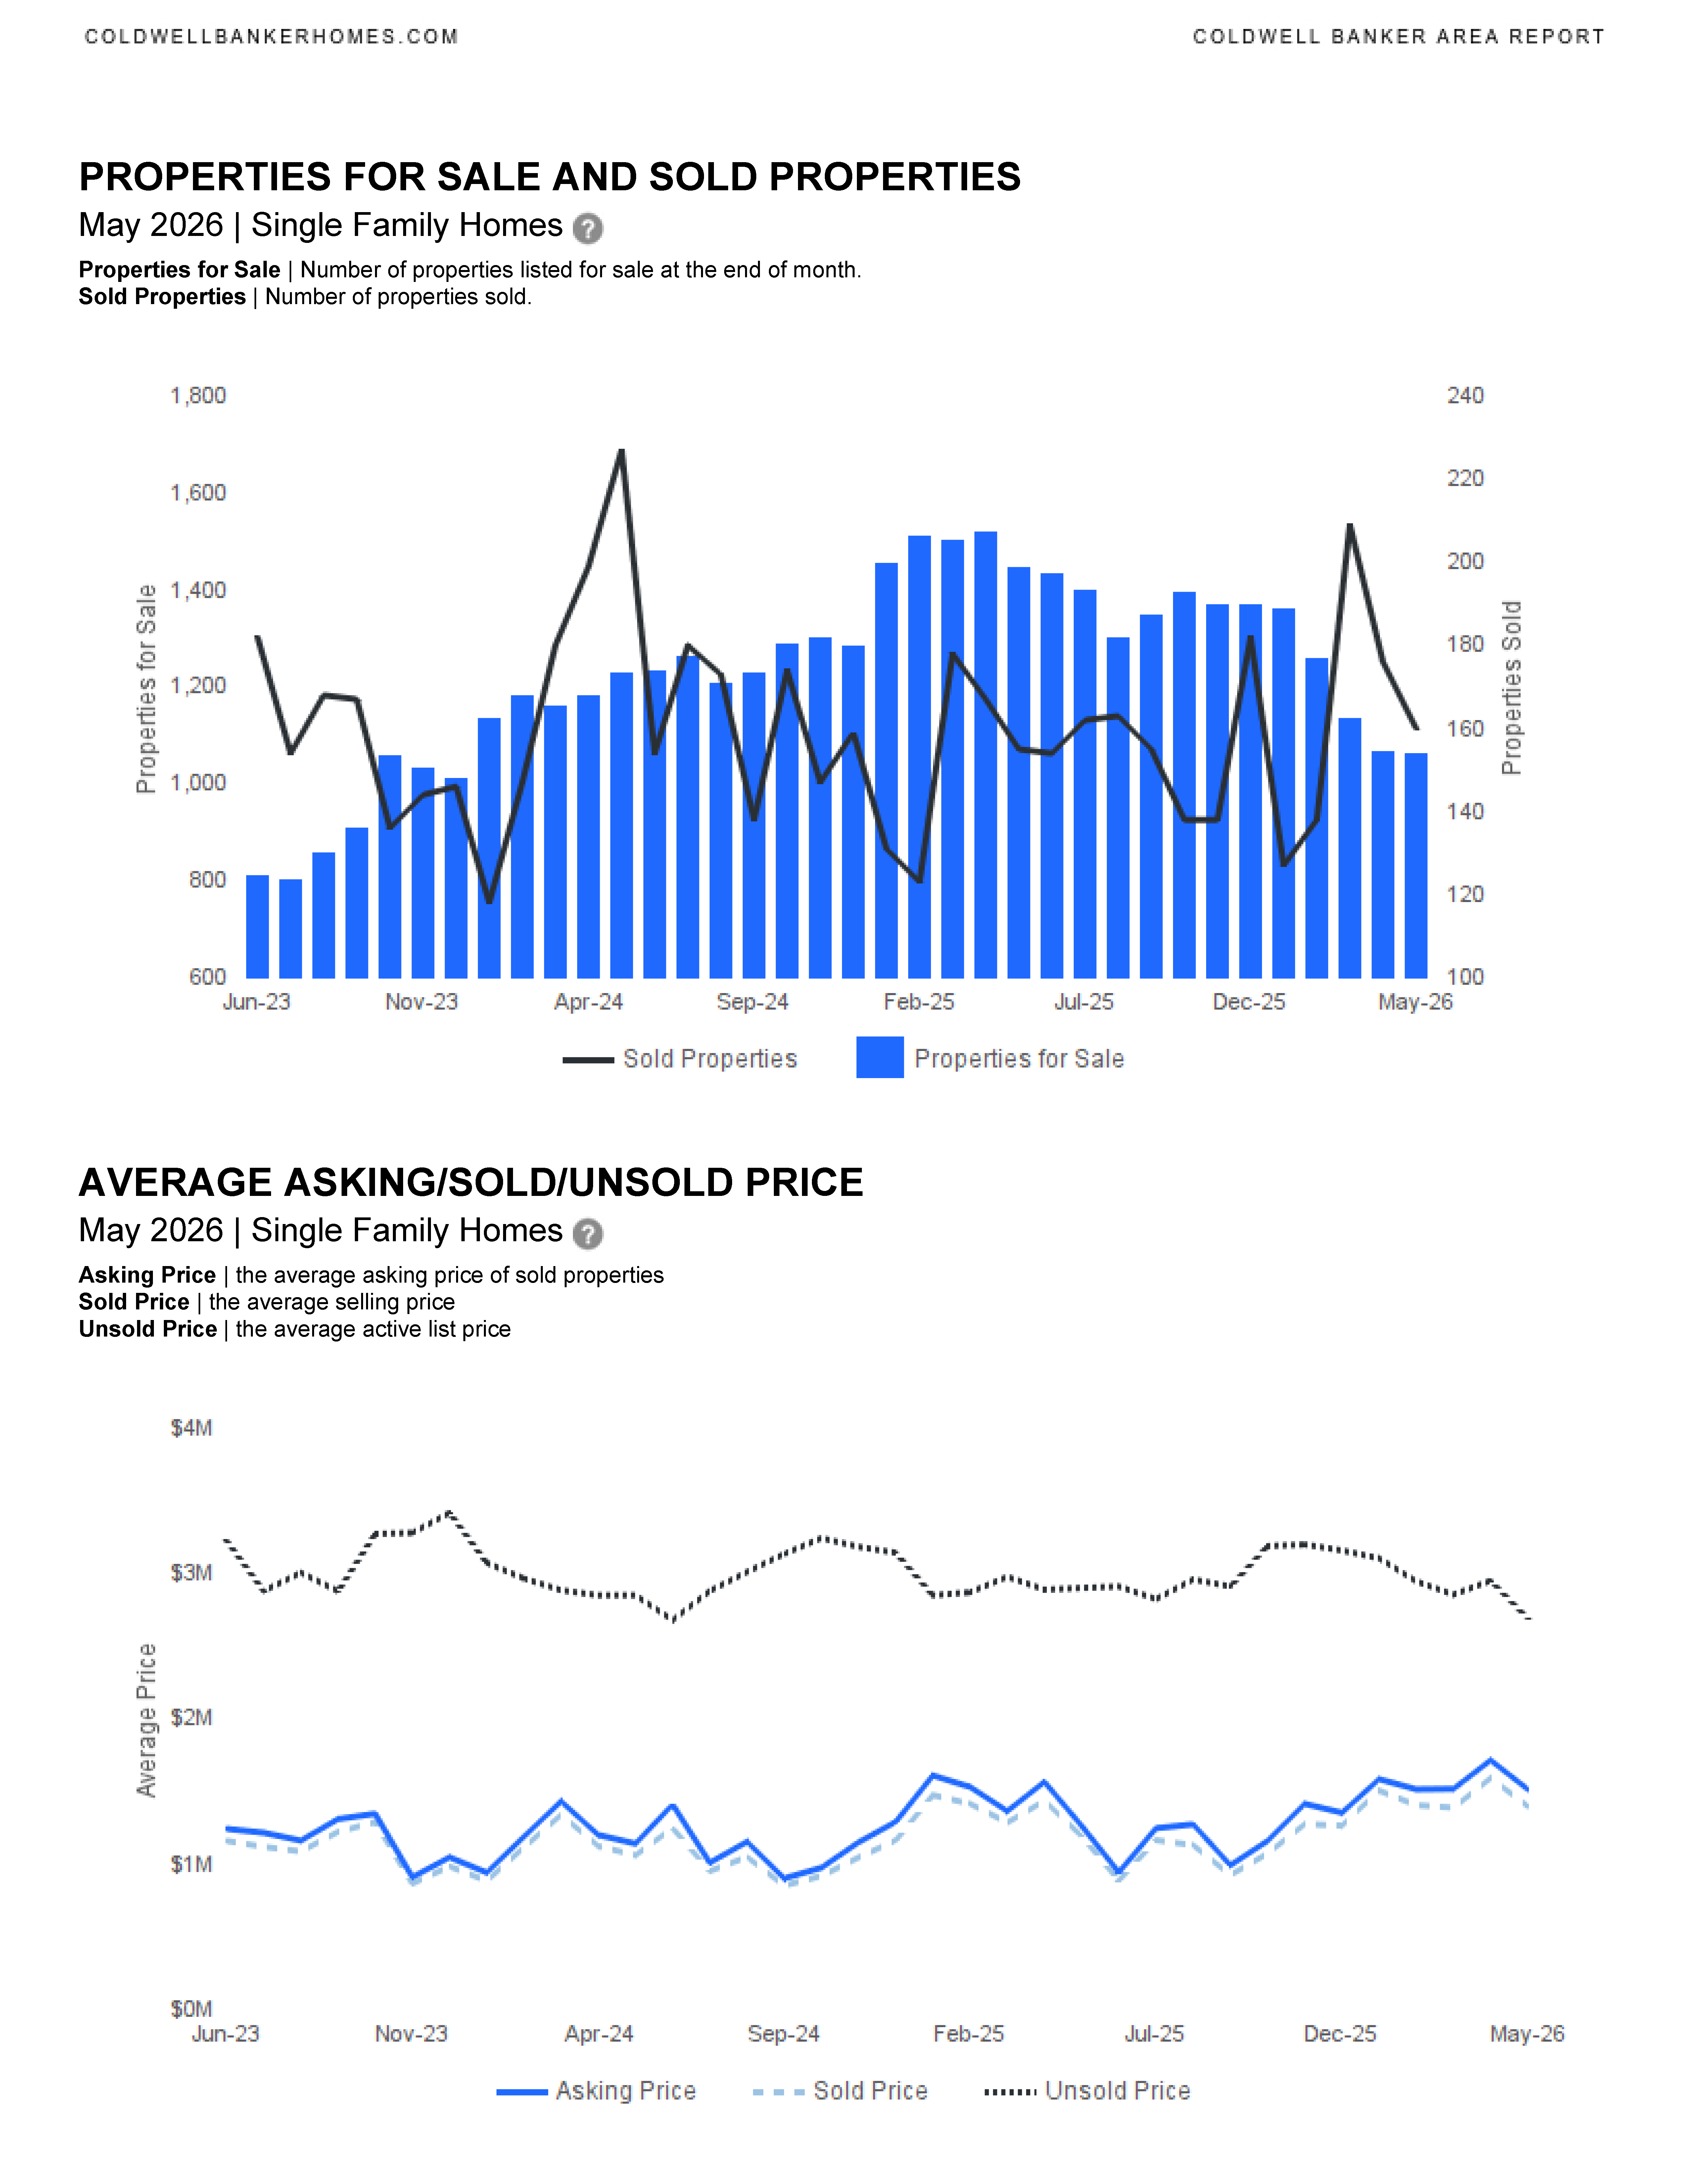
📊 Sales Activity
- Closed sales ↑ 3.23% YoY
- Year-to-date sales ↑ 7.43%
⏳ Market Speed
- Median days on market ↑ 41.46% (58 days)
- Average days on market ↑ 7.5% (86 days)
💰 Pricing Behavior
- List-to-sale ratio ~94.3% (slightly down YoY)
🏢 Condos & Townhouses – May 2026 Highlights
(Fort Lauderdale)
📉 Price Trends
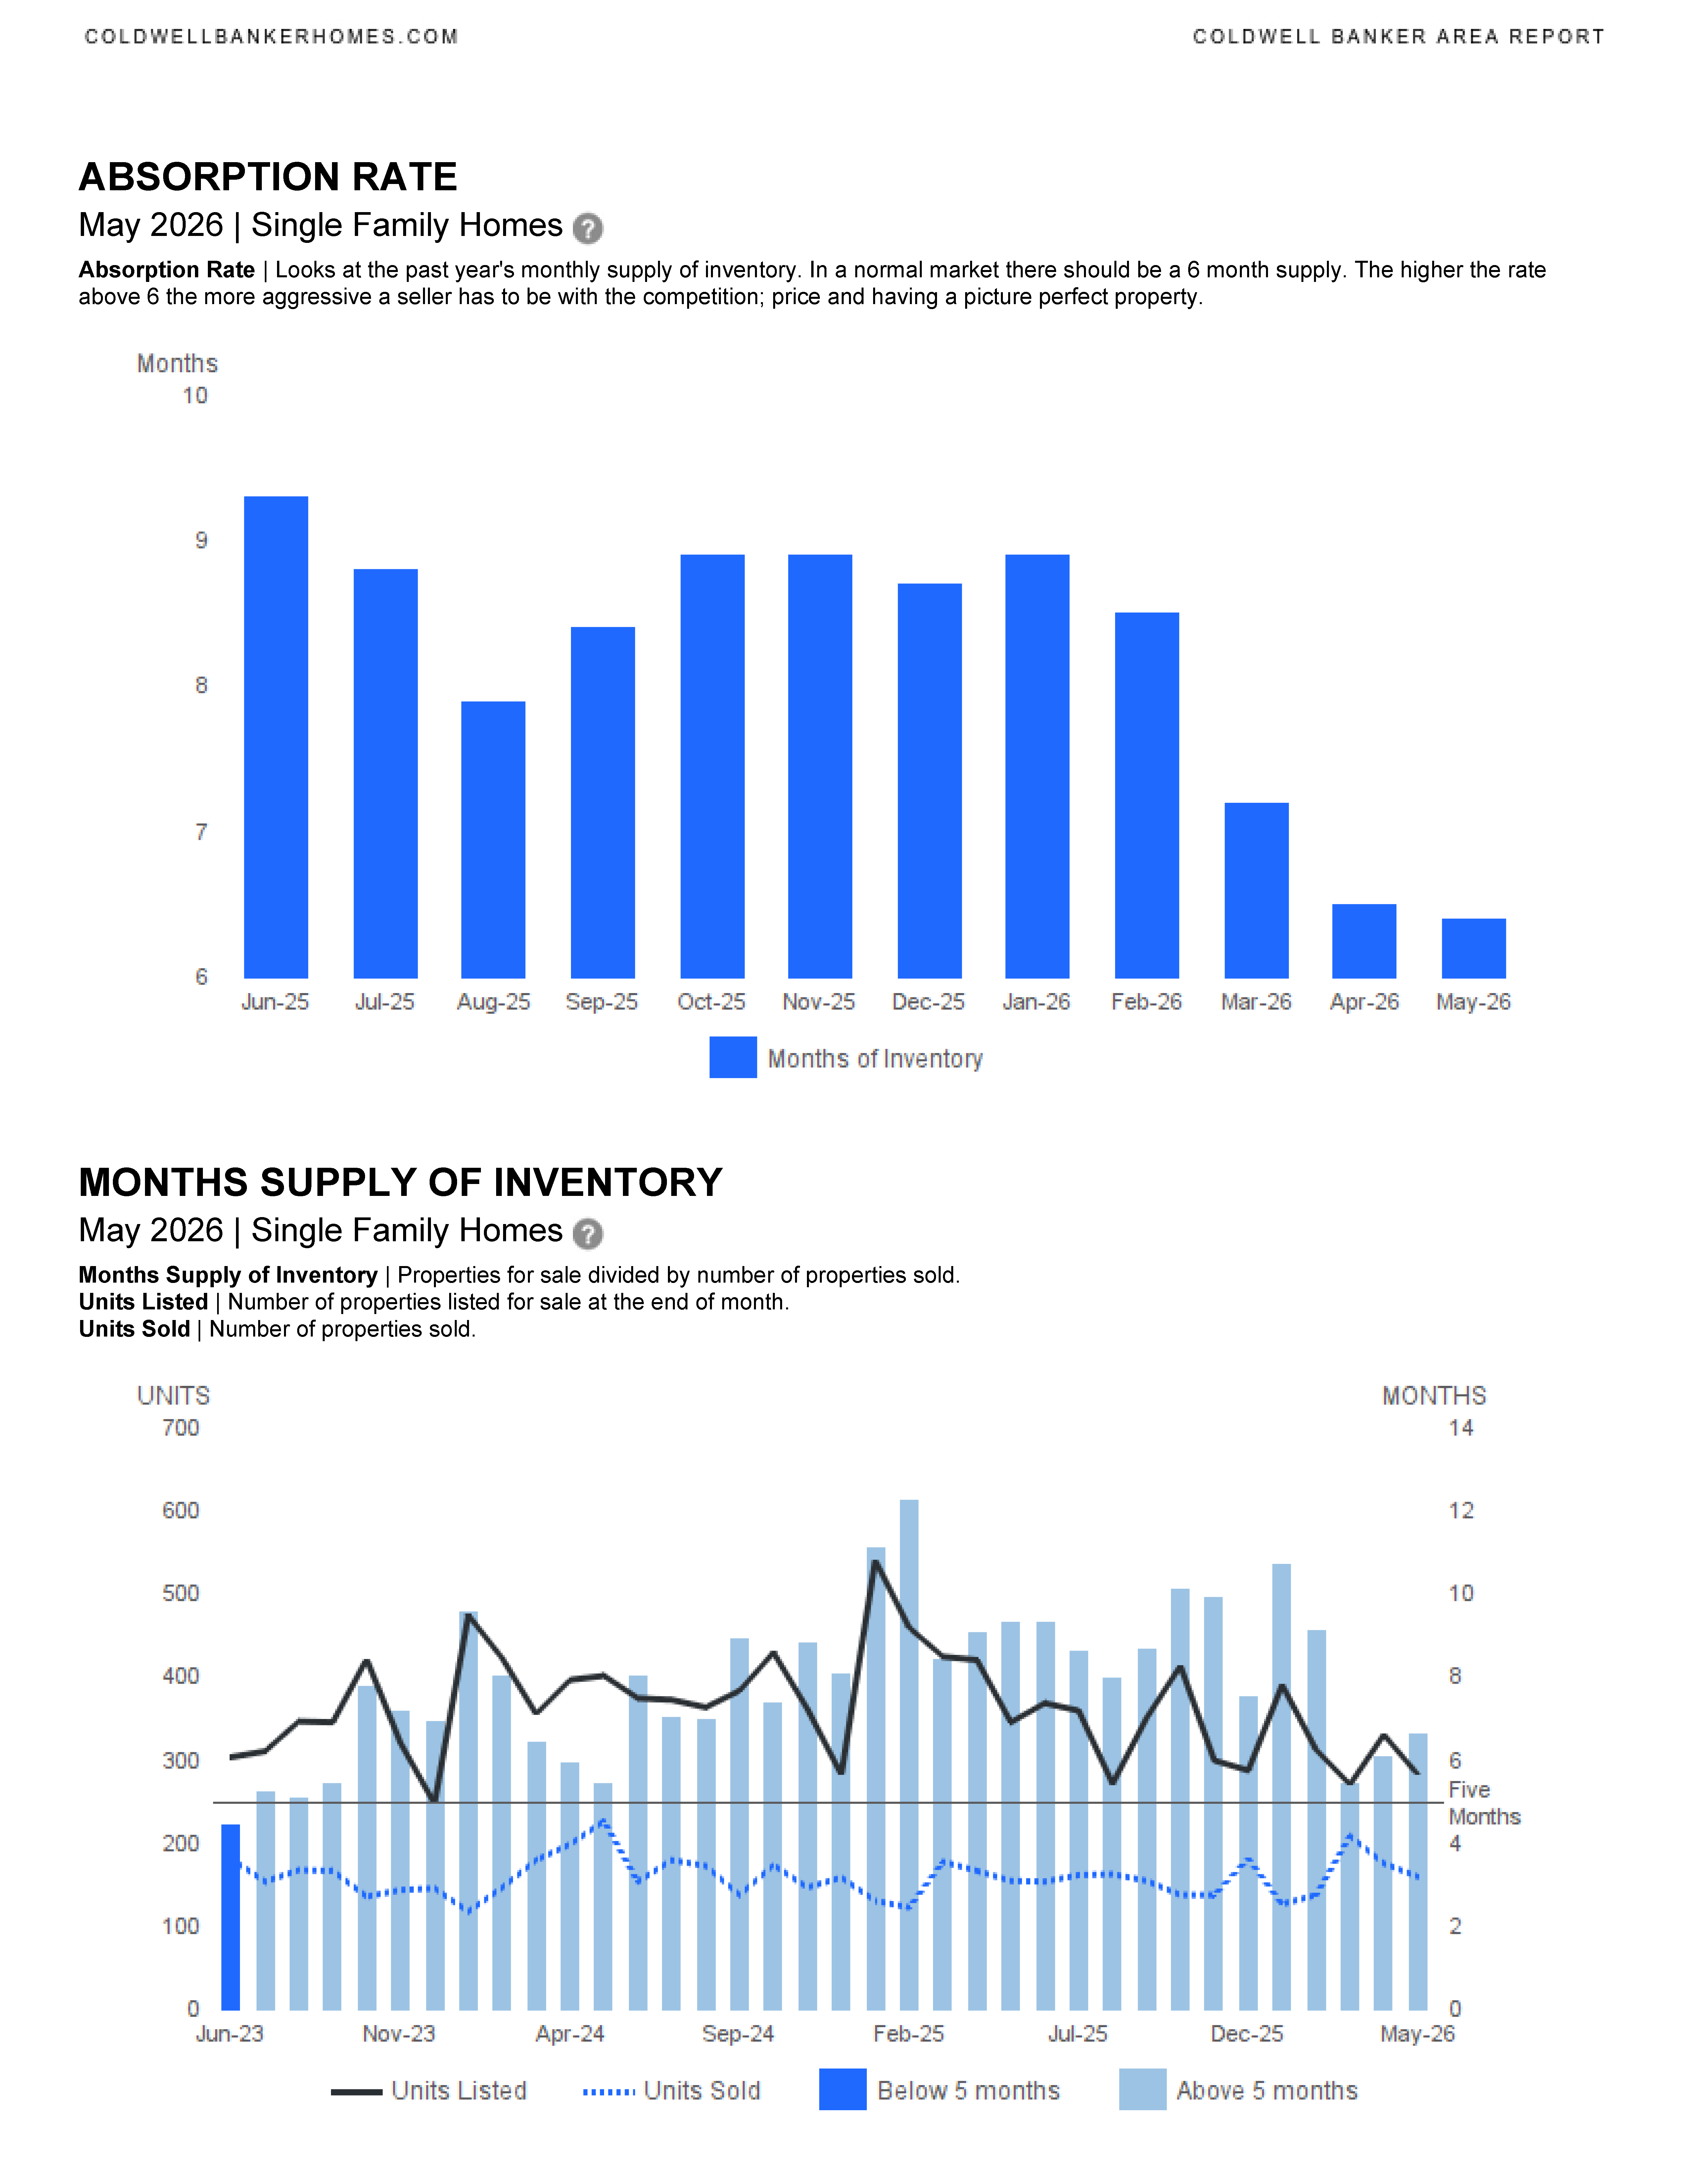
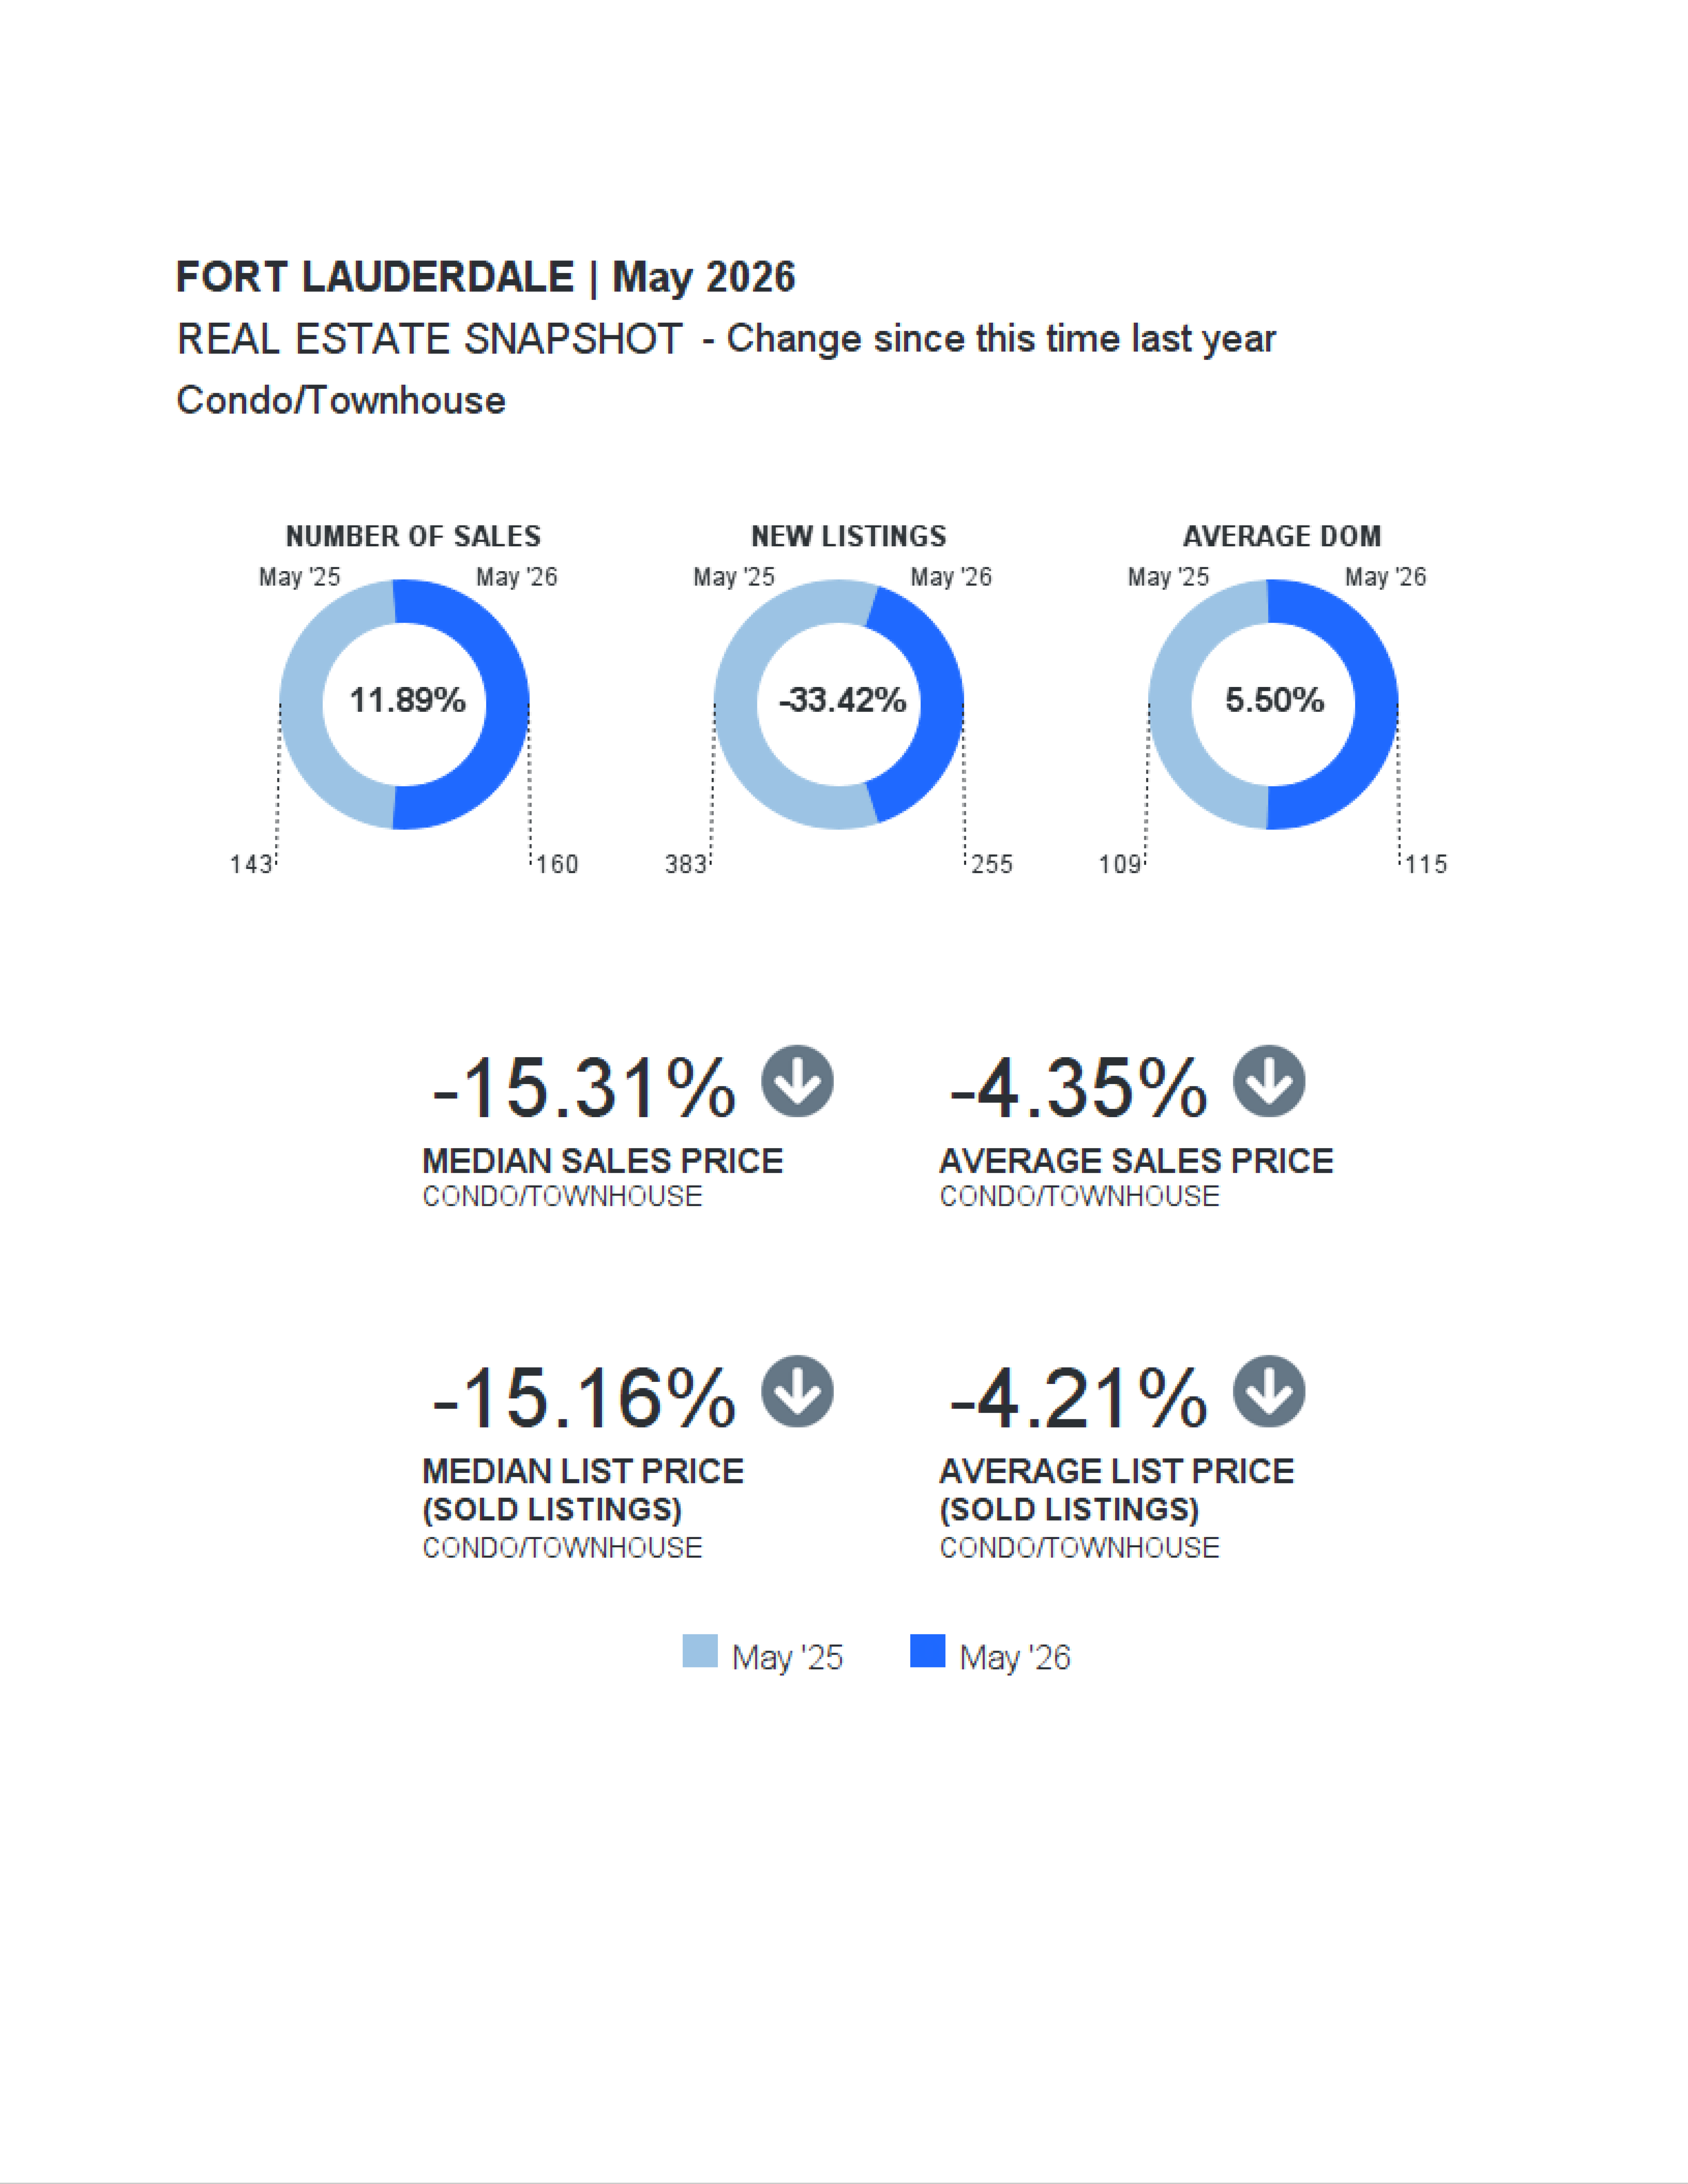
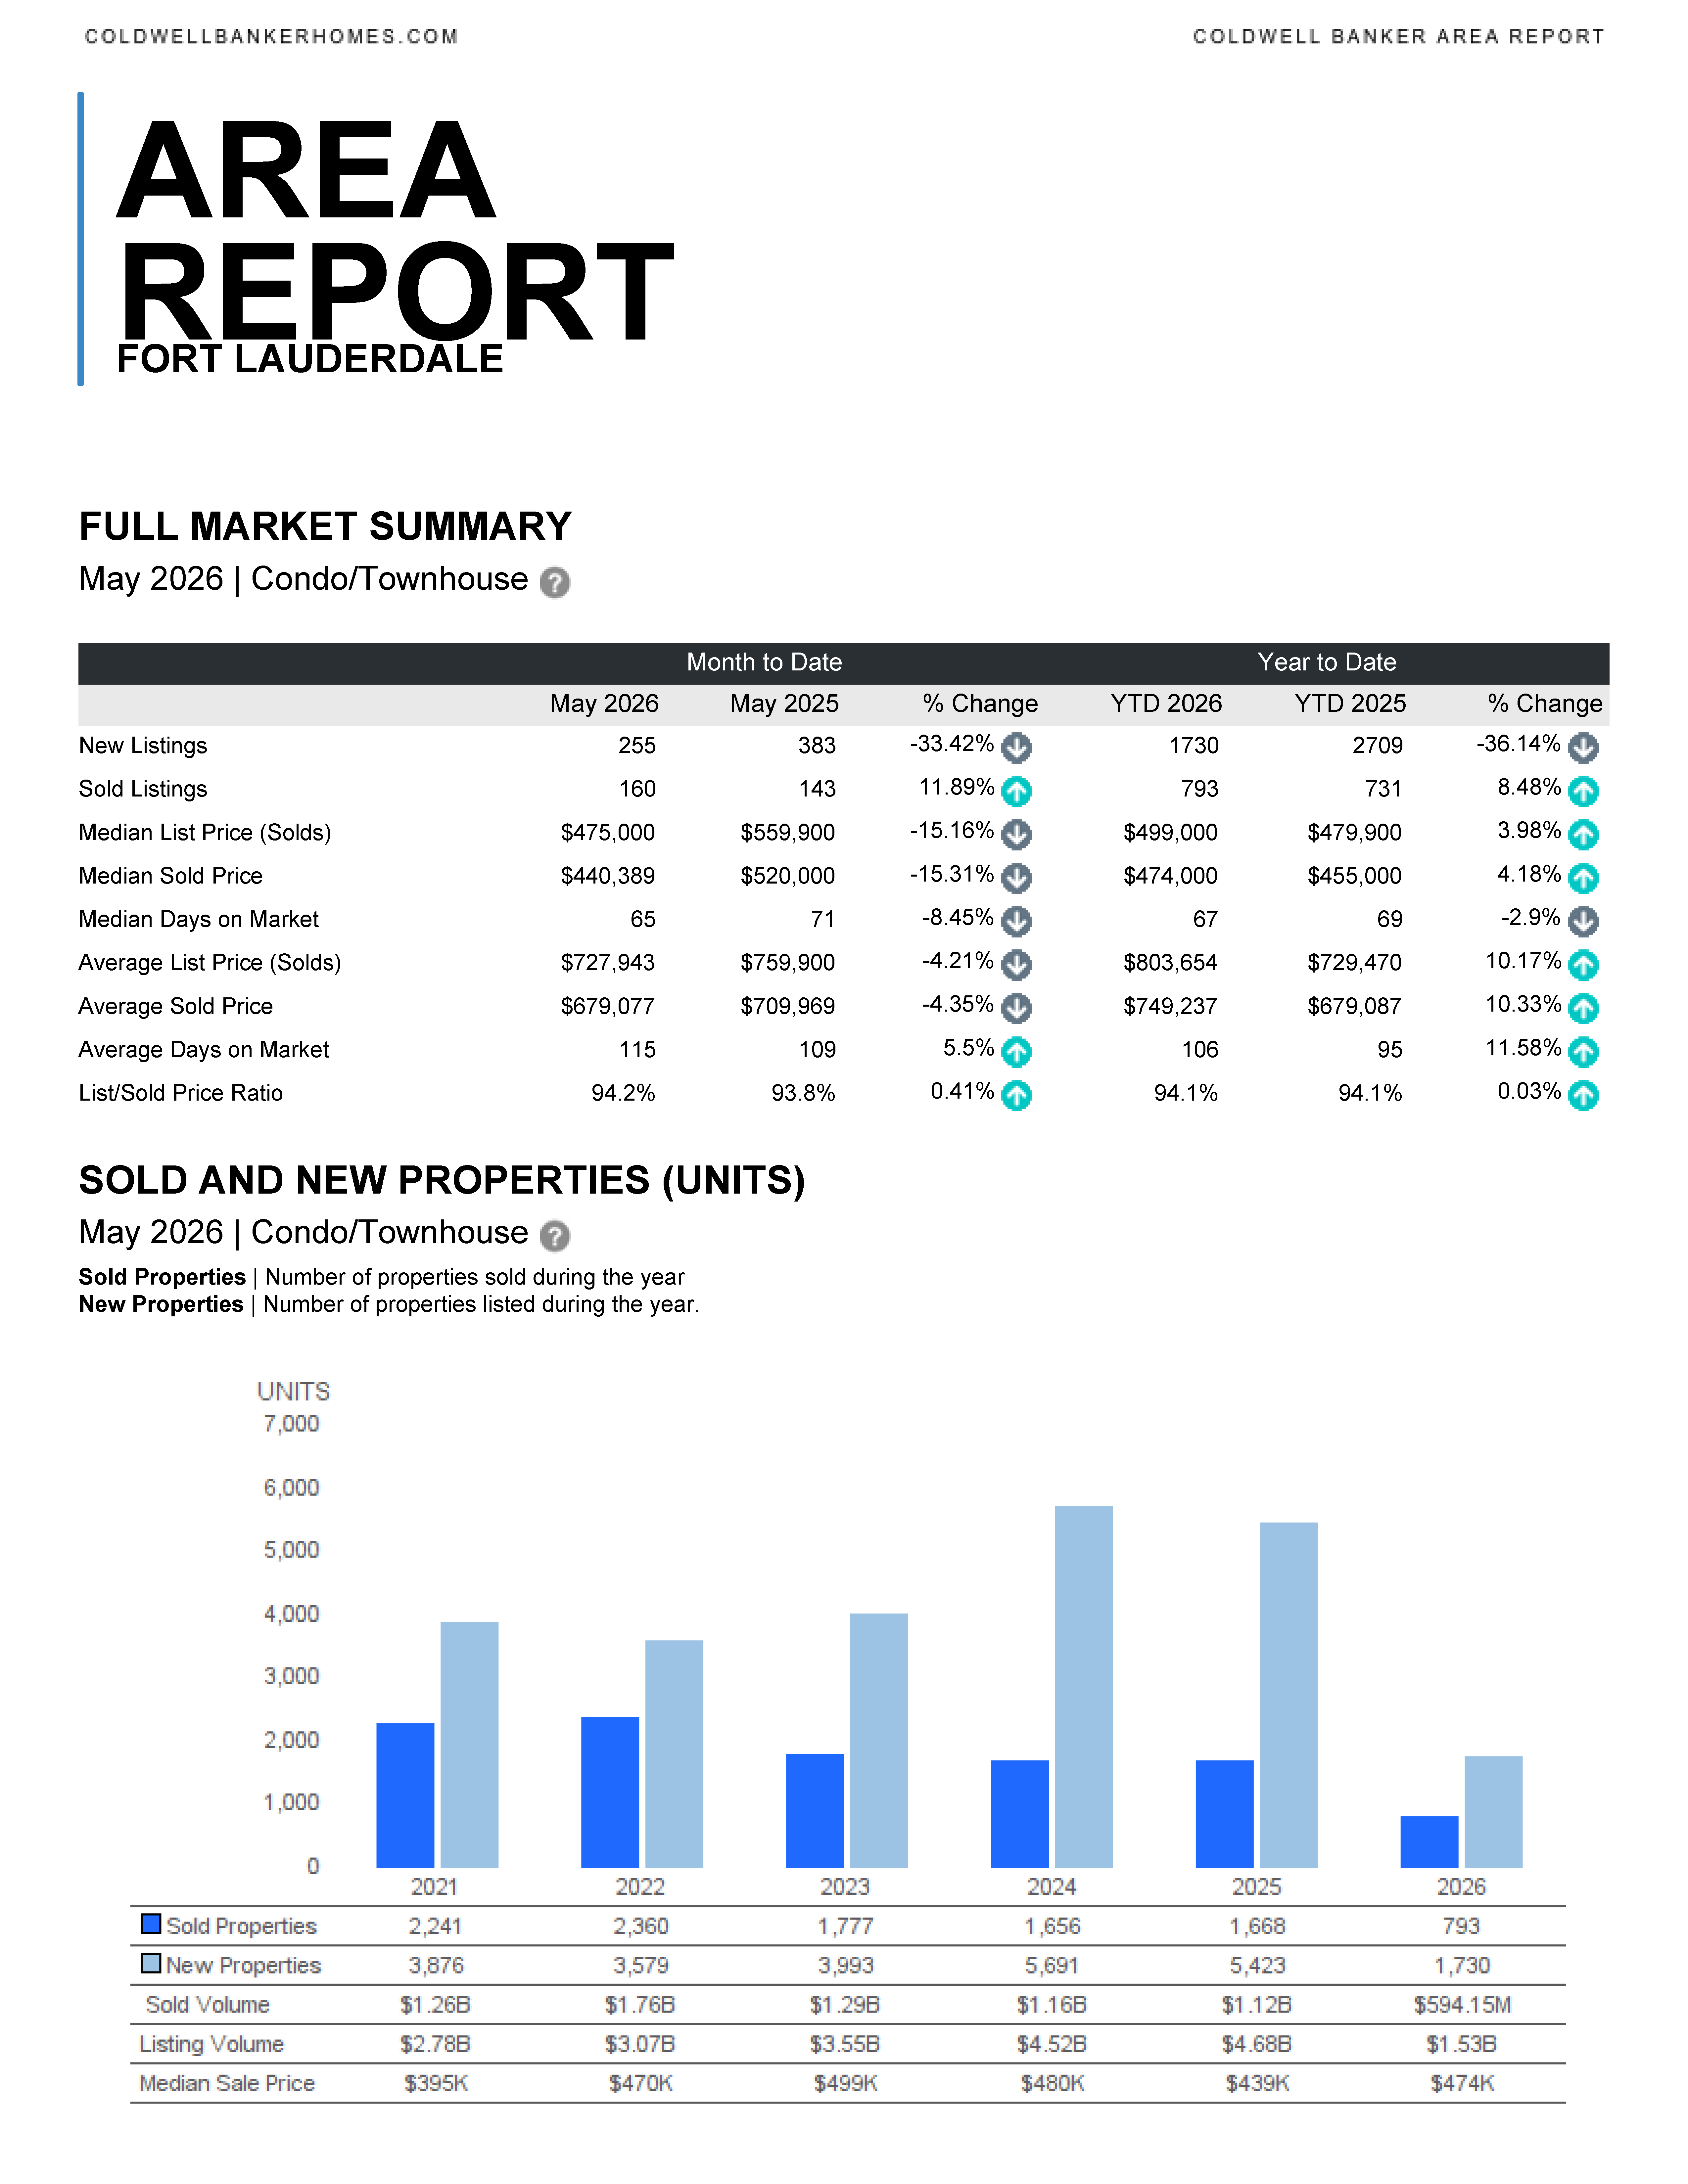
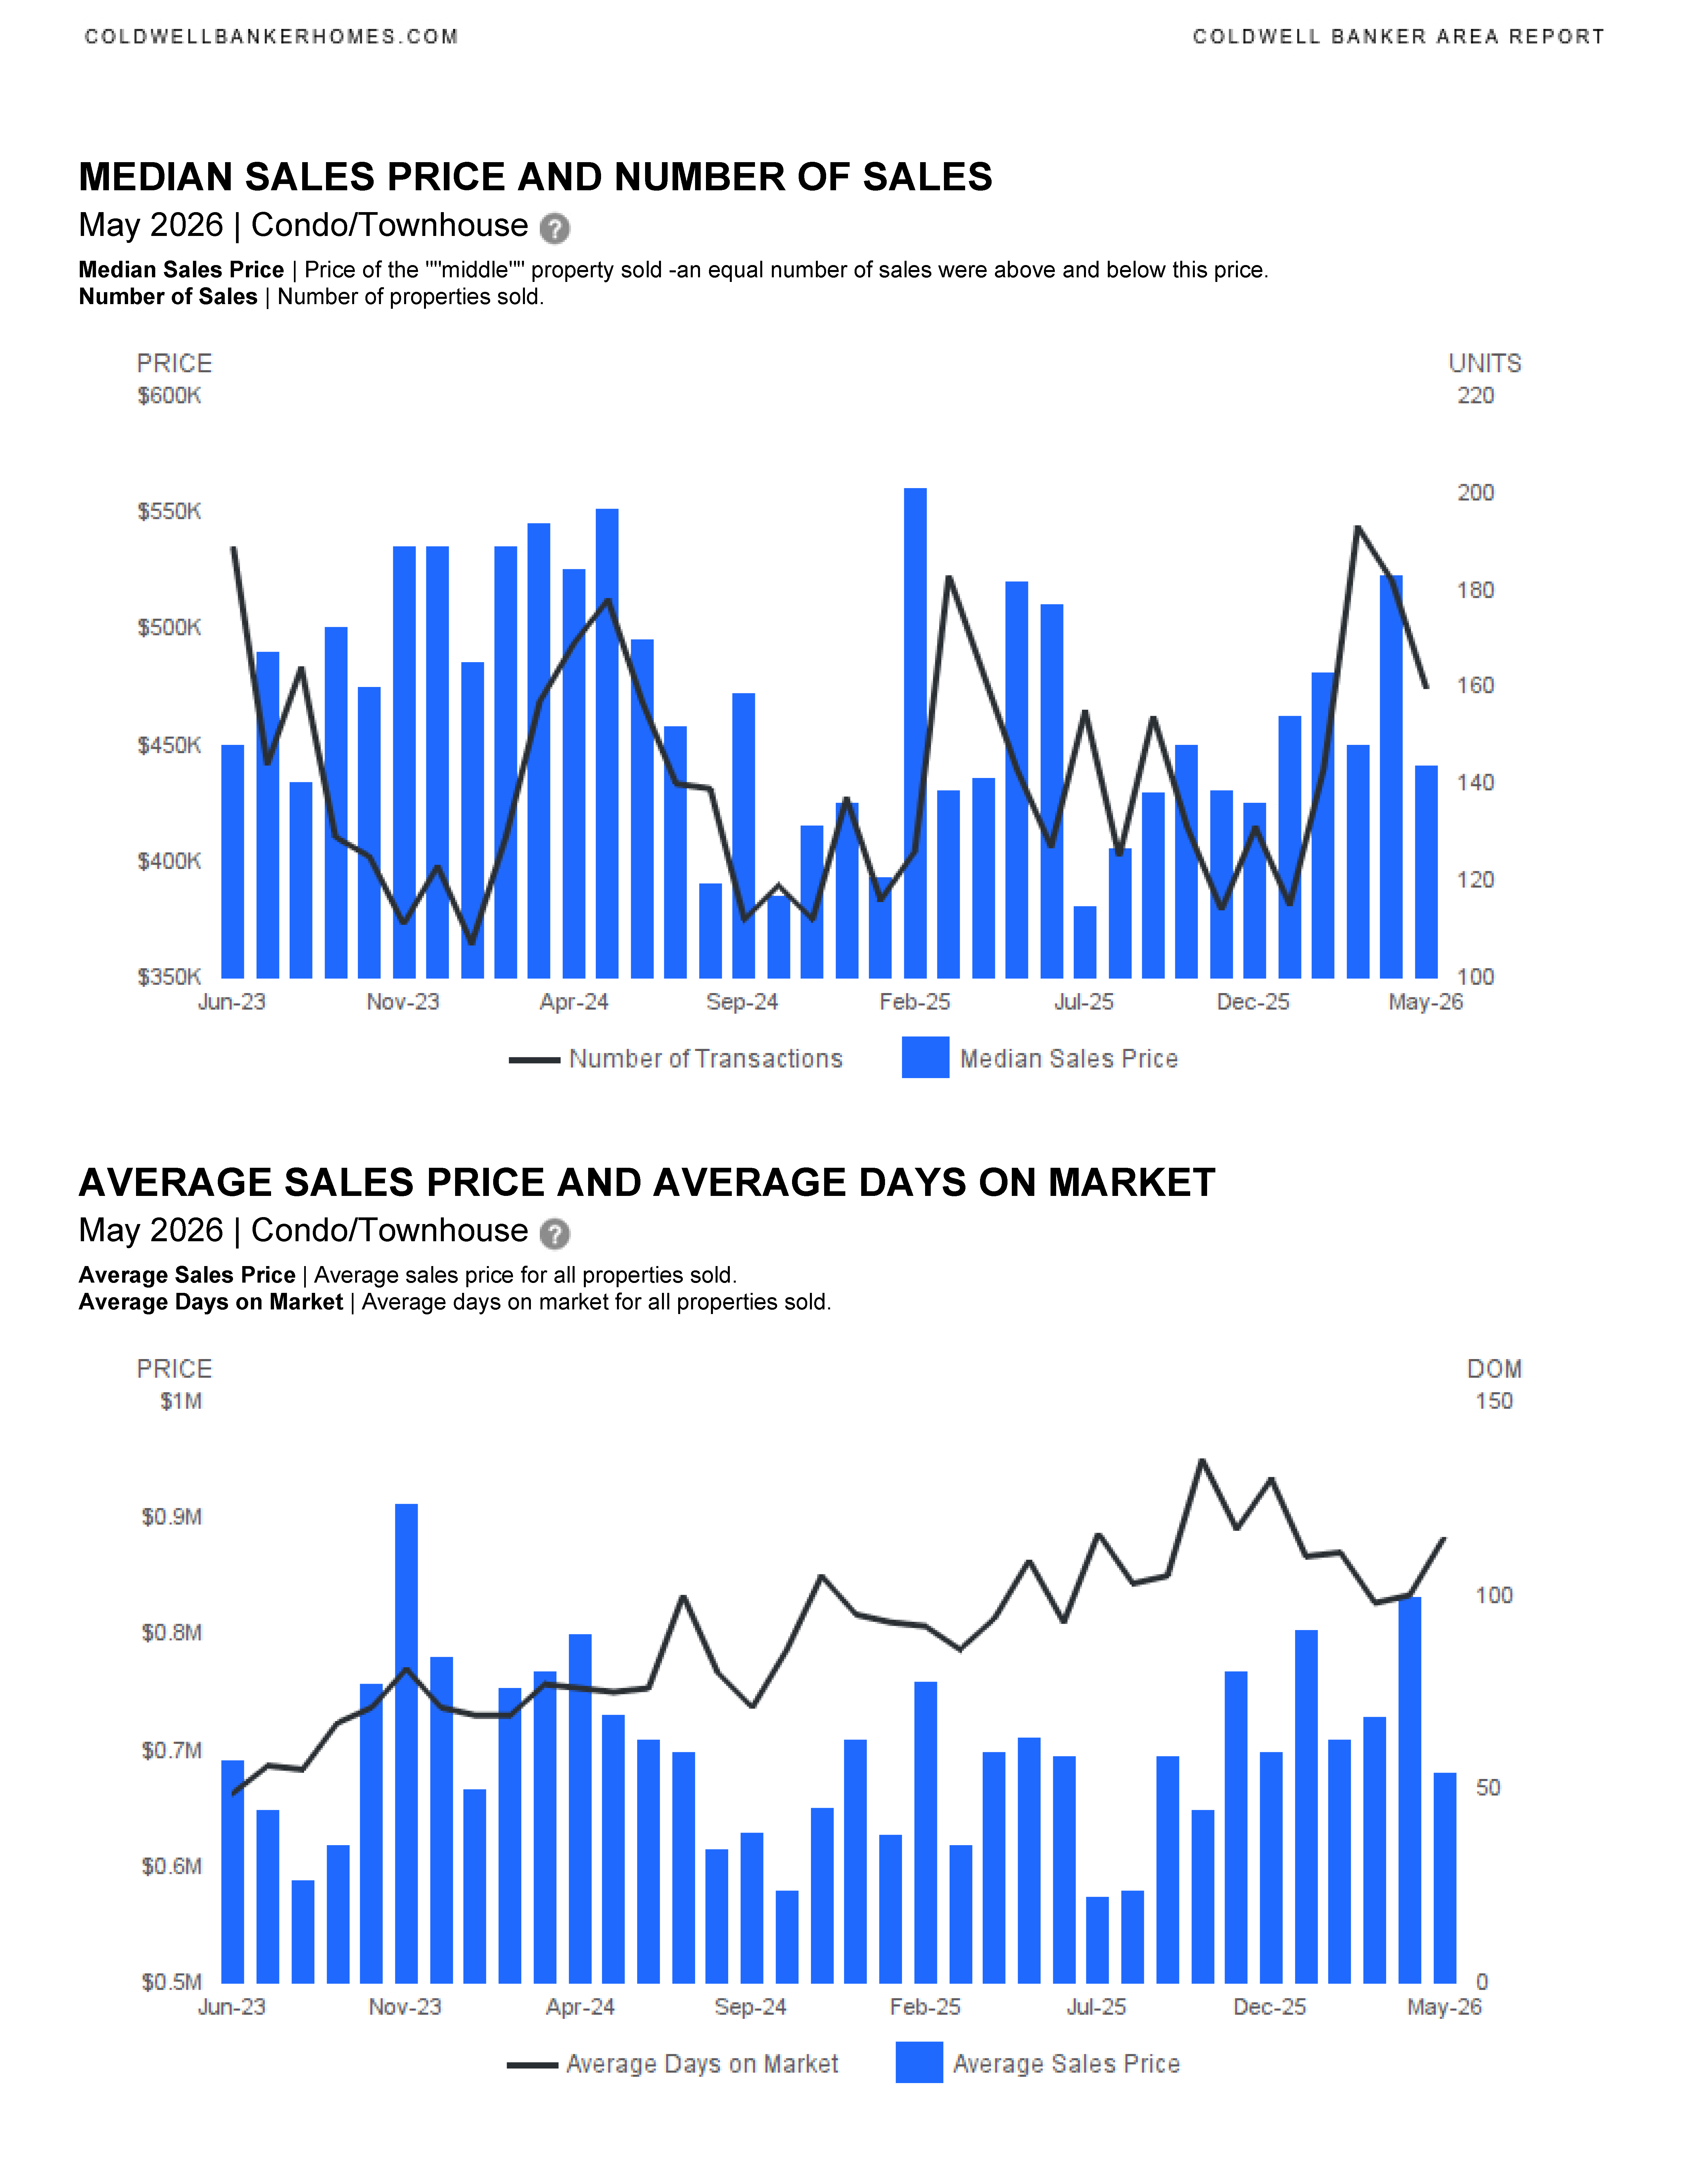
- Median sales price ↓ 15.31% YoY to ~$440K
- Average sales price ↓ 4.35%
- Median list price (sold units) ↓ 15.16%
- Average list price ↓ 4.21%
📉 Inventory & Supply
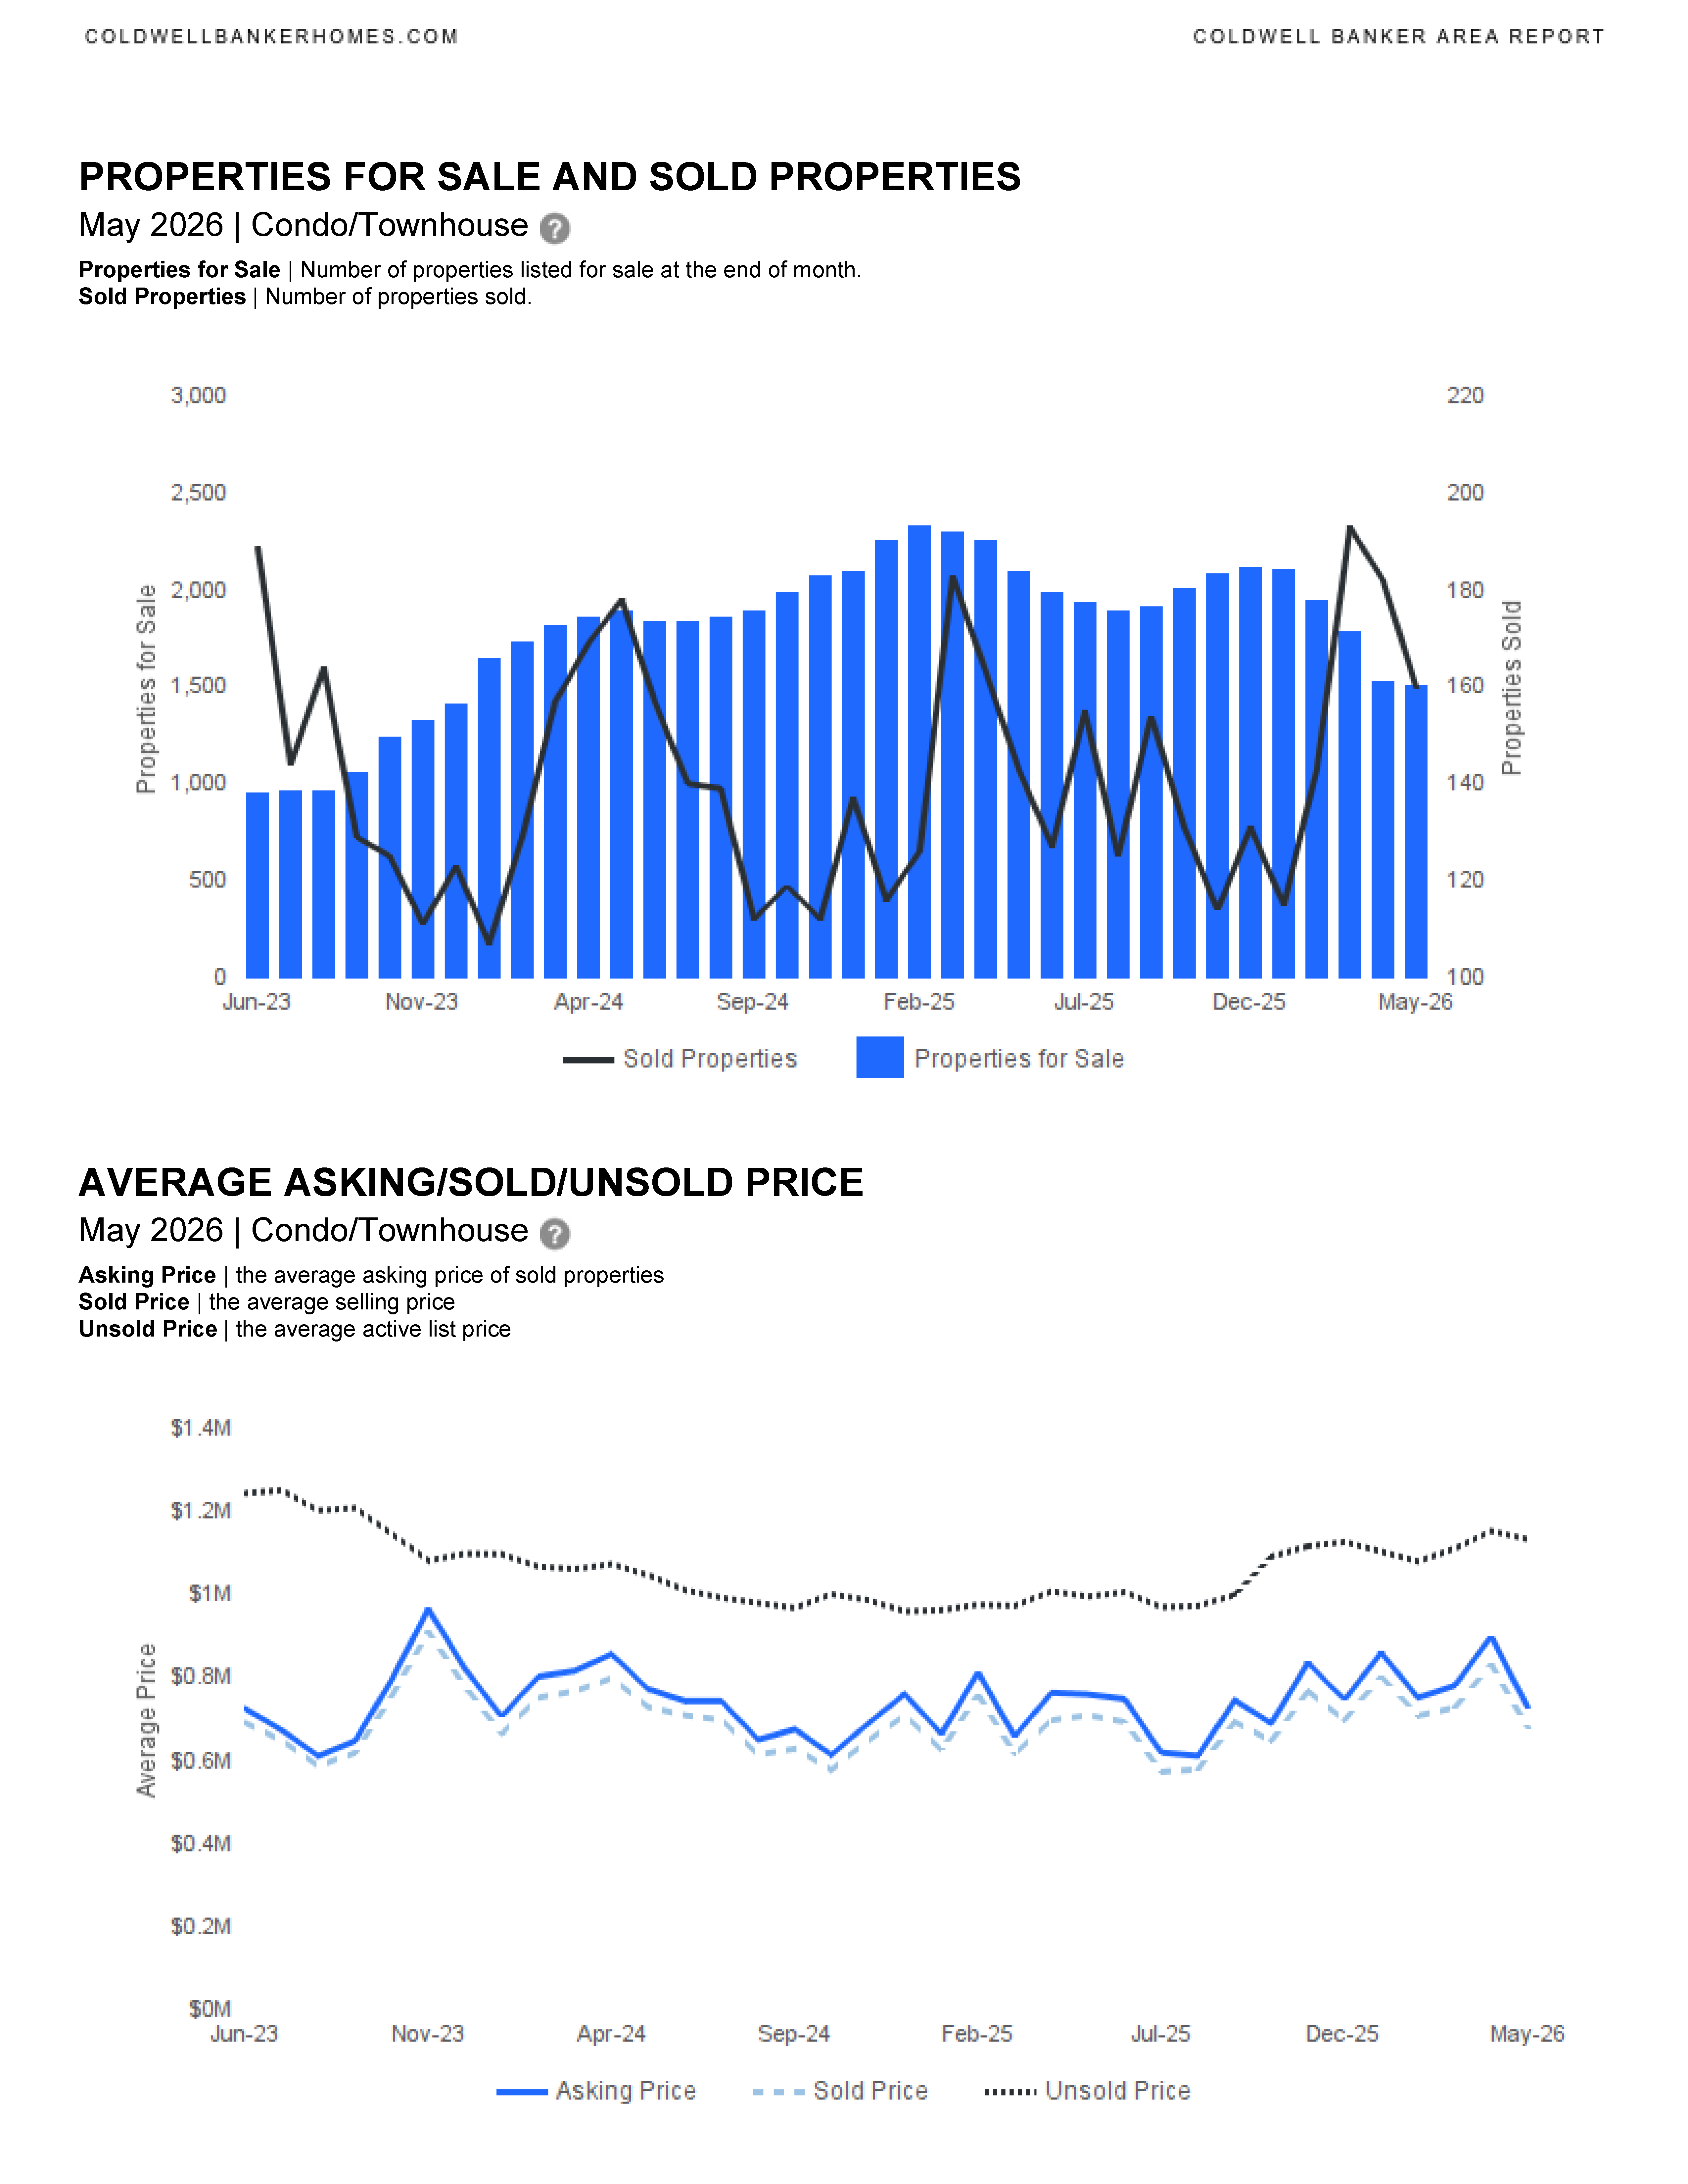
- New listings ↓ 33.42% YoY
- Year-to-date new listings ↓ 36.14%
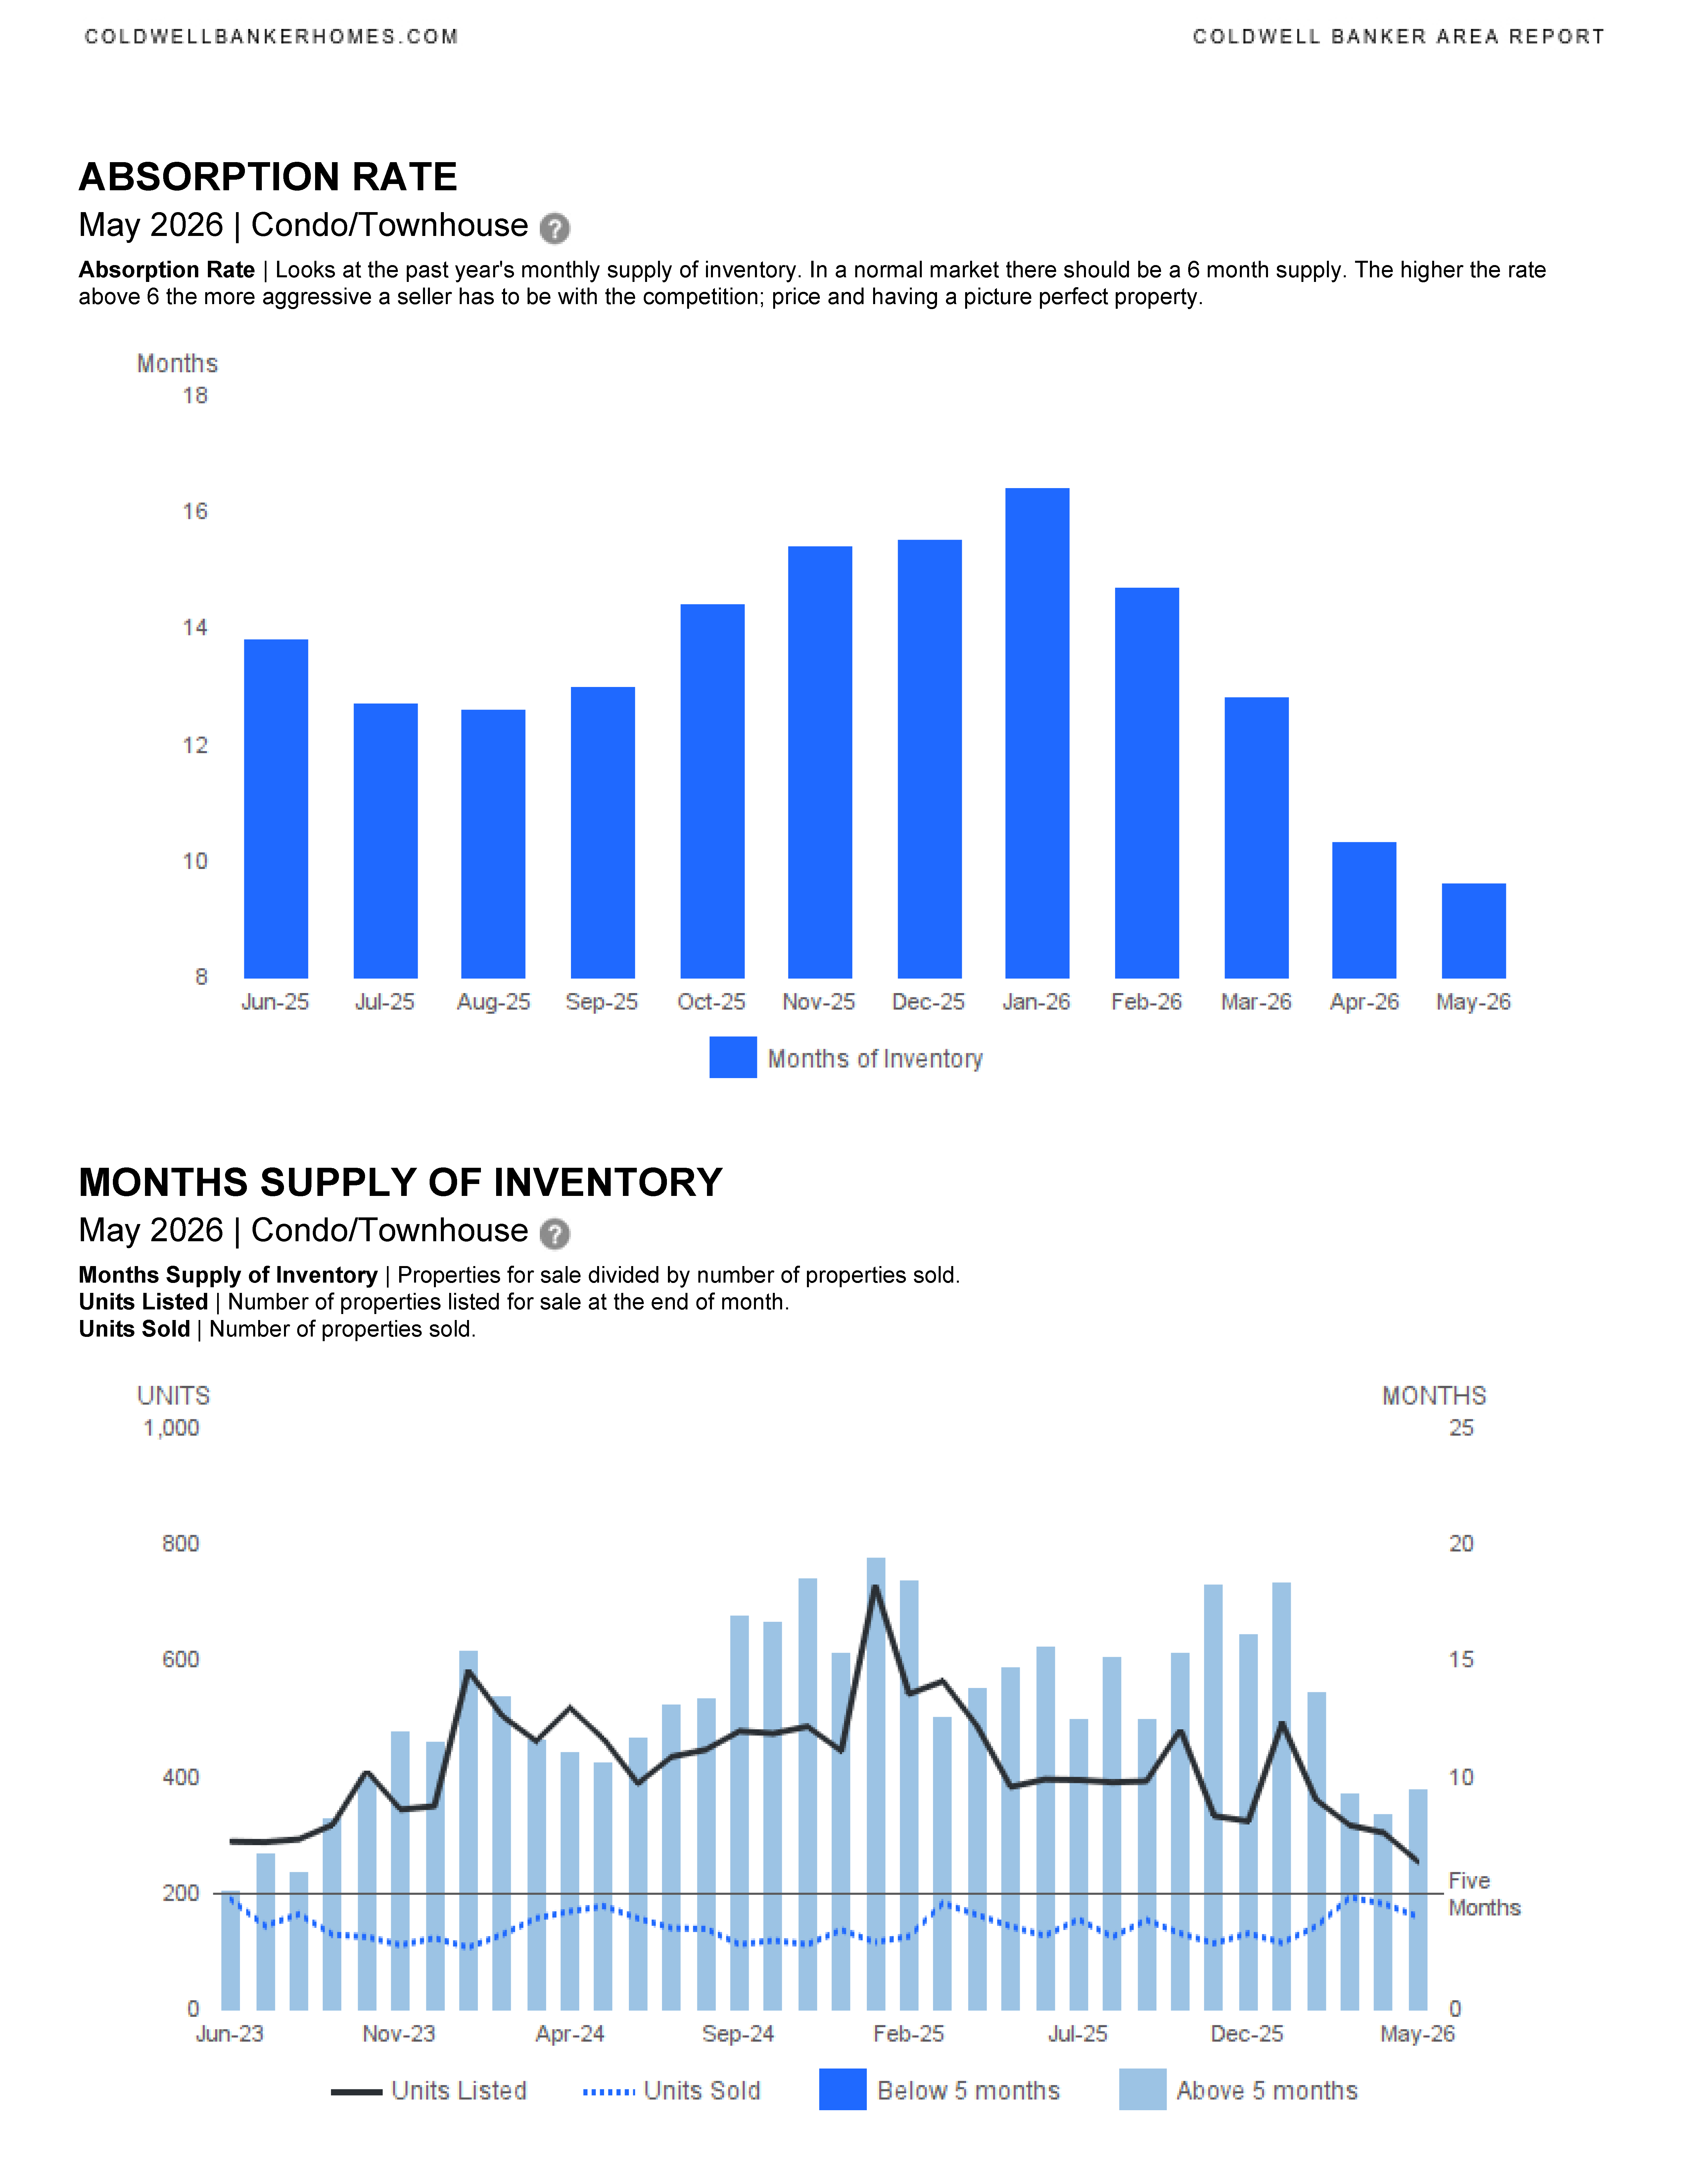
- Months of inventory remains elevated (~9–10 months range)
📊 Sales Activity
- Closed sales ↑ 11.89% YoY
- Year-to-date sales ↑ 8.48%
⏳ Market Speed
- Median days on market ↓ 8.45% (65 days)
- Average days on market ↑ 5.5% (115 days)
💰 Pricing Behavior
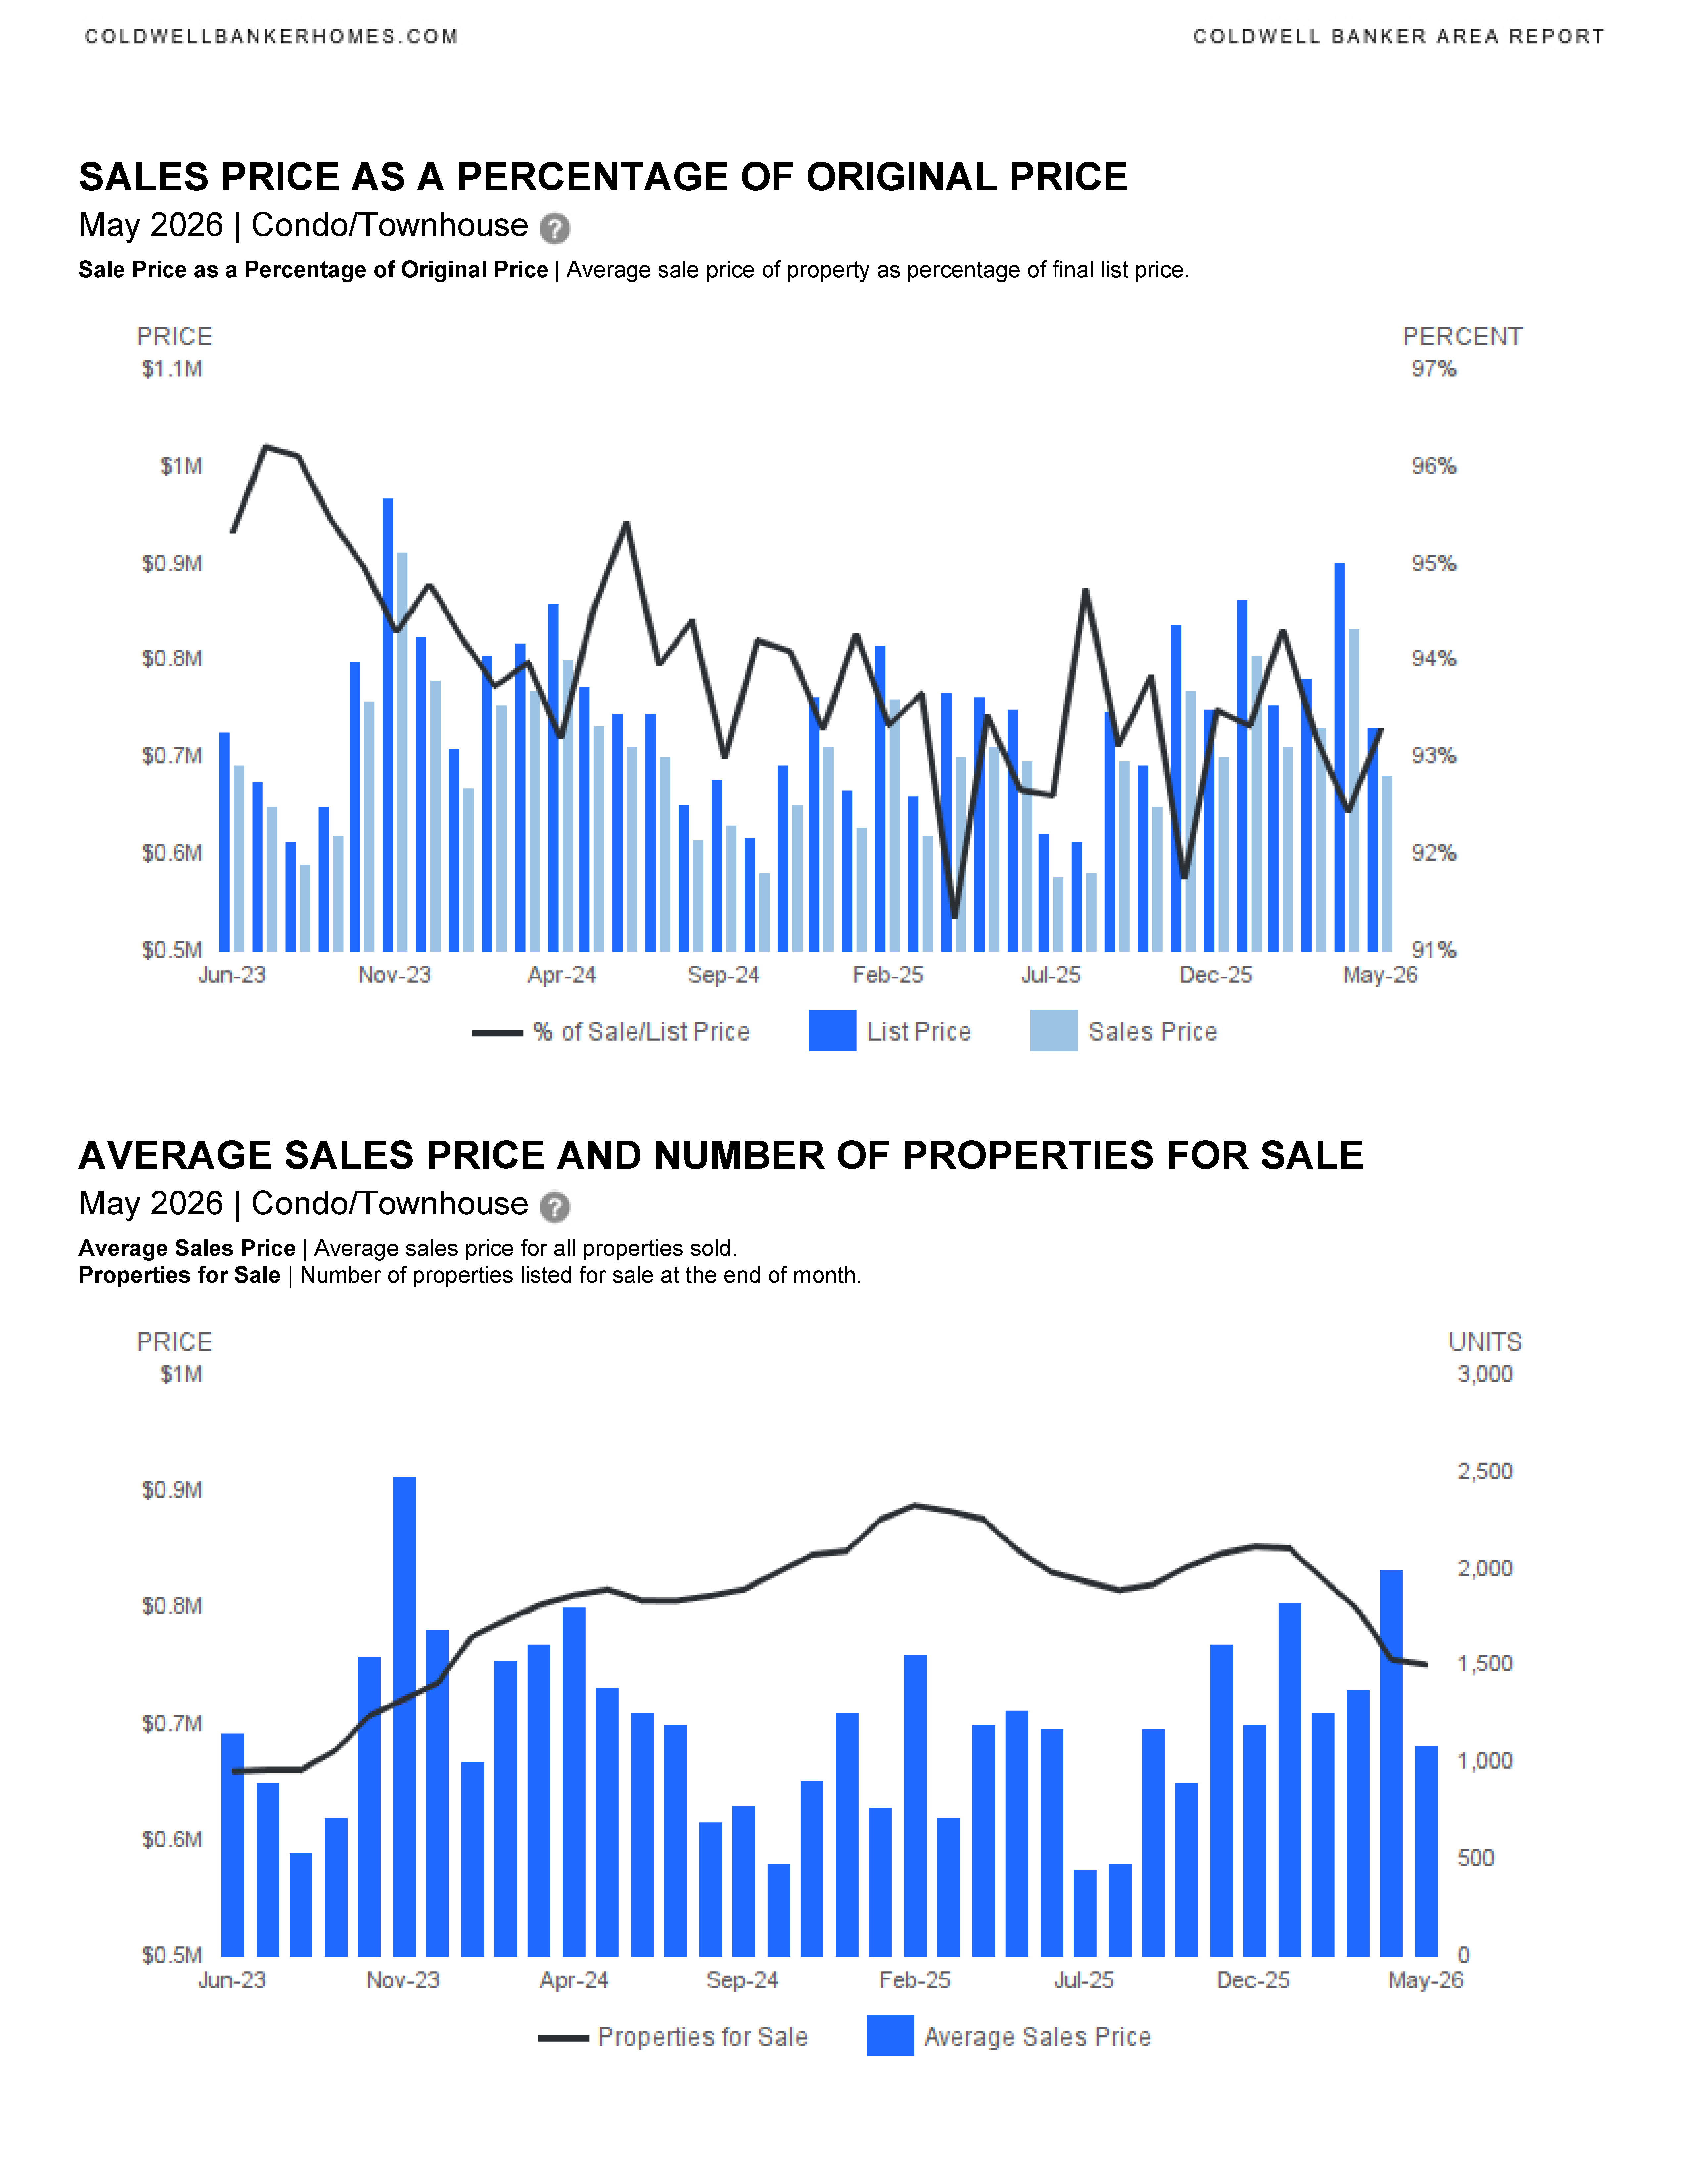
- List-to-sale ratio ~94.2% (slightly improved)
🔑 Key Takeaways (Big Picture)
✅ 1. Two Very Different Markets
- Single-family homes: Prices are rising strongly → seller advantage remains
- Condos/townhomes: Prices are declining → more buyer leverage
✅ 2. Inventory Is Driving the Split
- Single-family inventory is tight (fewer new listings) → pushing prices up
- Condo inventory remains higher and more competitive → putting pressure on prices
✅ 3. Buyers Are Still Active
- Sales are up in both segments
- Even with higher rates and pricing shifts, demand hasn’t disappeared
✅ 4. Market Pace Is Normalizing
- Homes are taking longer to sell overall
- Indicates a shift away from the ultra-fast pandemic market to a more balanced environment
✅ 5. Pricing Strategy Matters More Than Ever
- Both markets show ~94% list-to-sale ratios
- Buyers are negotiating → accurate pricing is critical for sellers
🧭 Your Positioning Insight
- 🏡 Single-family market:
“Still strong—but strategic pricing and presentation are key as buyers become more selective.” - 🏢 Condo market:
“Opportunities for buyers are emerging, especially with motivated sellers and softer pricing.”


In today’s competitive SE Florida housing market, it’s essential to work with an experienced and knowledgeable real estate professional. If you’d like up‑to‑date market reports for your neighborhood, Fort Lauderdale, or any other SE Florida community, I’d be happy to send them. We can review current trends, discuss the market, and explore how we can work together to achieve your real estate goals. I’m here to support you every step of the way.
CONTACT ANNETTE
Let’s start working together!

Annette Dammeyer, REALTOR®, ABR®, AHWD®
Coldwell Banker Realty
901 E Las Olas Blvd STE 101, Fort Lauderdale, FL 33301
808.747.3686
SL 3535792

Fort Lauderdale April 2026 Area Report

Fort Lauderdale April 2026 real estate statistics have been published.
Single Family Homes
Condominium & Townhouses
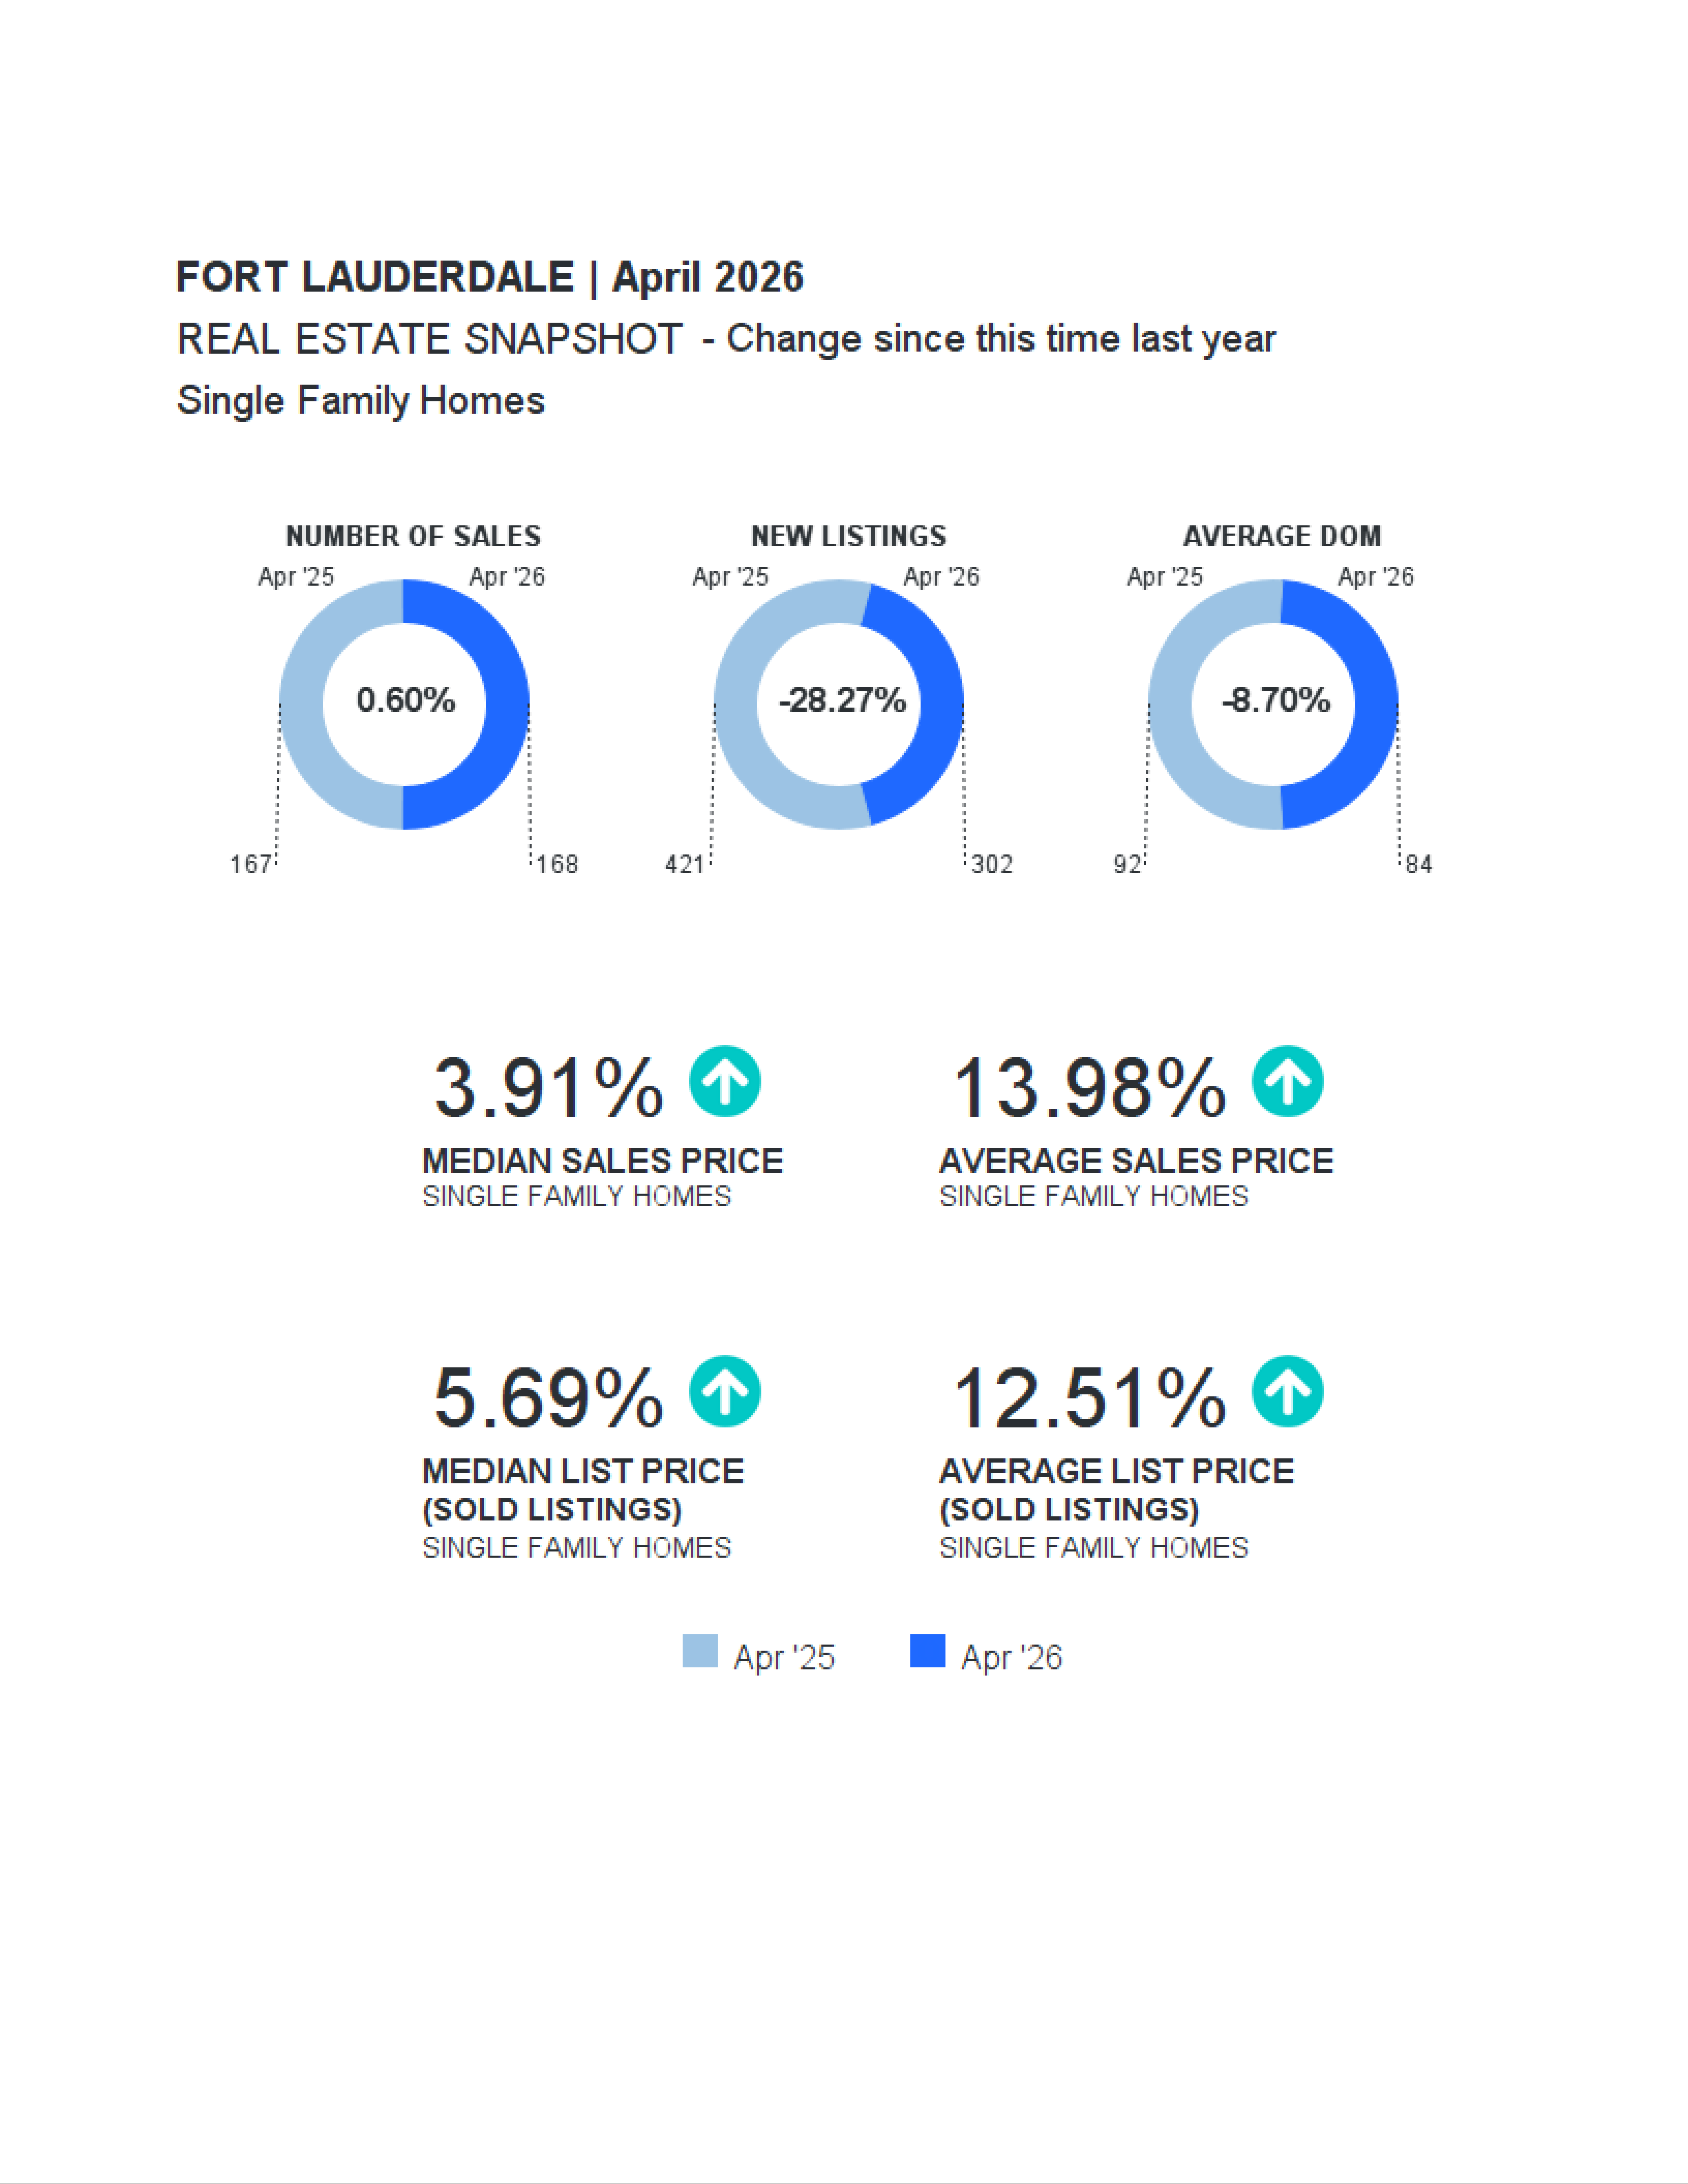
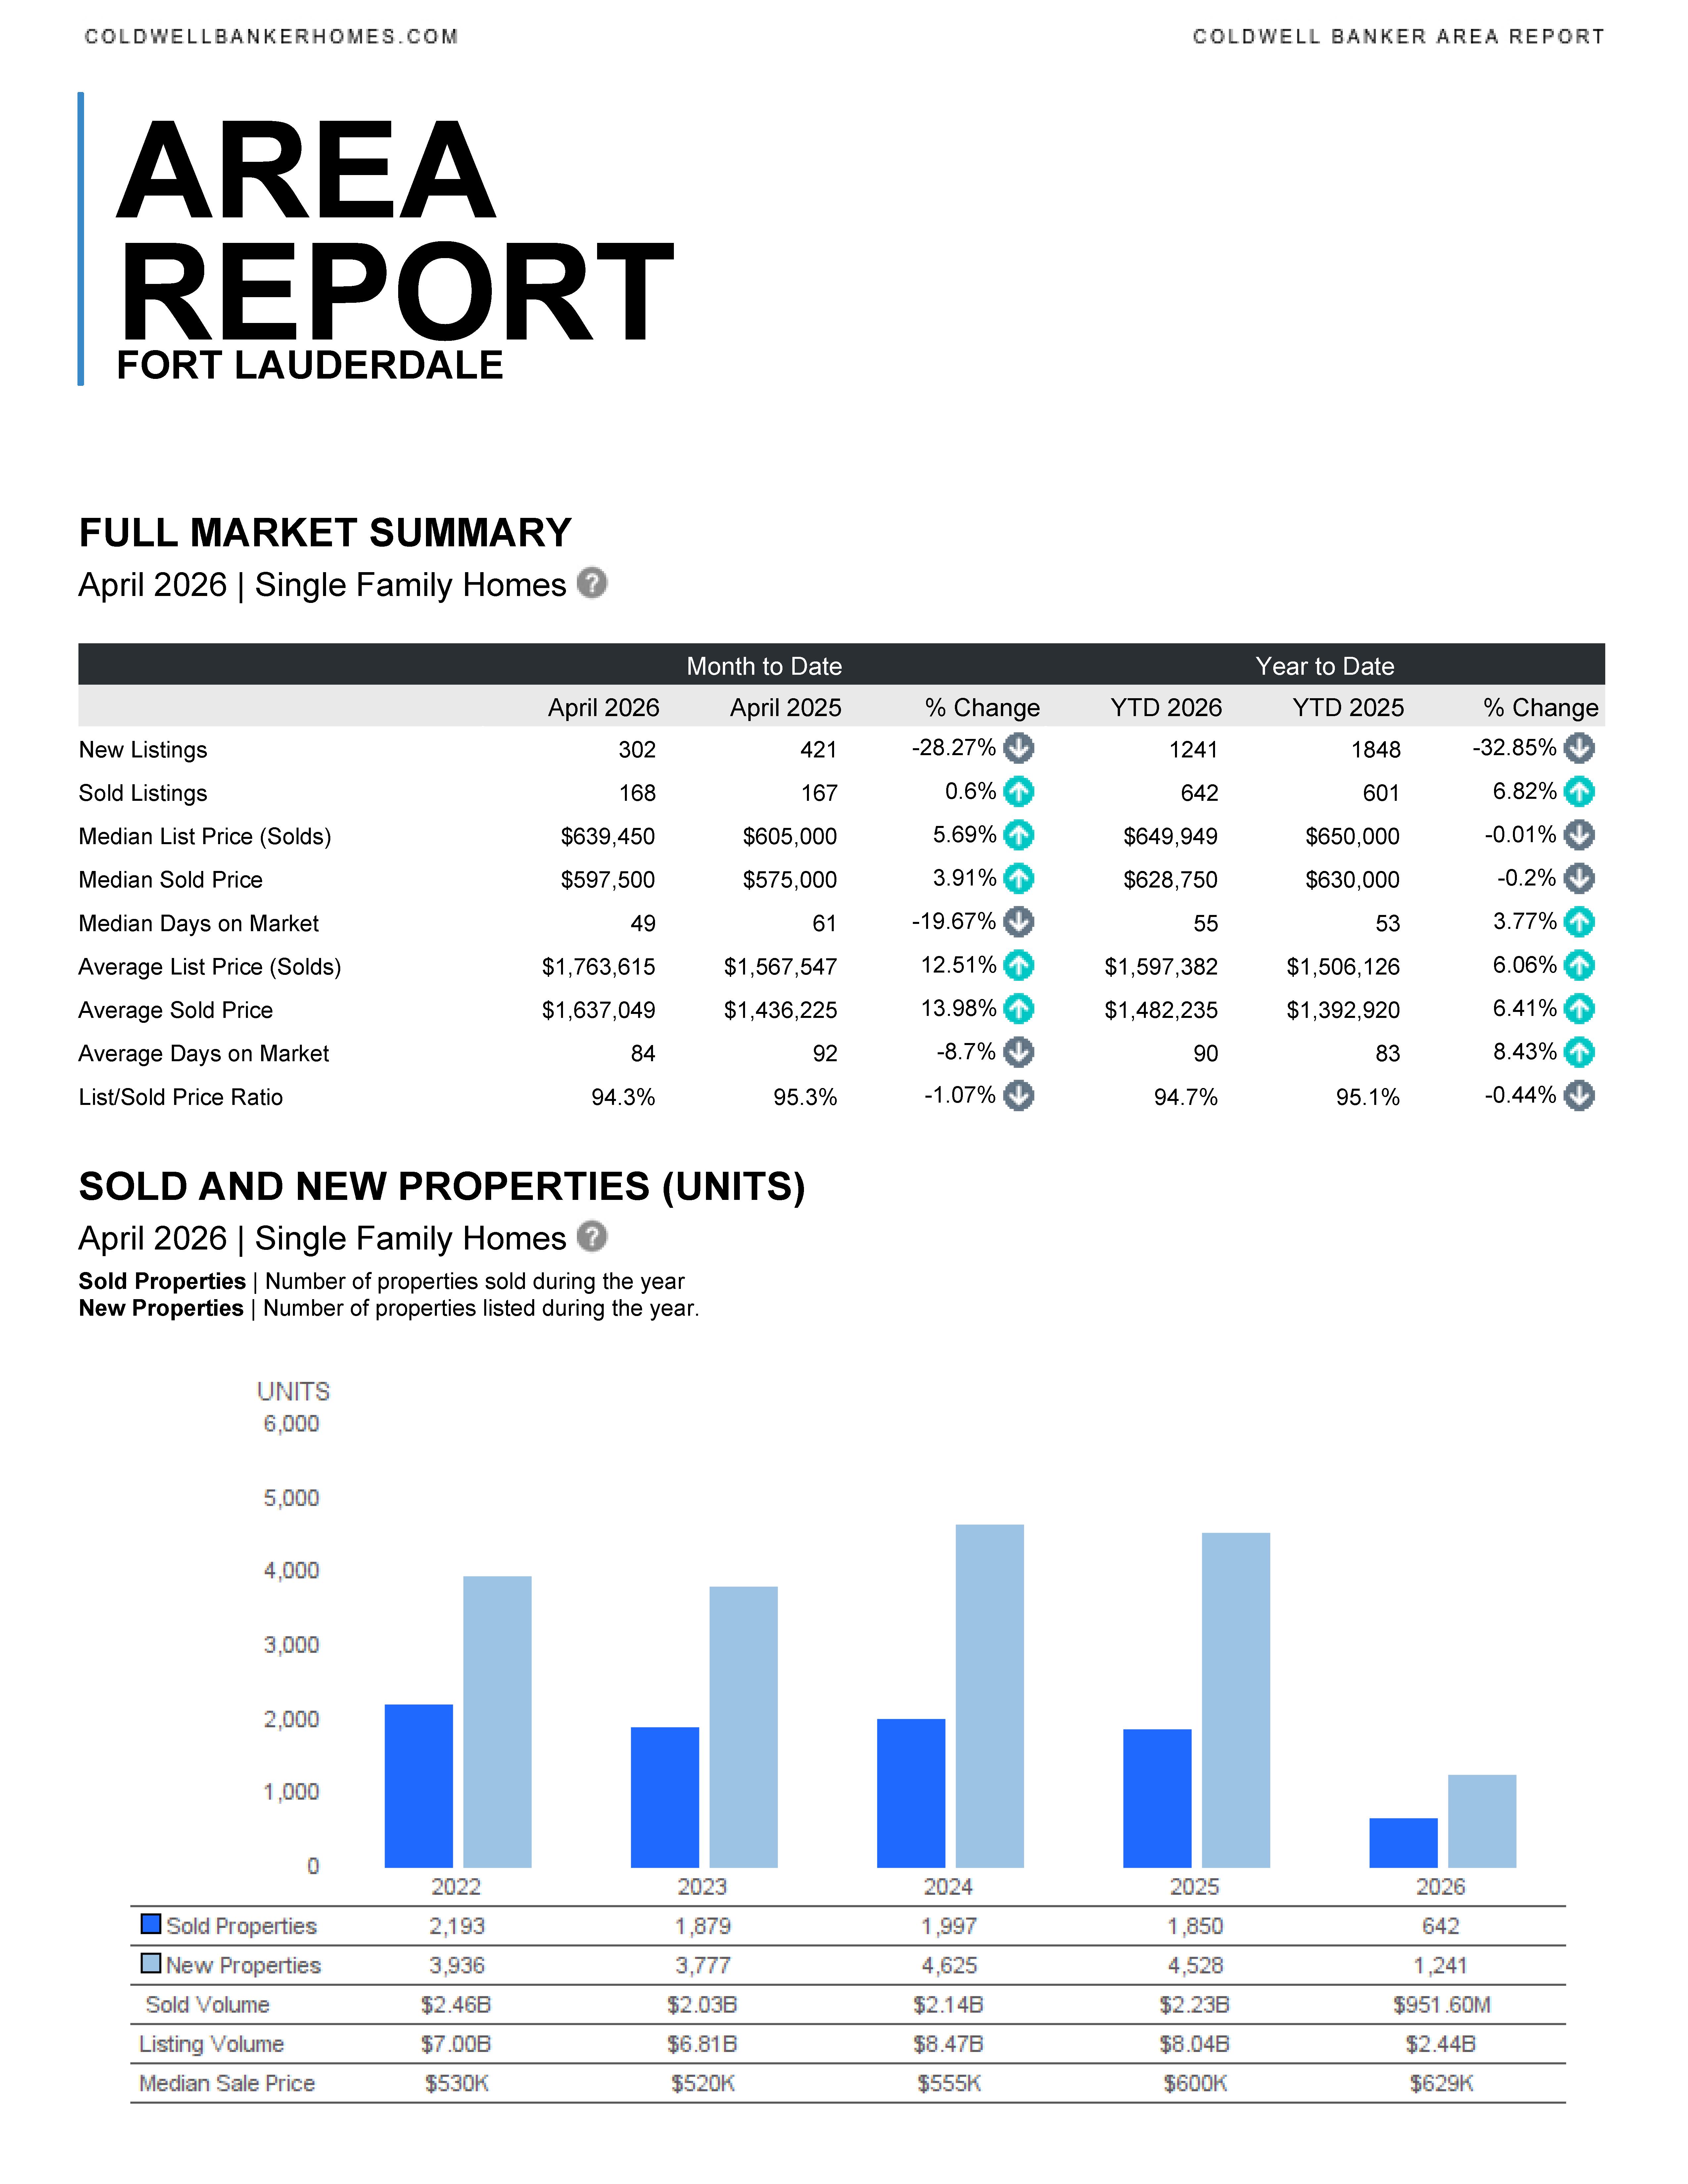
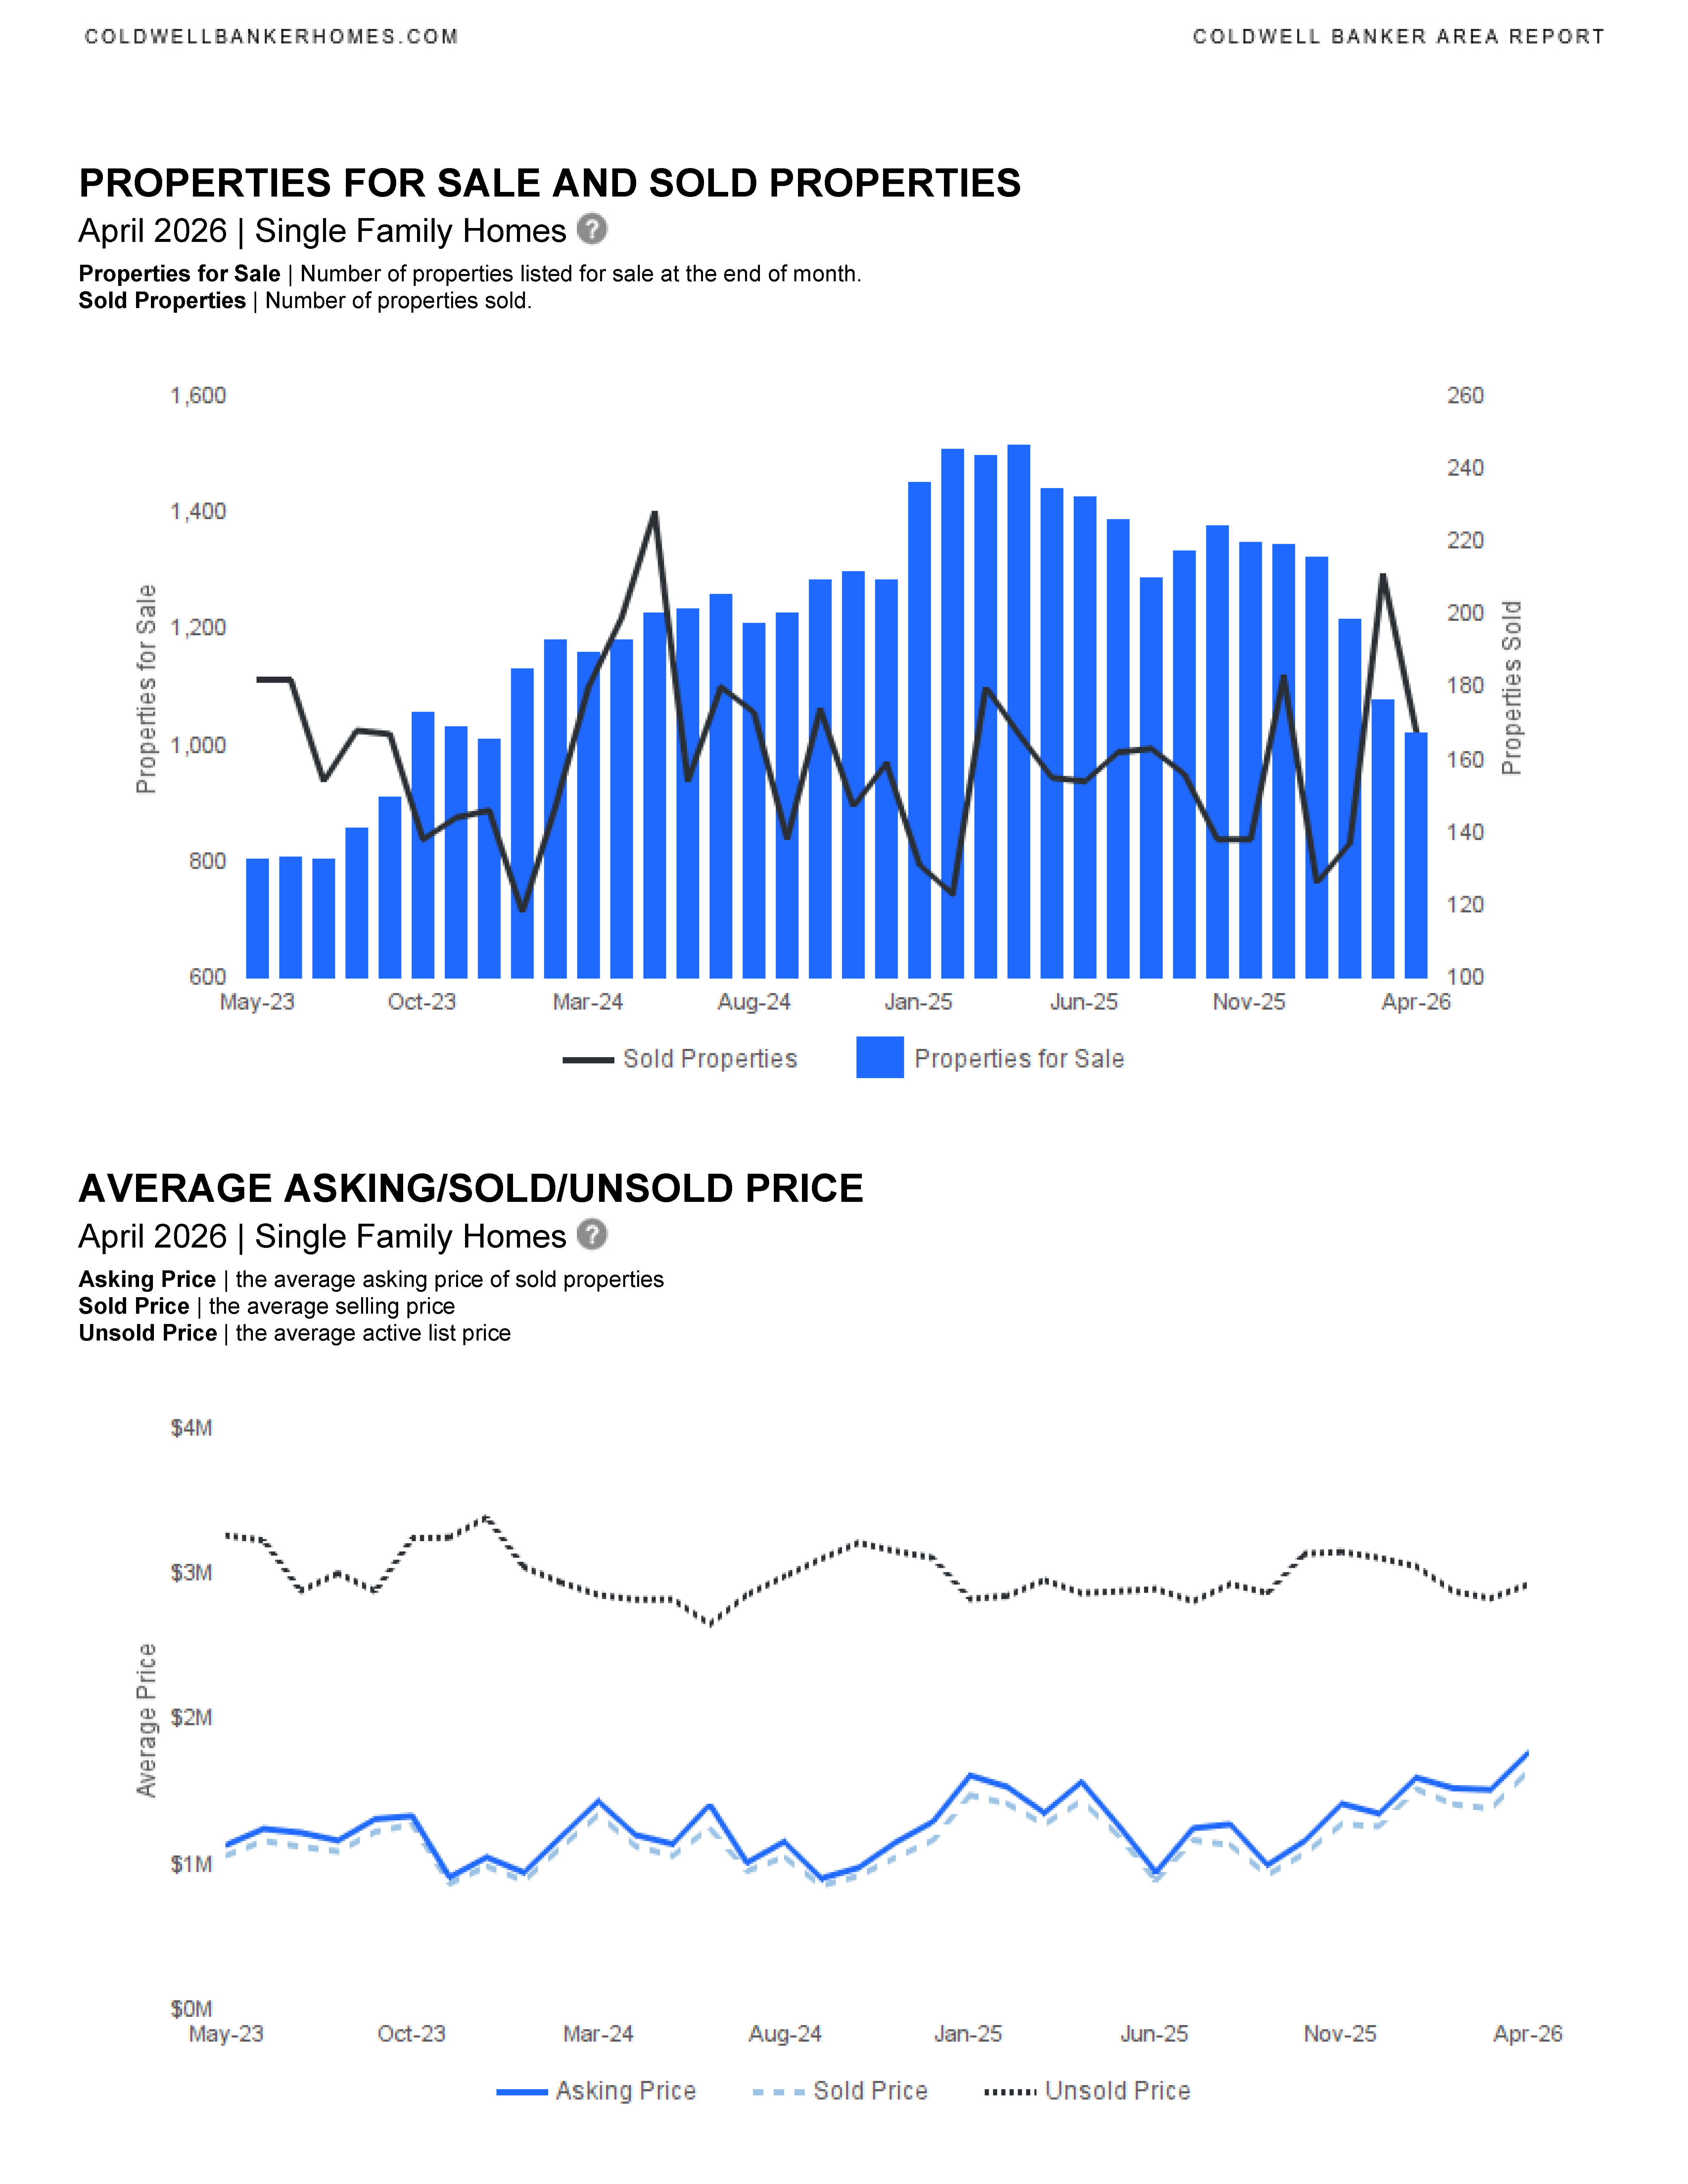
🏡 Single-Family Homes – Key Highlights
- Prices are rising steadily
- Median sold price: ↑ 3.9% ($597,500)
- Average sold price: ↑ 14.0%
- Inventory is tightening
- New listings: ↓ 28.3% year-over-year
- Sales are holding steady
- Homes sold: ↑ 0.6% (essentially flat)
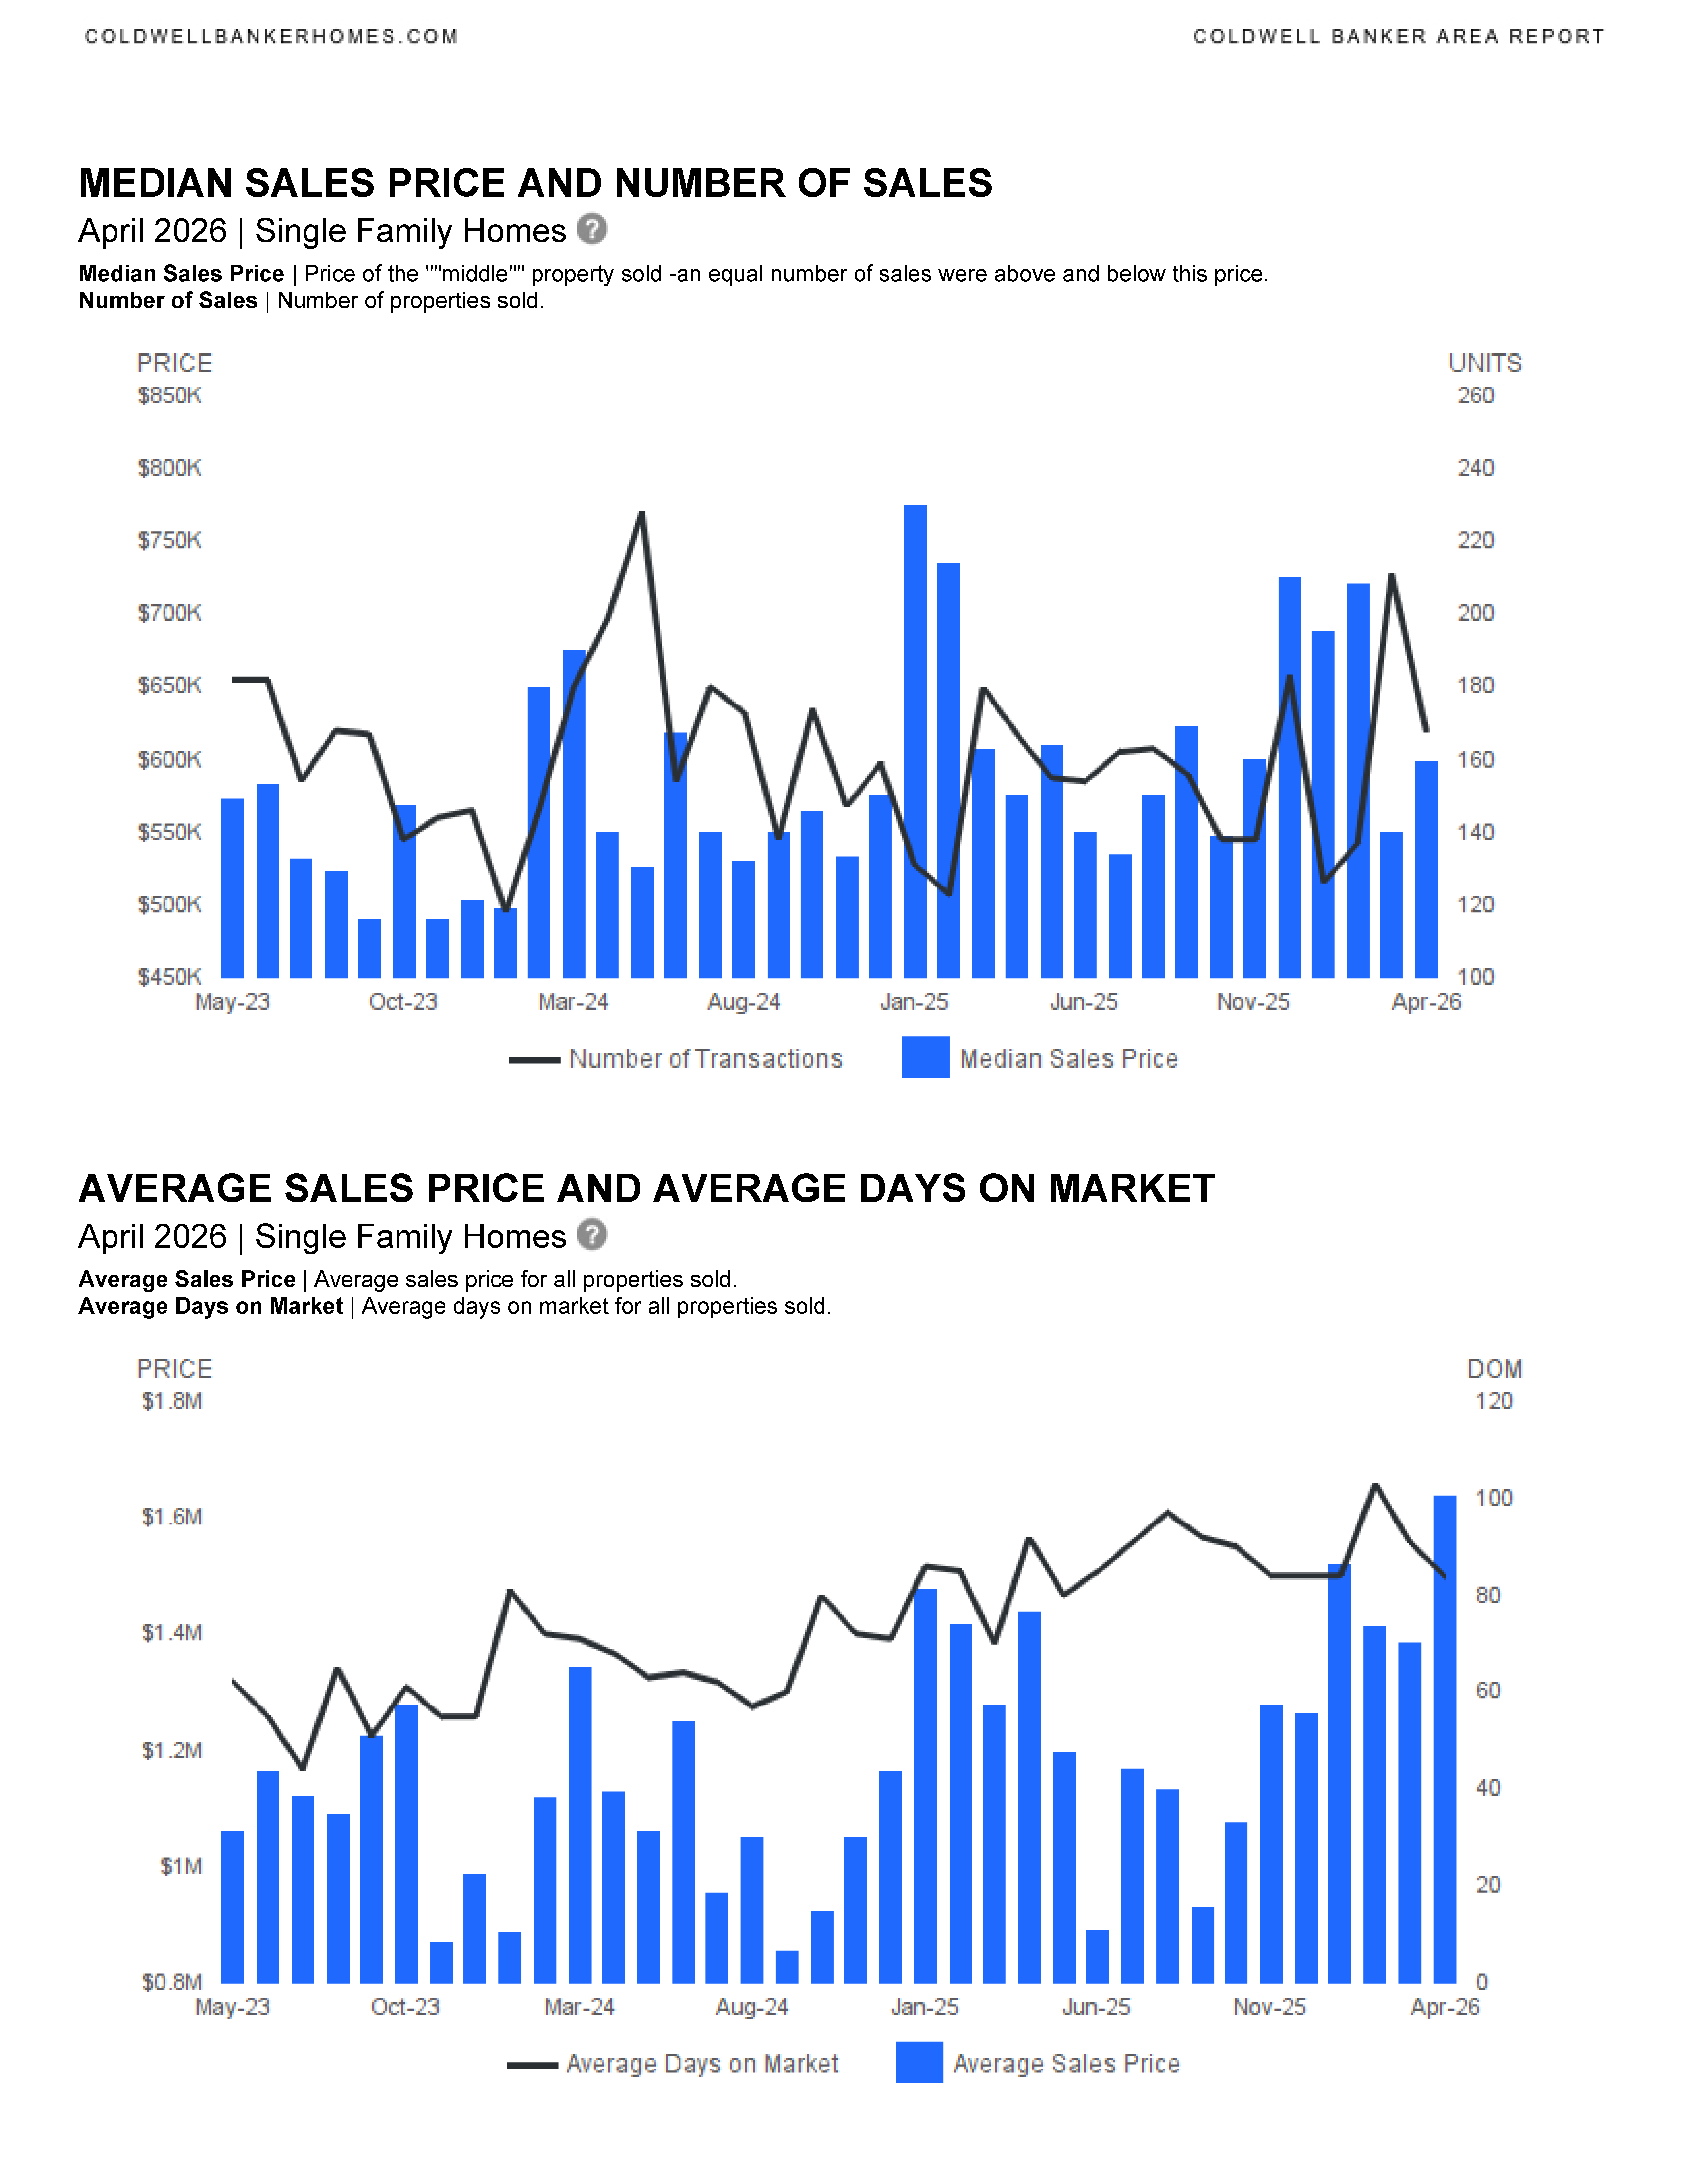
- Homes are selling faster
- Median days on market: 49 days (↓ ~20%)
- Average days on market: ↓ 8.7%
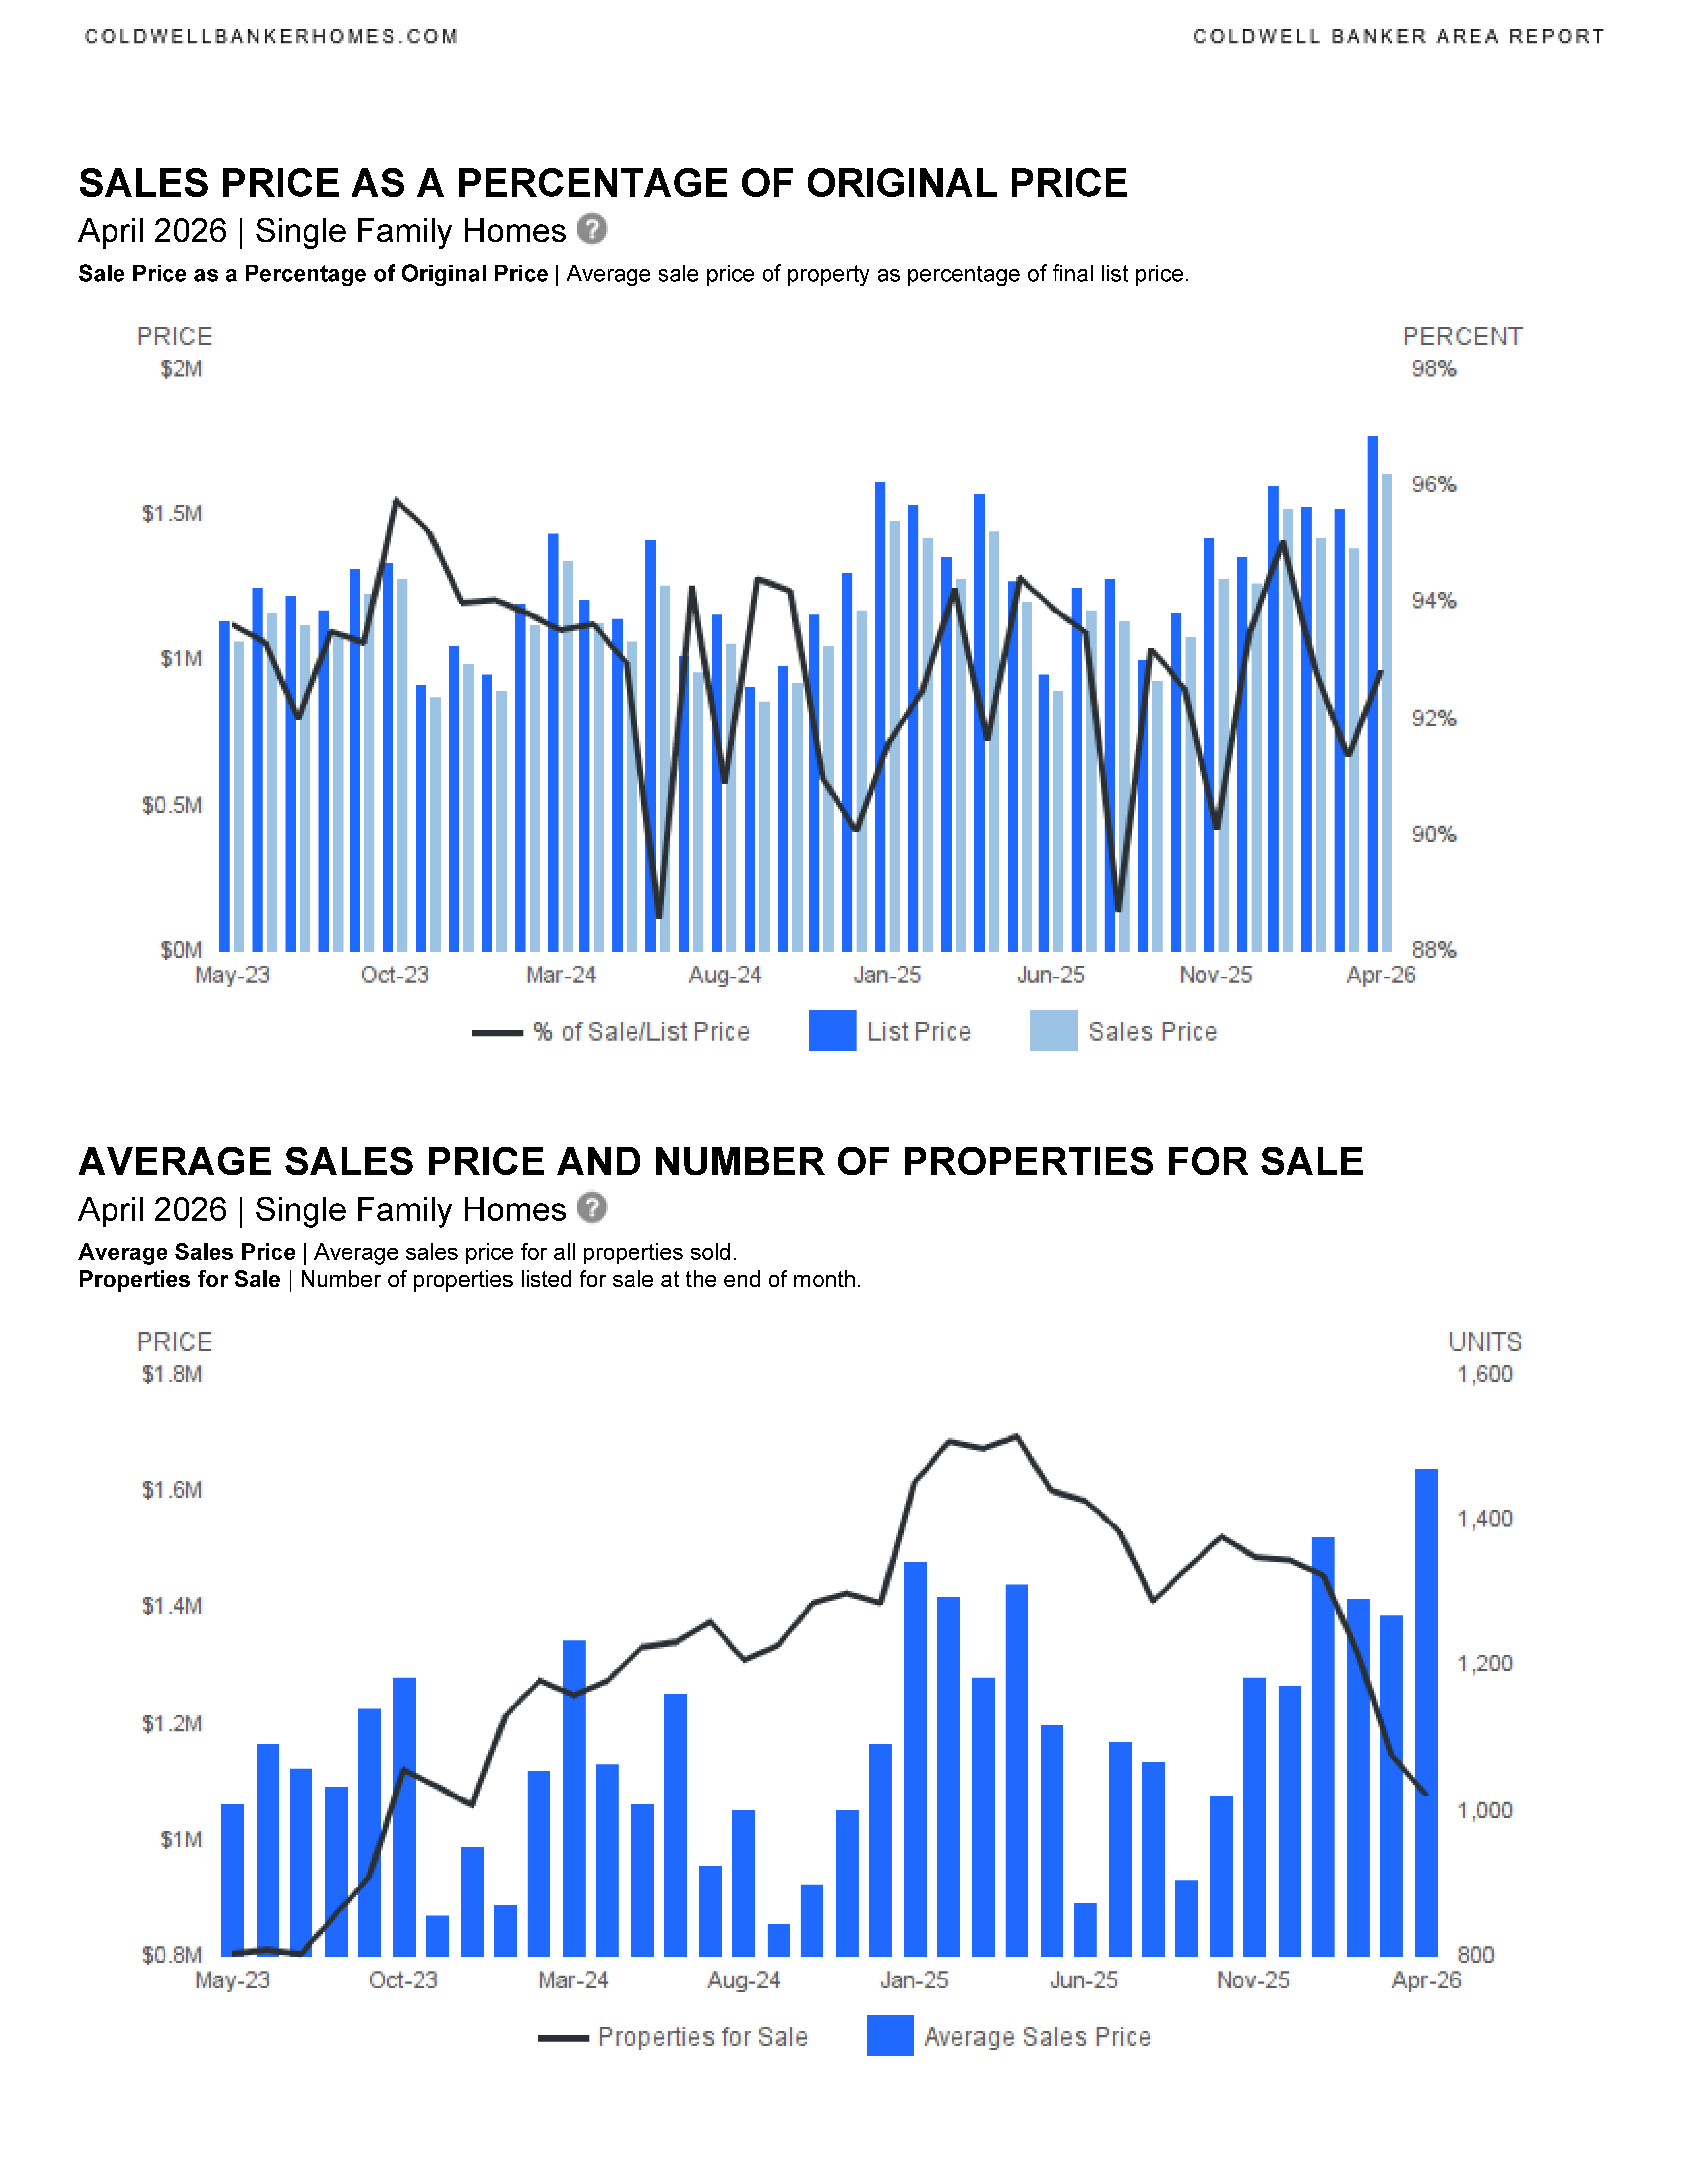
- Slight negotiation returning
- Sale-to-list price ratio dipped to ~94.3%
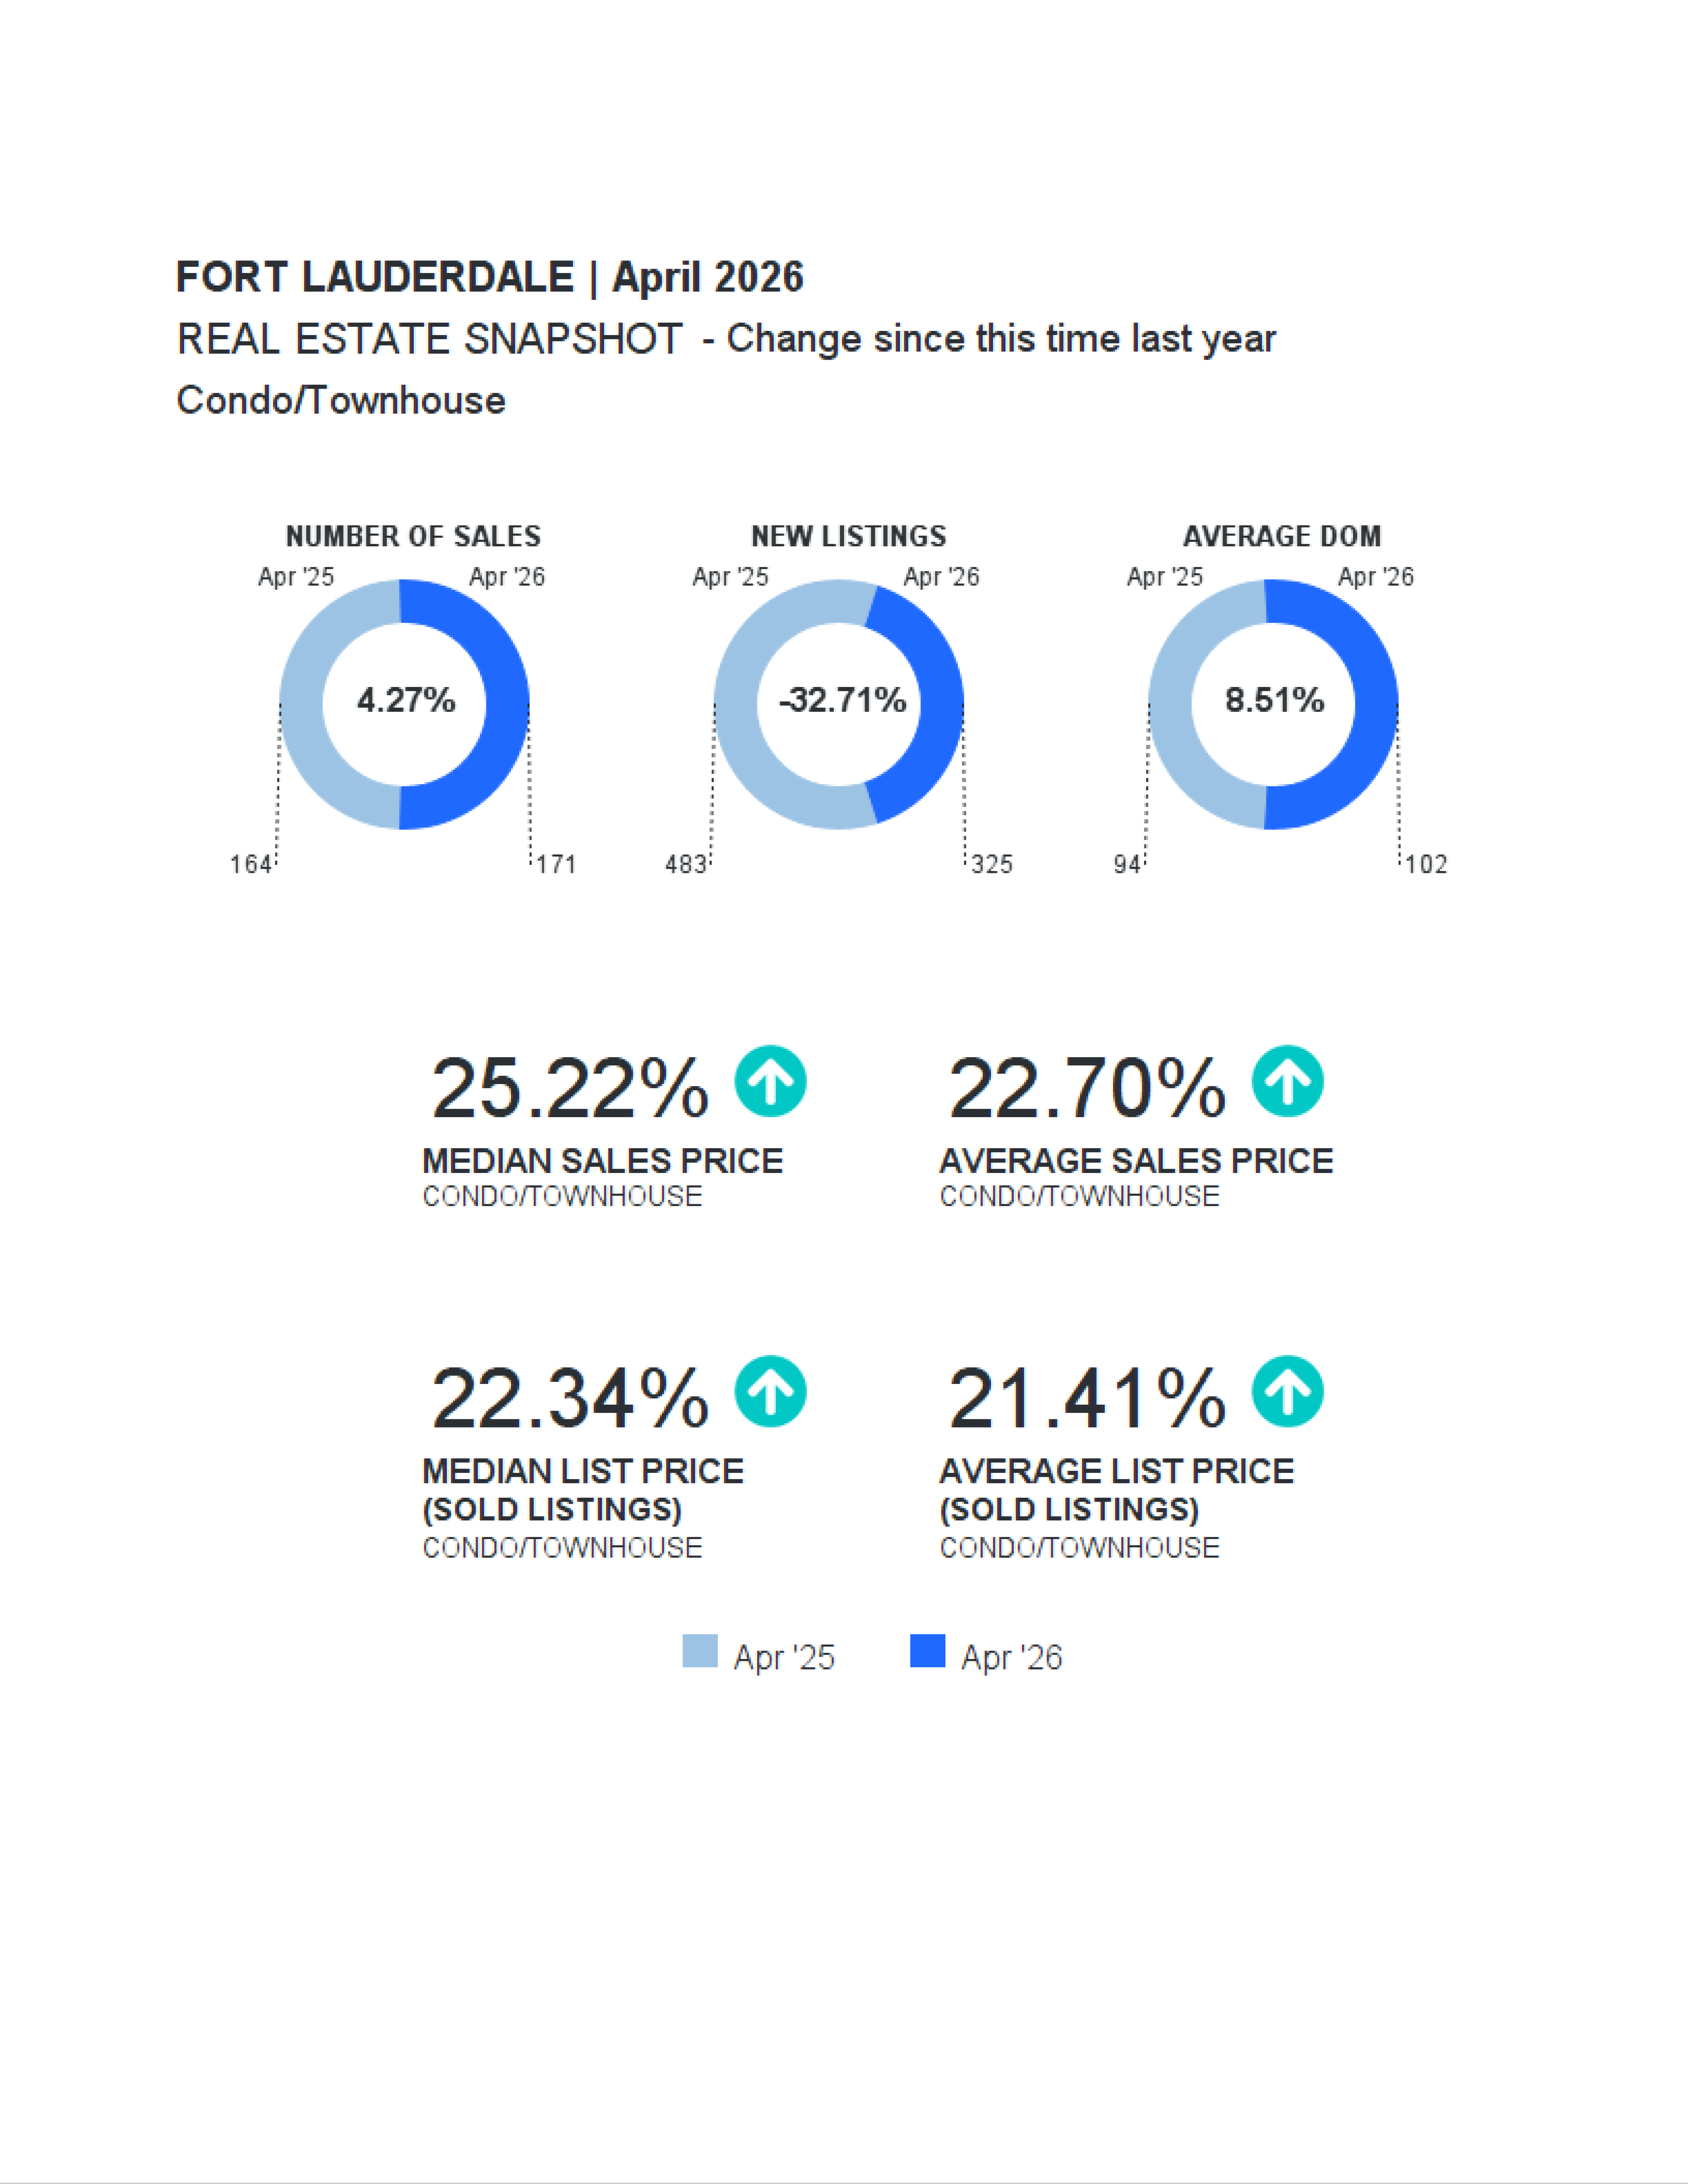
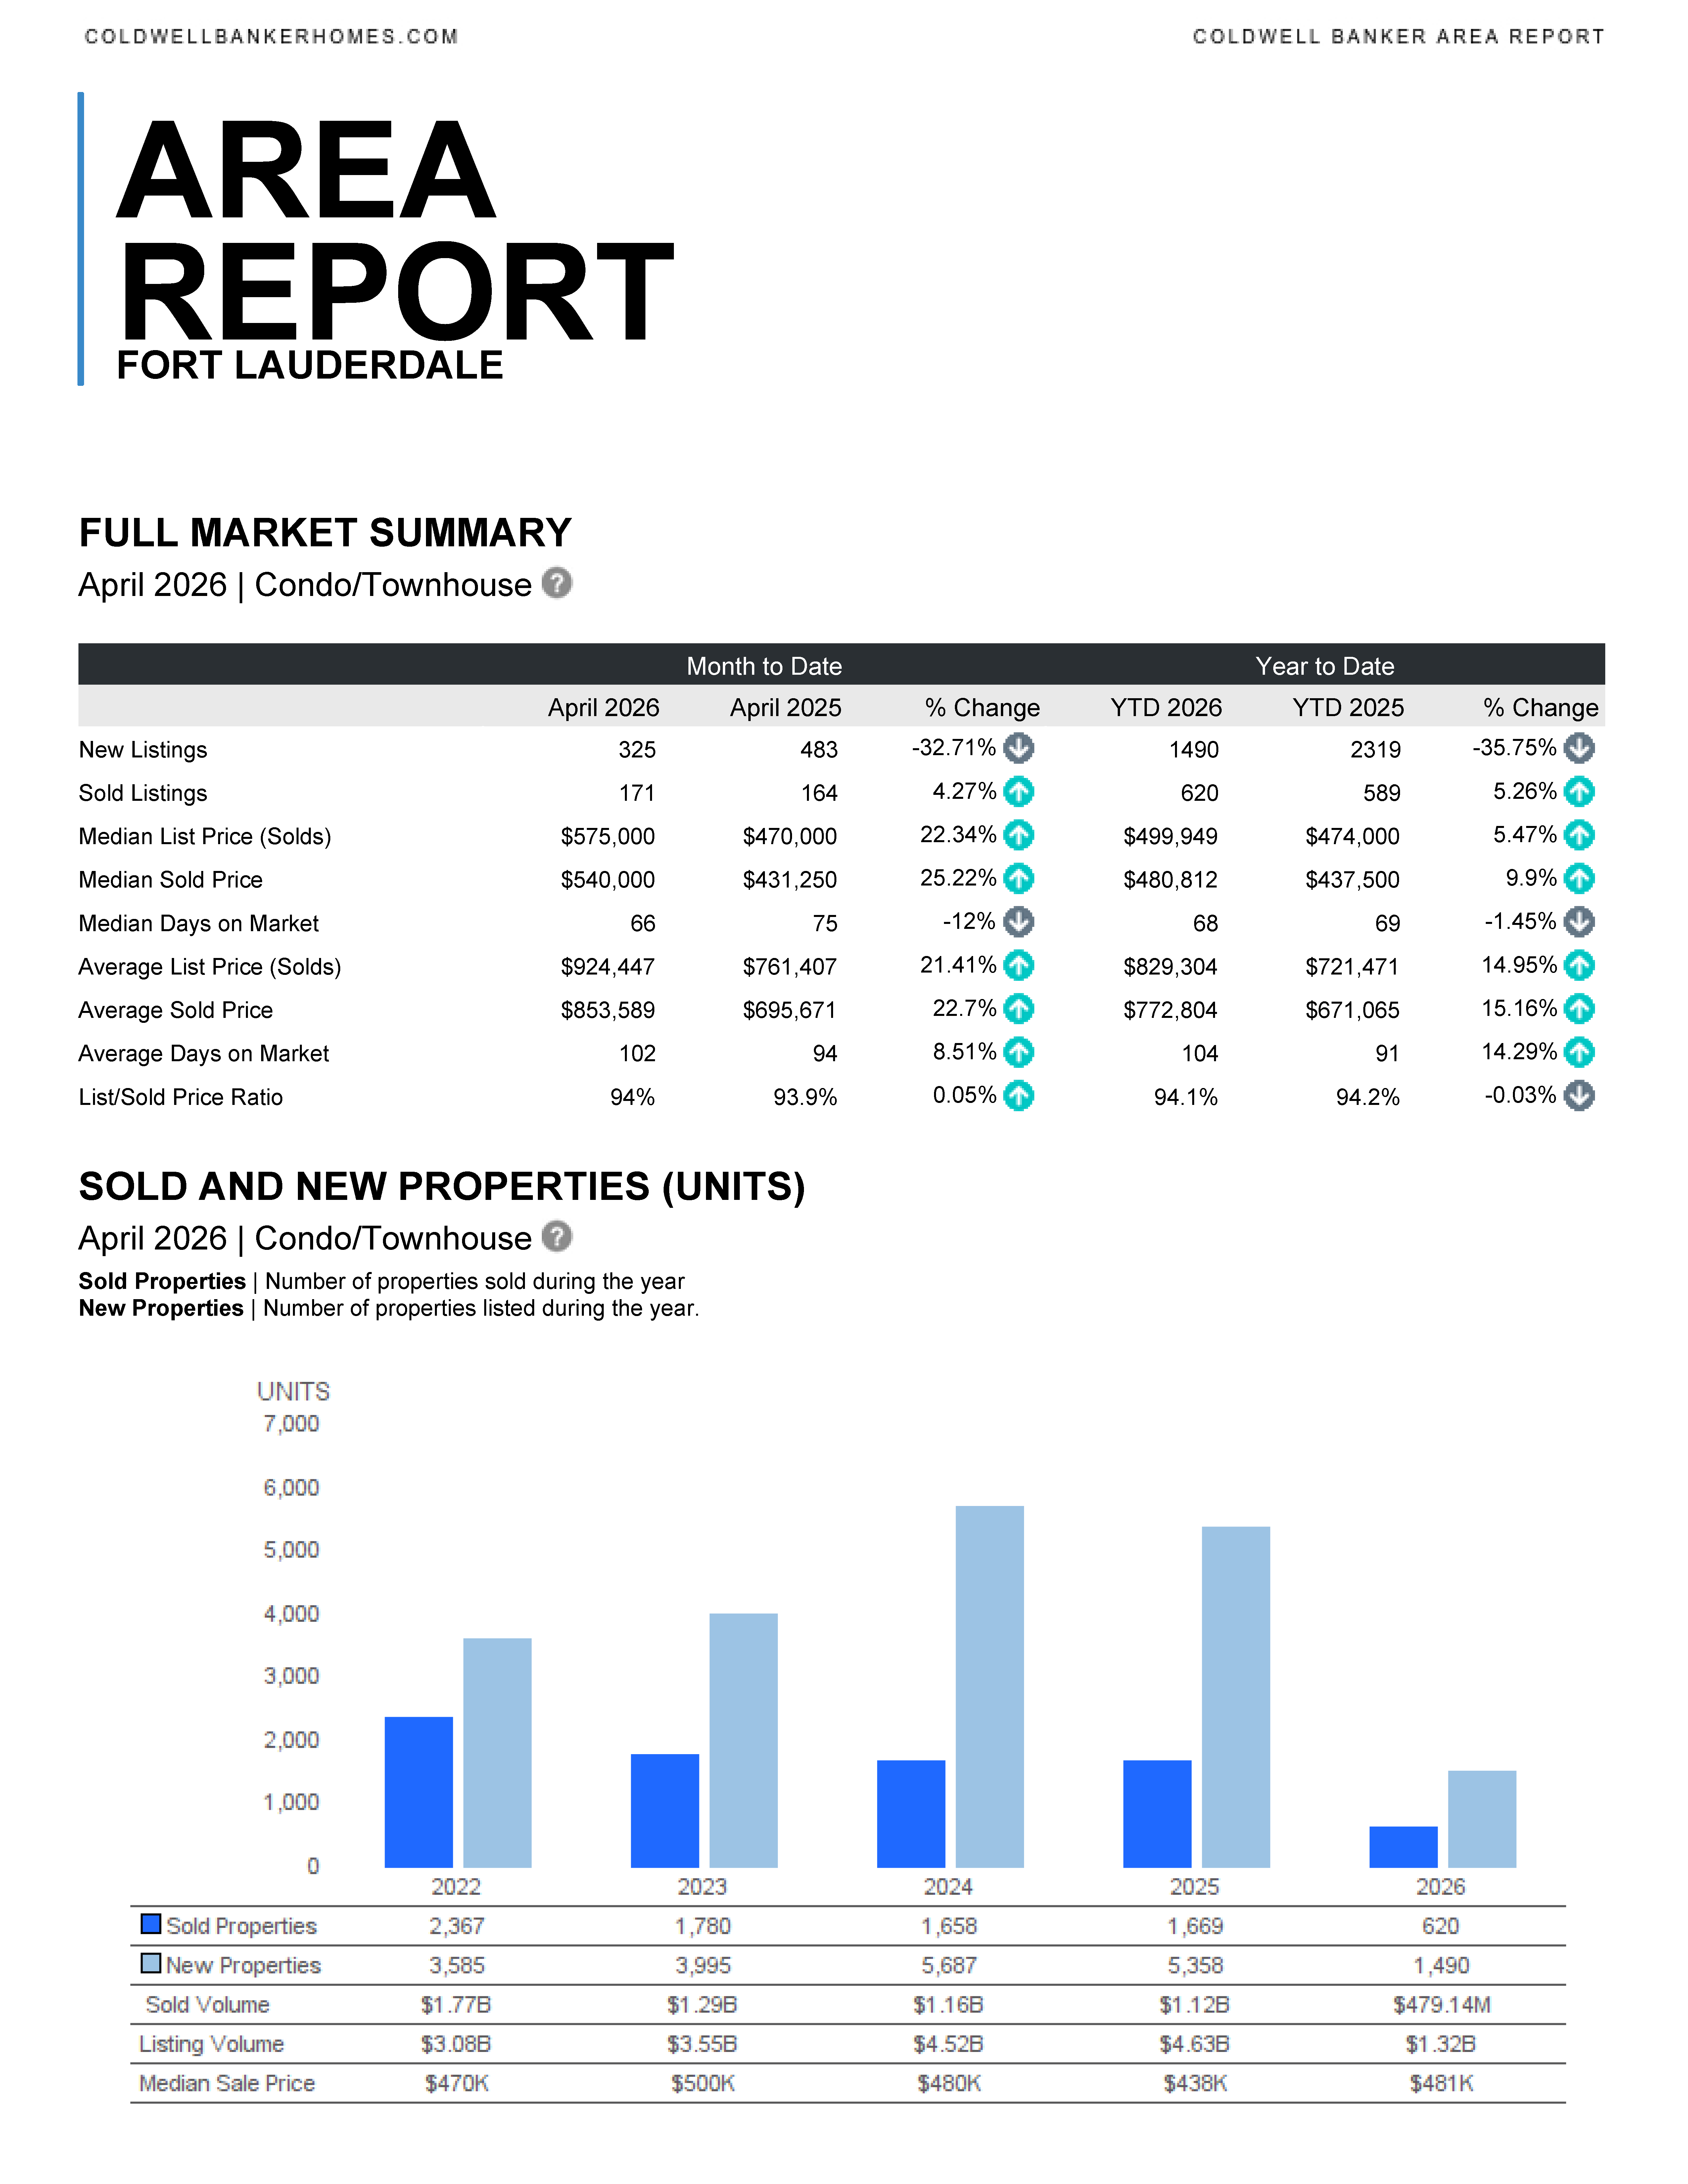
🏙️ Condo & Townhouse Market – Key Highlights
- Prices are surging
- Median sold price: ↑ 25.2% ($540,000)
- Average sold price: ↑ 22.7%
- Inventory dropped significantly
- New listings: ↓ 32.7%
- More sales activity
- Homes sold: ↑ 4.3%
- Mixed timing trends
- Median days on market: ↓ 12% (faster)
- Average days on market: ↑ 8.5% (some properties linger)
- Pricing remains strong
- Sale-to-list ratio: ~94% (stable)
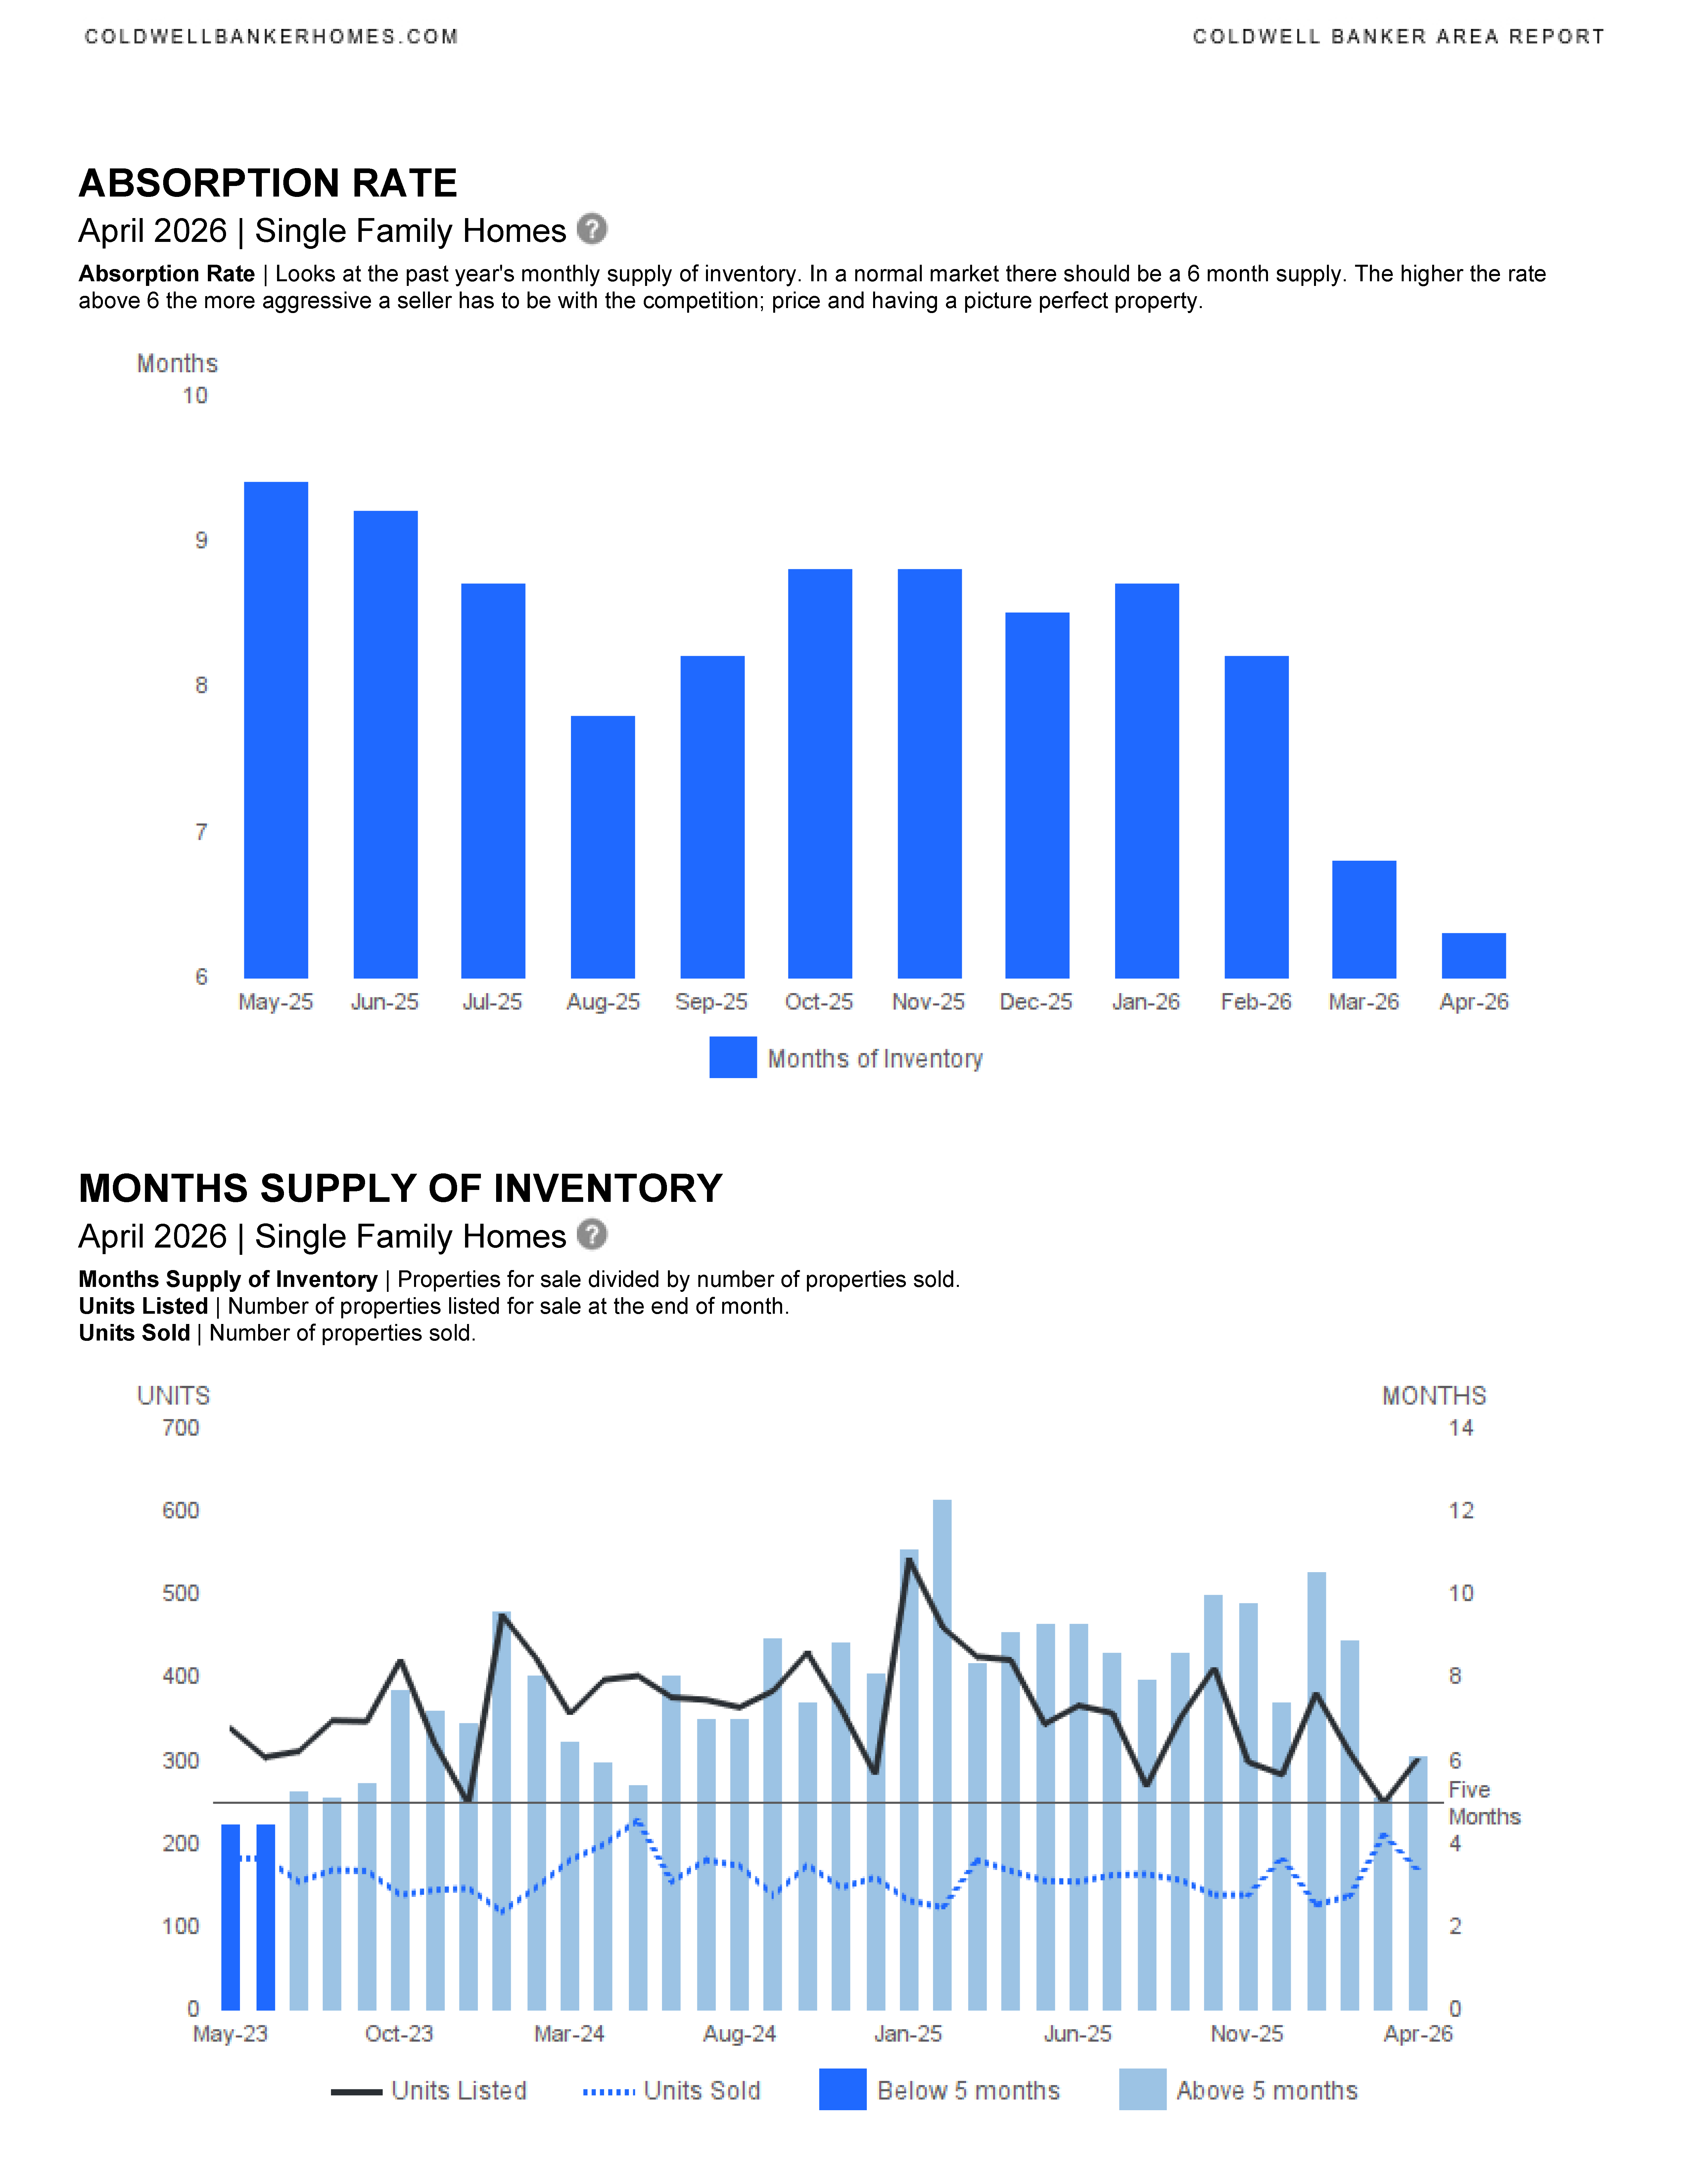
📦 Inventory & Supply Trends (Overall Insight)
- Inventory is decreasing across both property types (fewer new listings year-over-year)
- Months of supply is trending near or just above balanced levels (around the 6-month benchmark, per report visuals)
- Sellers are facing more competition than peak frenzy years, but still benefiting from strong pricing
✅ Major Takeaways
- 📈 Prices are rising across the board, especially in the condo market
- 📉 Inventory shortages continue, limiting buyer options
- ⚖️ Sales activity is stable, not surging
- ⏱️ Homes are generally selling faster, especially well-priced ones
- 💬 Negotiation is slightly increasing, but sellers still hold leverage
🧭 Bottom Line: What Kind of Market Is It?
Fort Lauderdale remains a strong but stabilizing seller’s market.
- Sellers: Still have pricing power, but need to be competitive as buyers become more selective
- Buyers: Facing limited inventory and higher prices, but beginning to gain slightly more negotiating room


In today’s competitive SE Florida housing market, it’s essential to work with an experienced and knowledgeable real estate professional. If you’d like up‑to‑date market reports for your neighborhood, Fort Lauderdale, or any other SE Florida community, I’d be happy to send them. We can review current trends, discuss the market, and explore how we can work together to achieve your real estate goals. I’m here to support you every step of the way.
CONTACT ANNETTE
Let’s start working together!
Annette Dammeyer, REALTOR®, ABR®, AHWD®
Coldwell Banker Realty
901 E Las Olas Blvd STE 101, Fort Lauderdale, FL 33301
808.747.3686
SL 3535792
Fort Lauderdale March 2026 Area Report
Fort Lauderdale March 2026 real estate statistics have been published.
Single Family Homes
Condominium & Townhouses
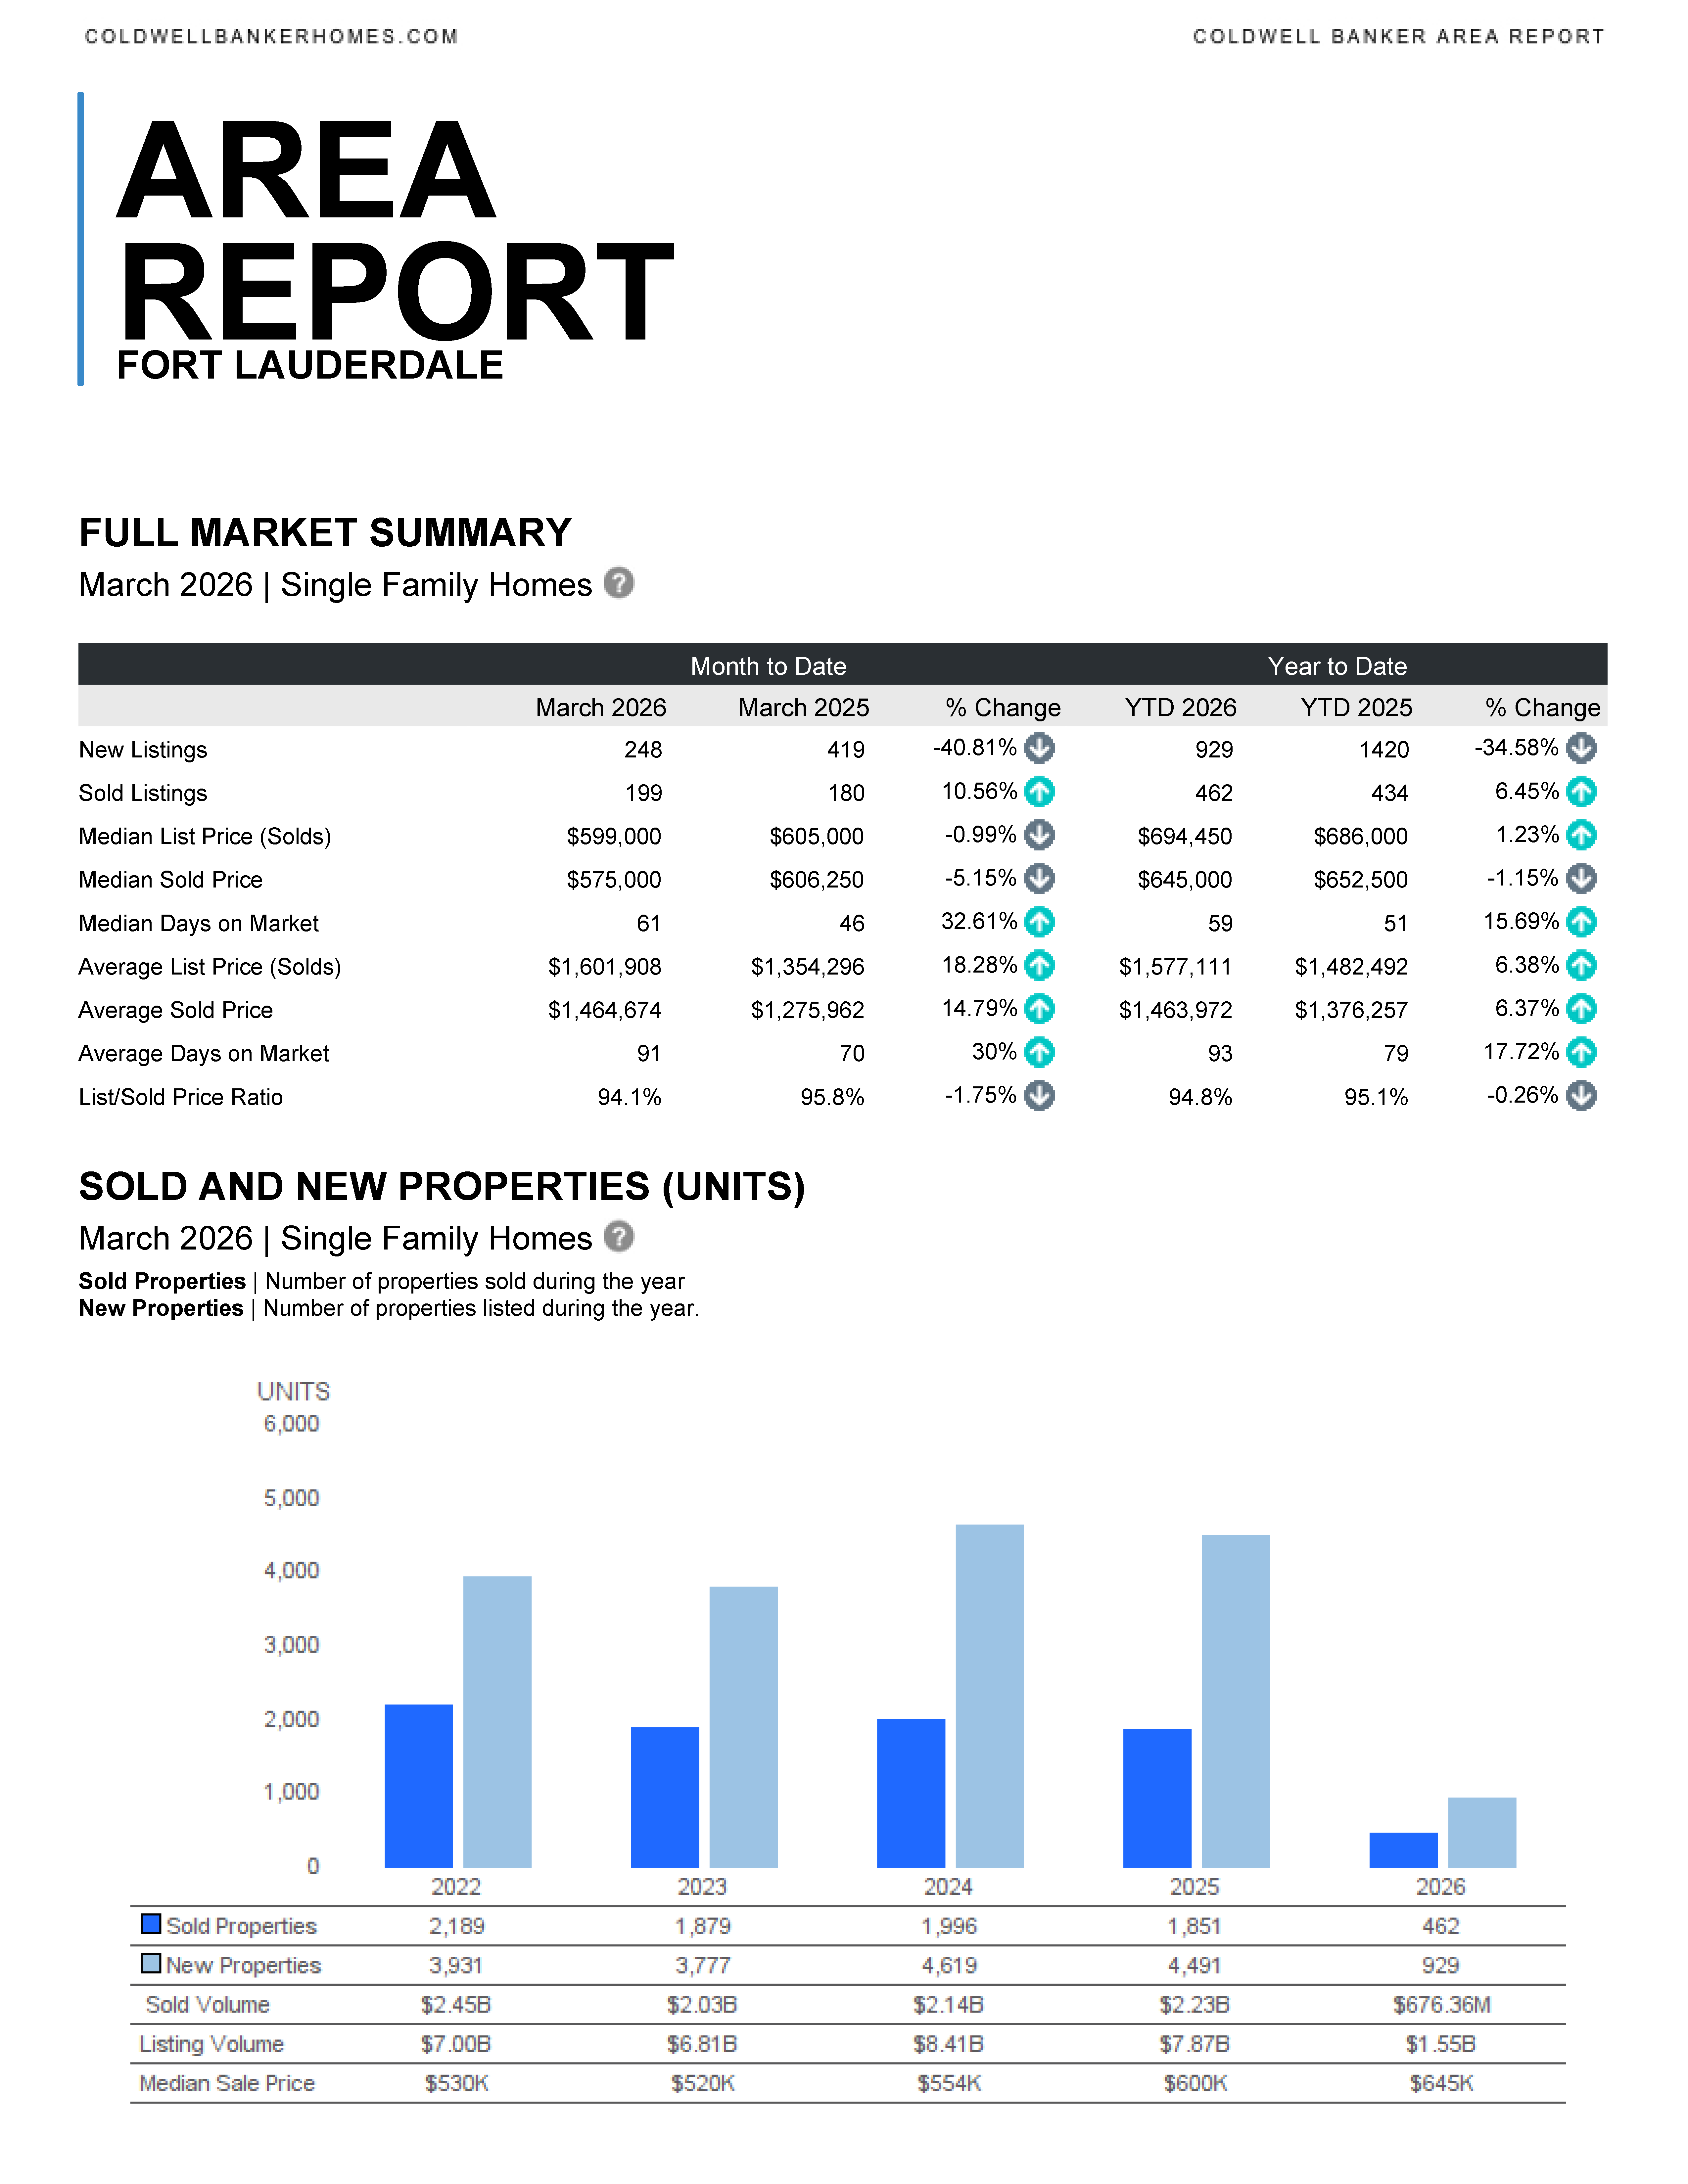
Fort Lauderdale Real Estate Market Update – March 2026
🏡 Single‑Family Homes Market Highlights
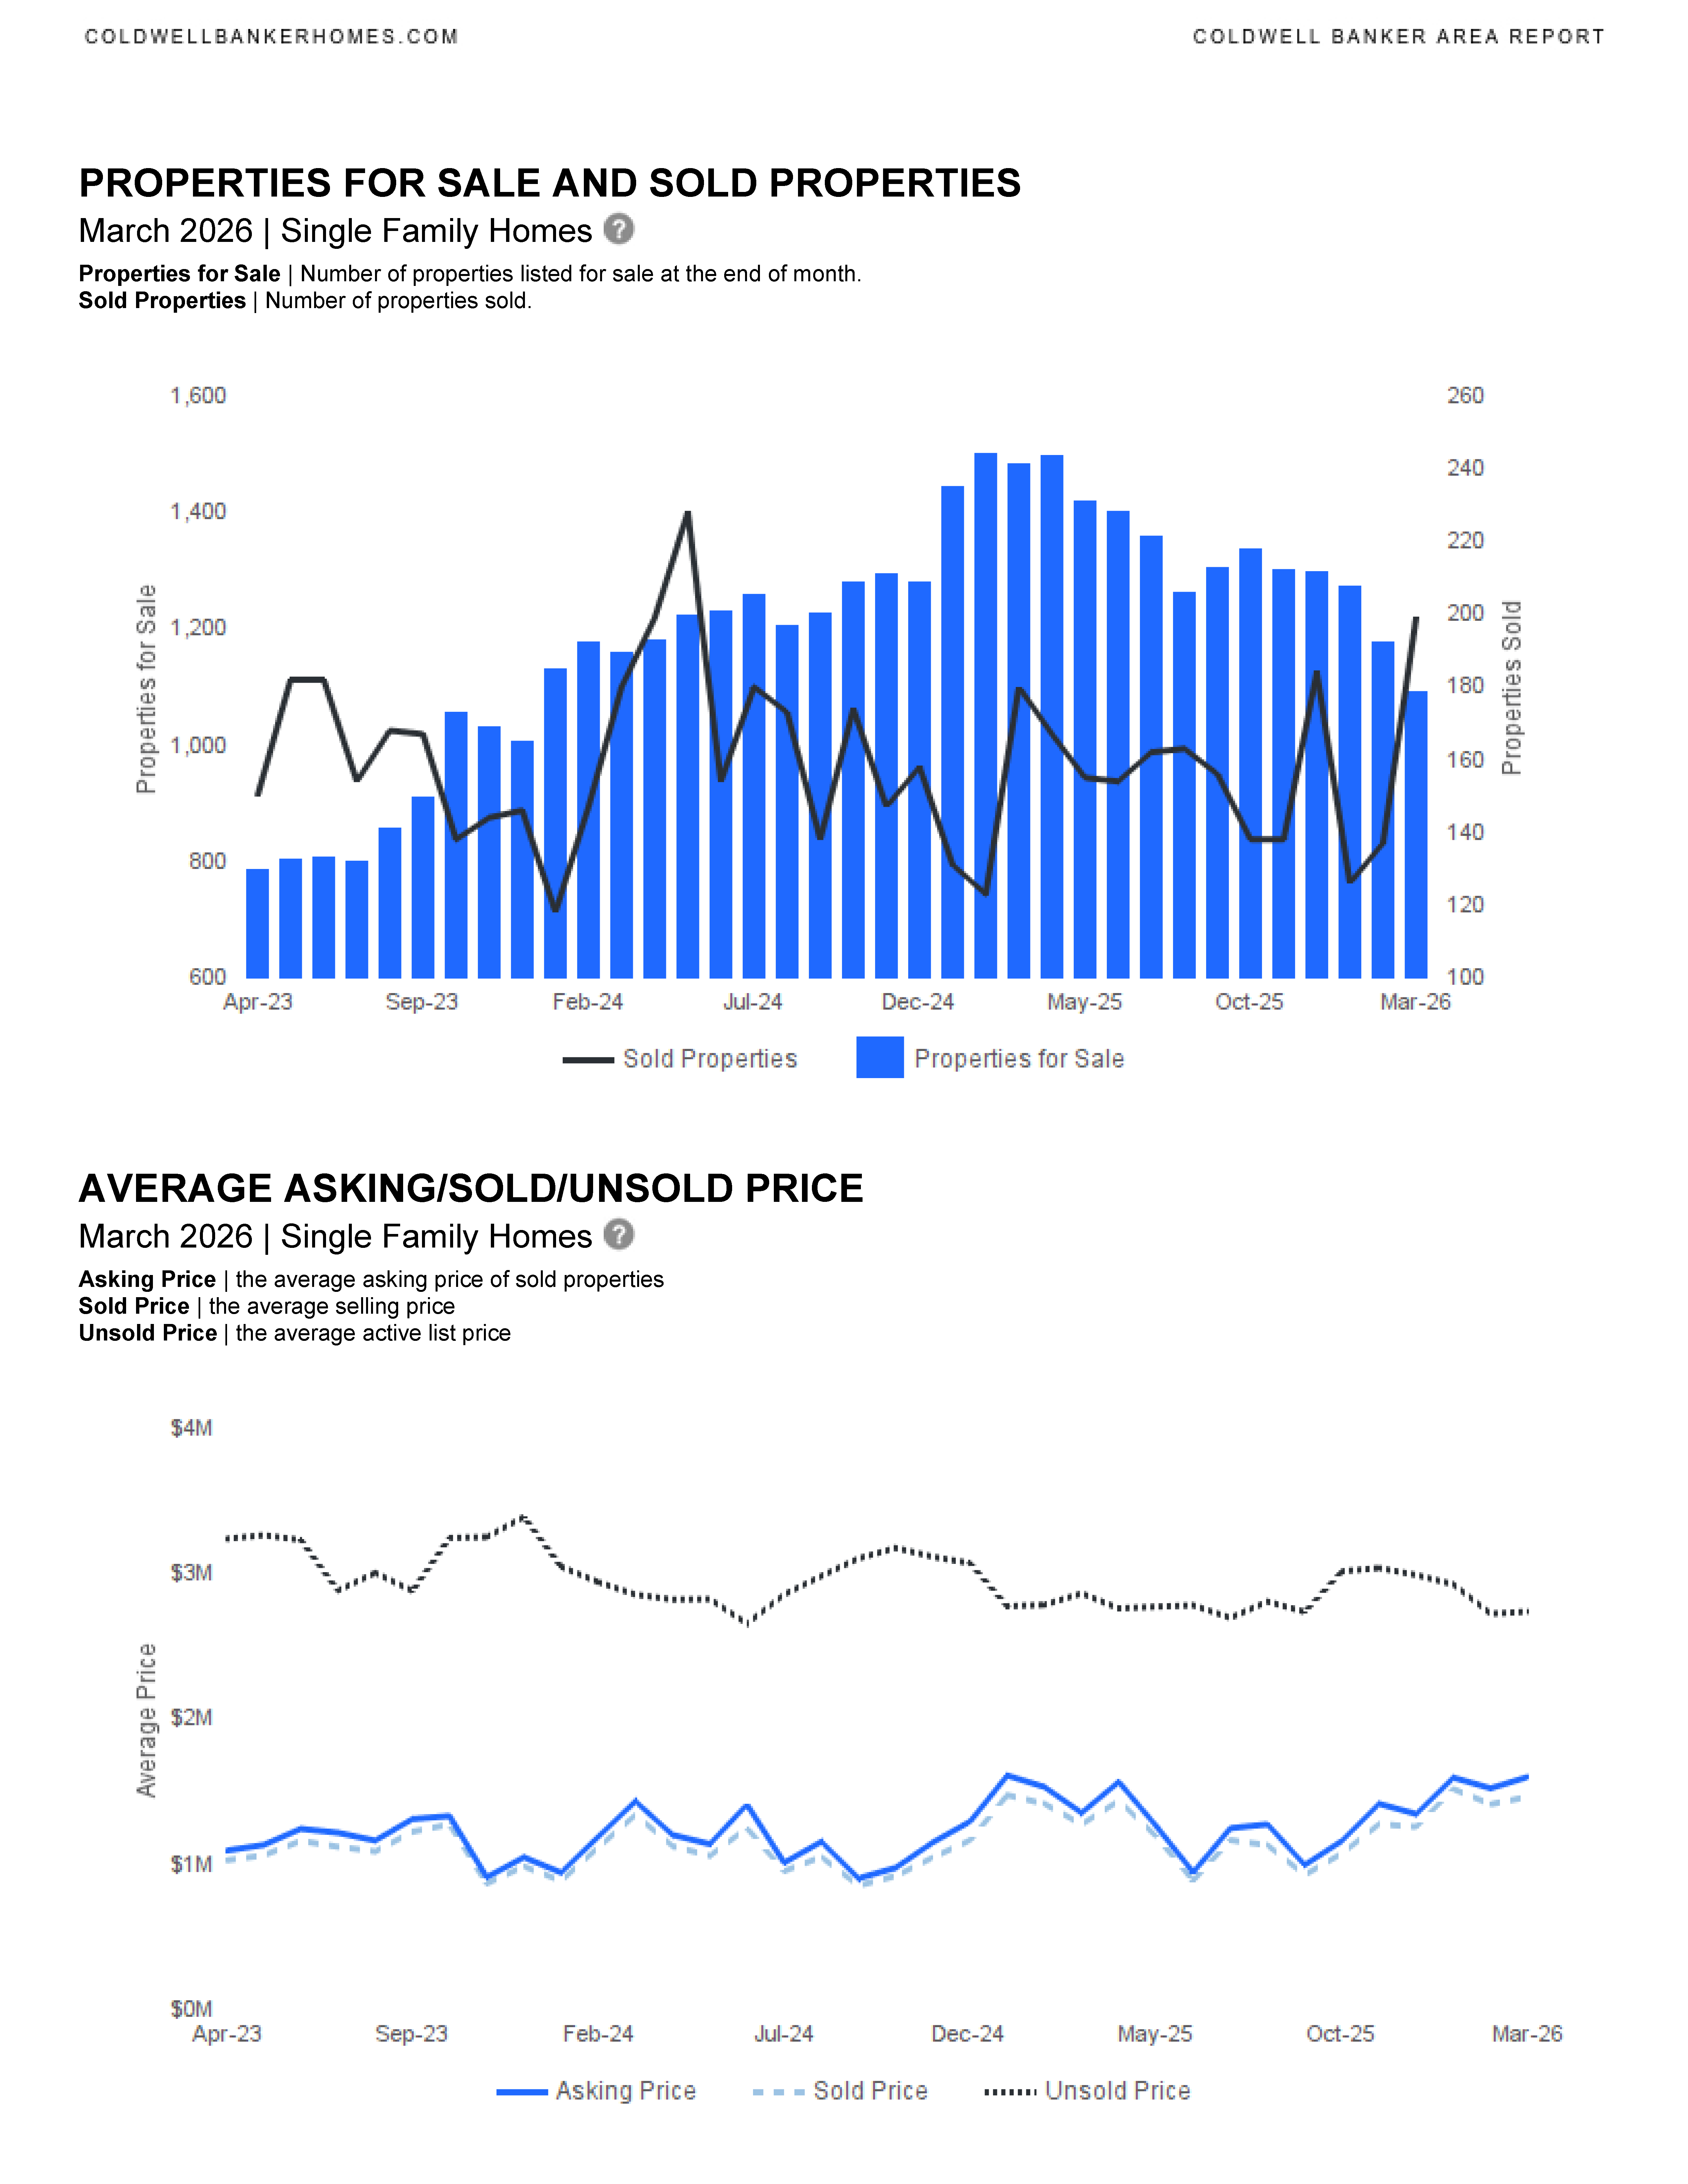
- New listings declined sharply: 248 new listings, down 40.8% year over year
- Sales activity increased: 199 homes sold, up 10.6% compared to March 2025
- Median sold price softened: $575,000, down 5.1% year over year
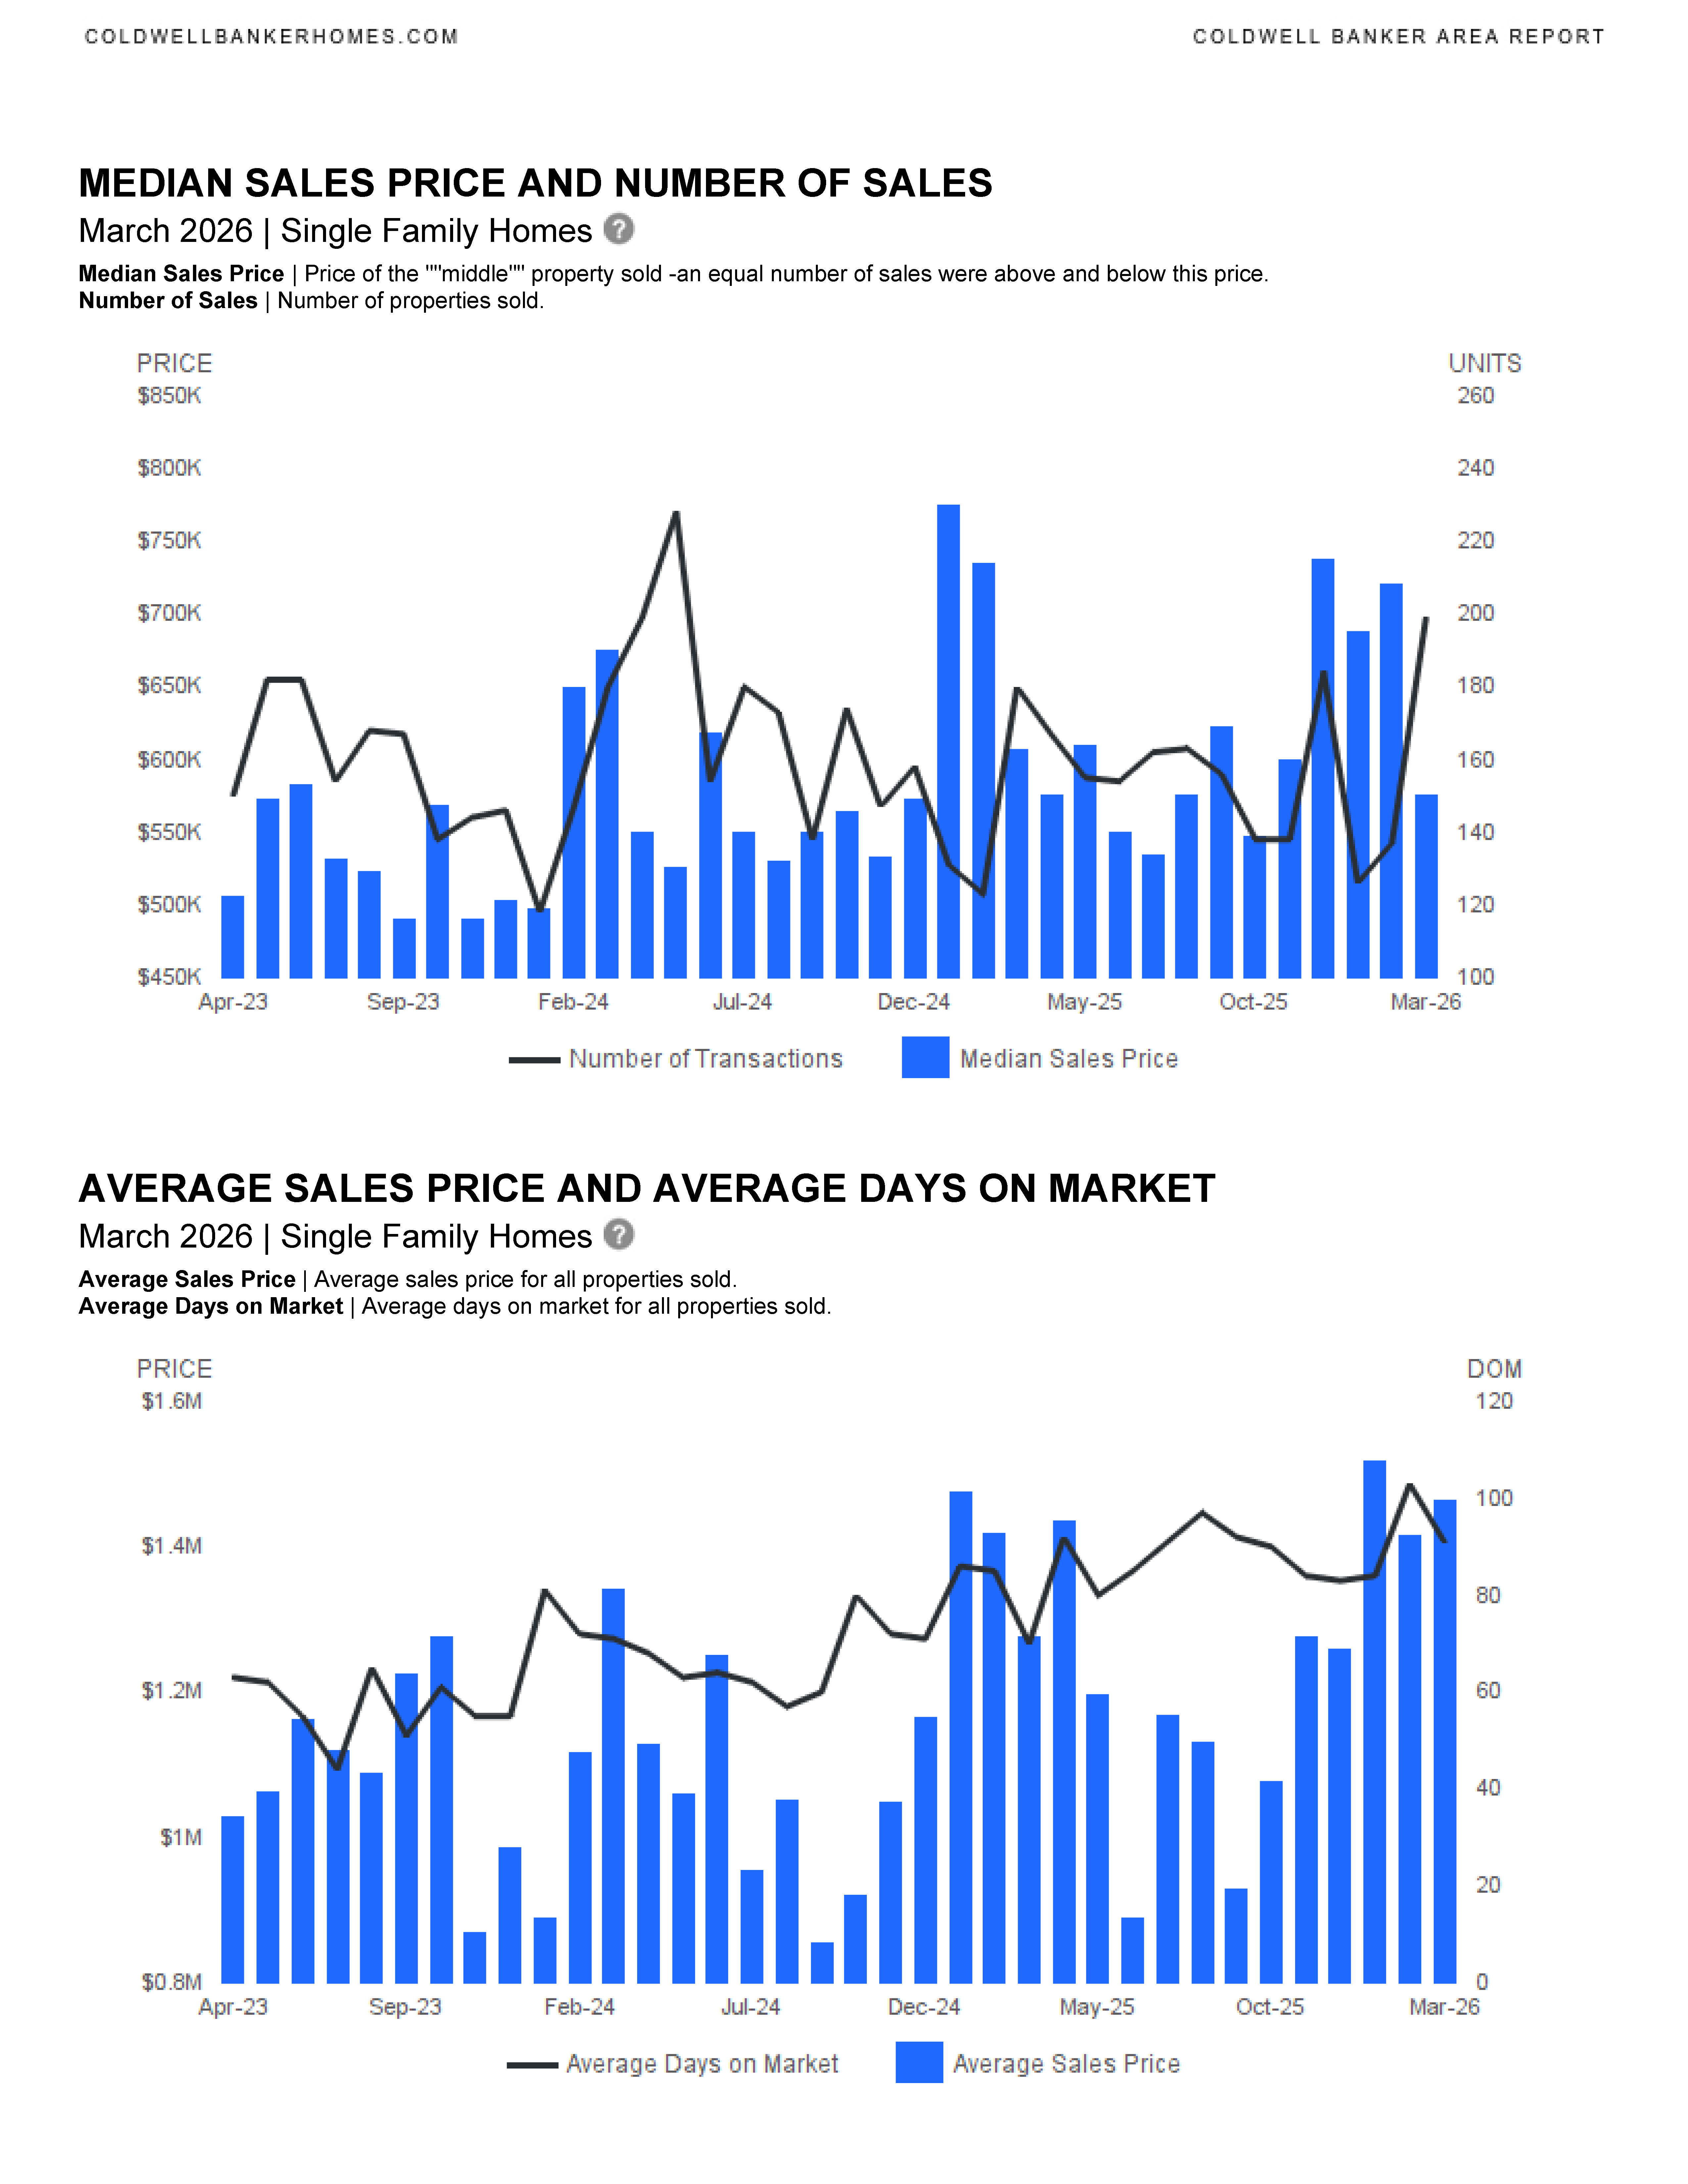
- Homes are taking longer to sell:
- Median days on market: 61 days (+32.6%)
- Average days on market: 91 days (+30%)
- High-end activity remains strong:
- Average sold price rose 14.8% to $1.46M
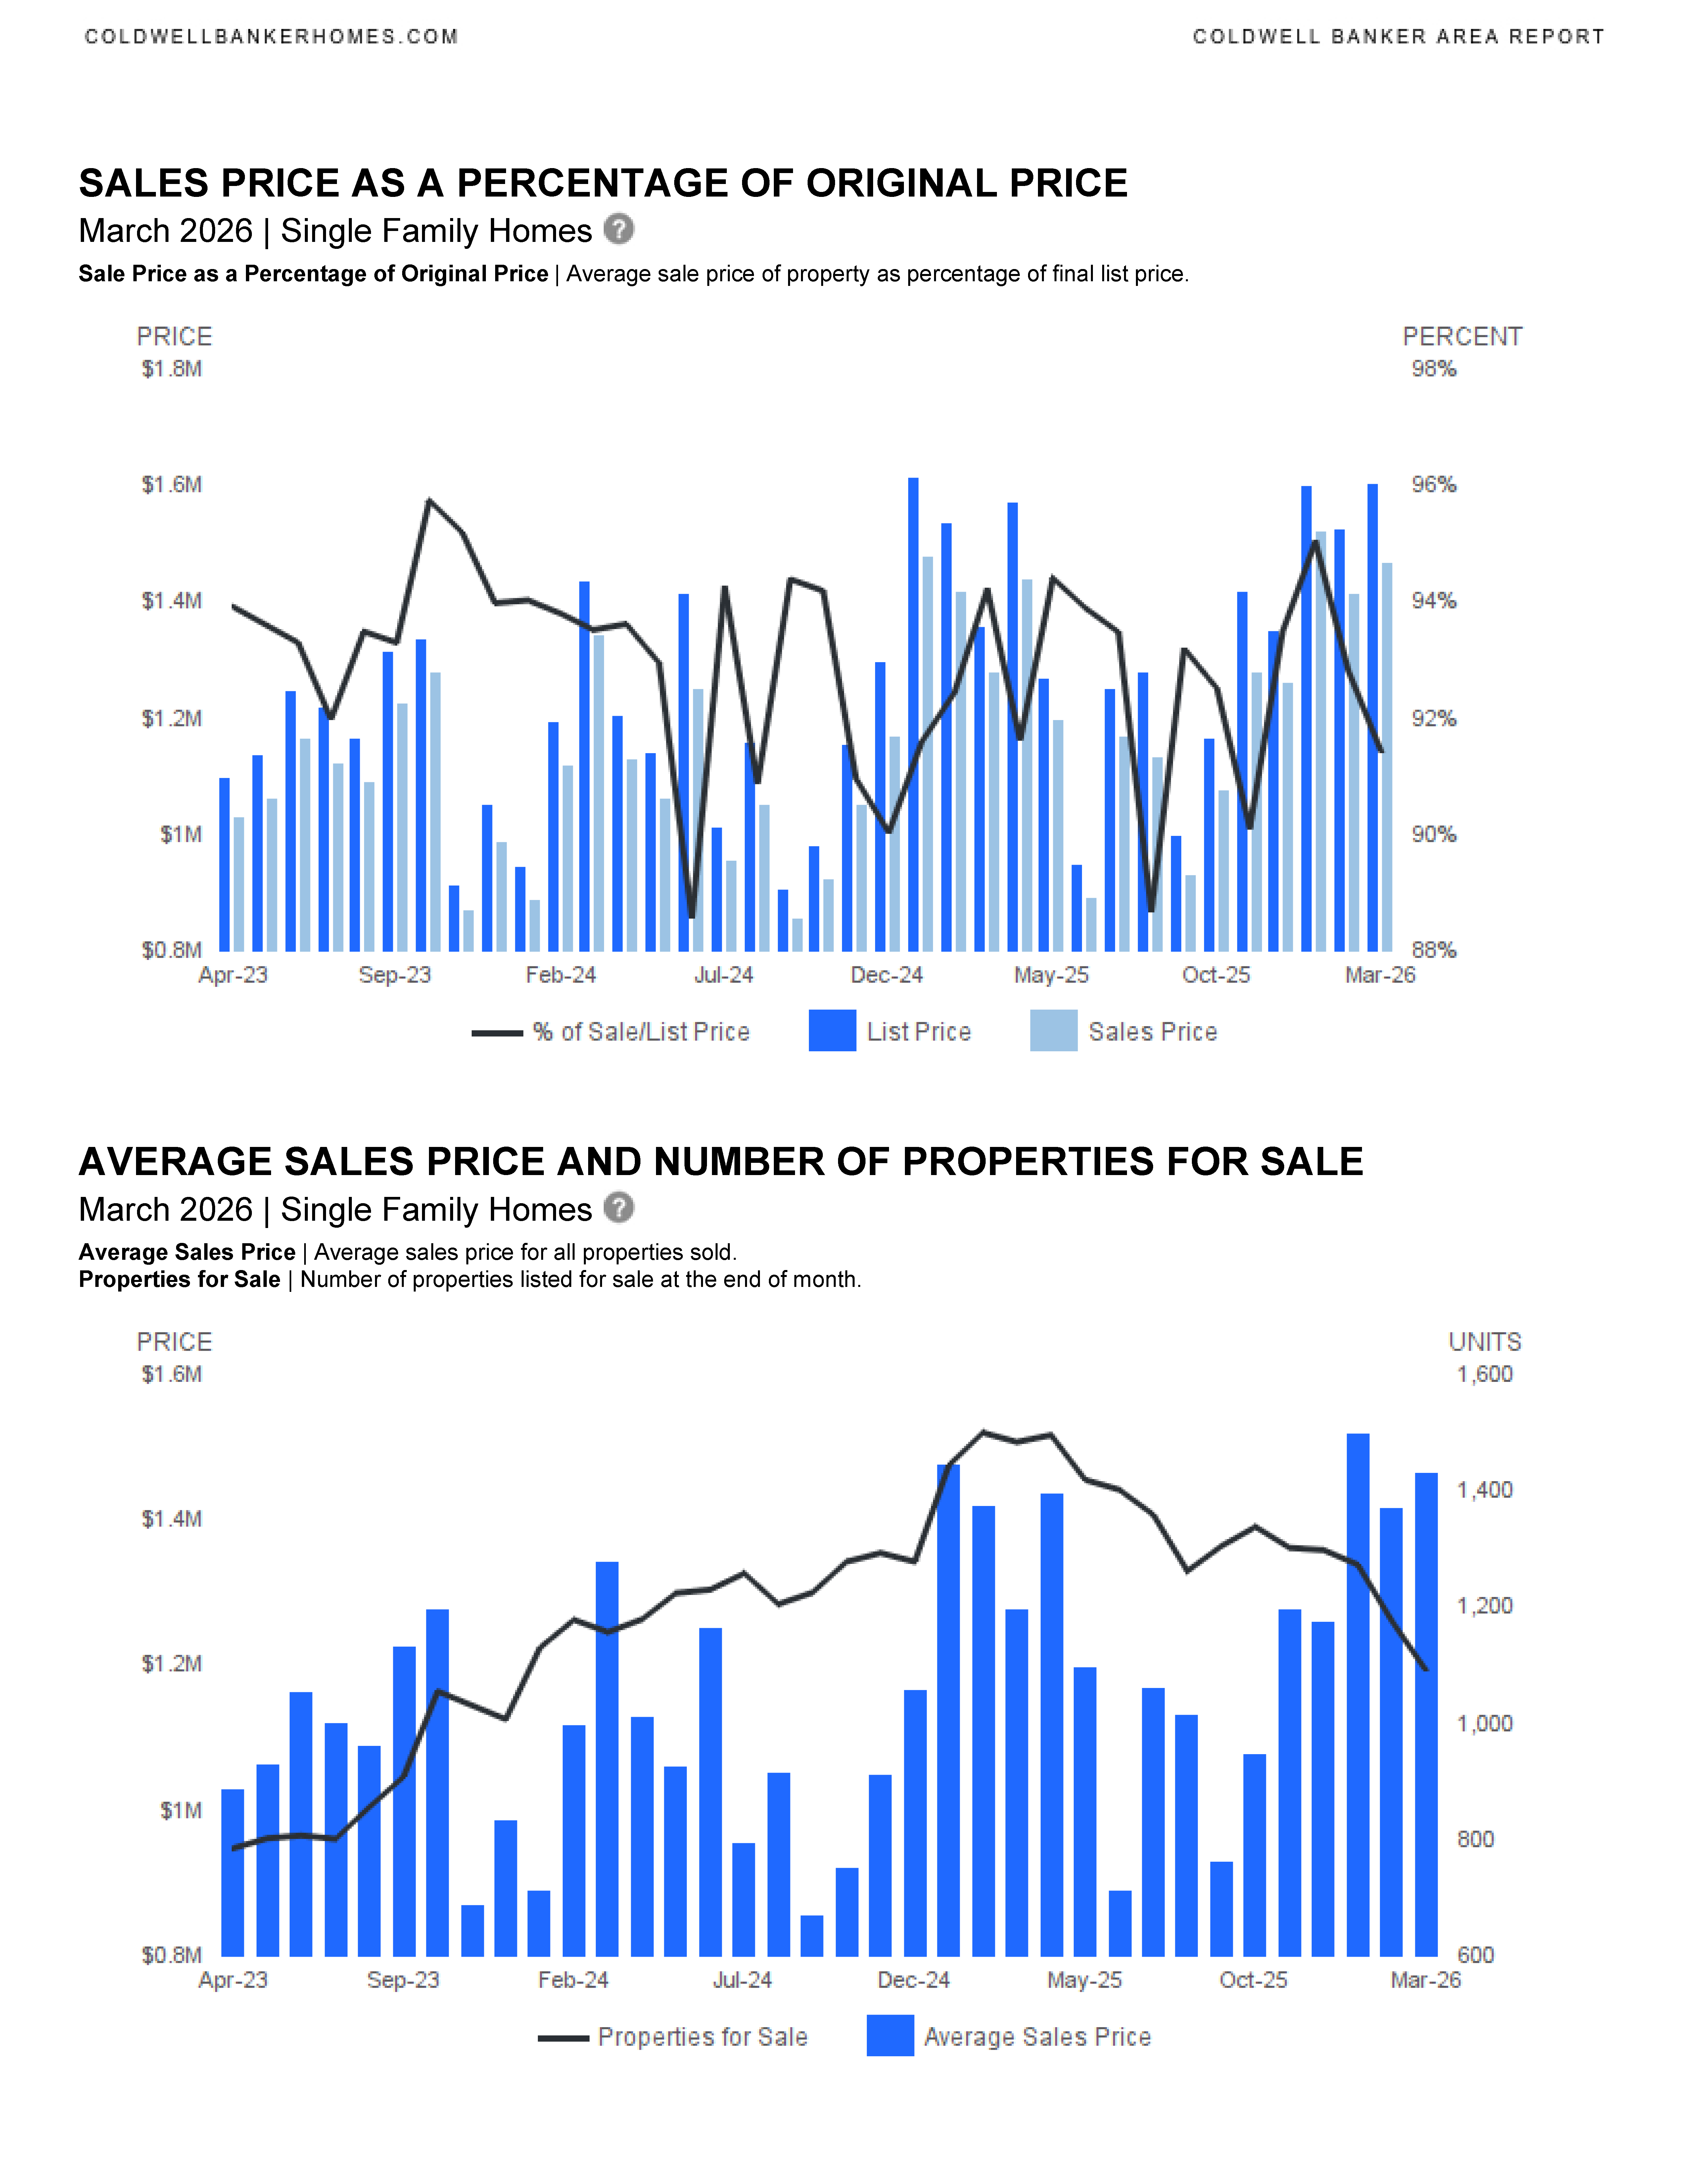
- Pricing adjustments evident:
- List-to-sold price ratio dipped to 94.1%
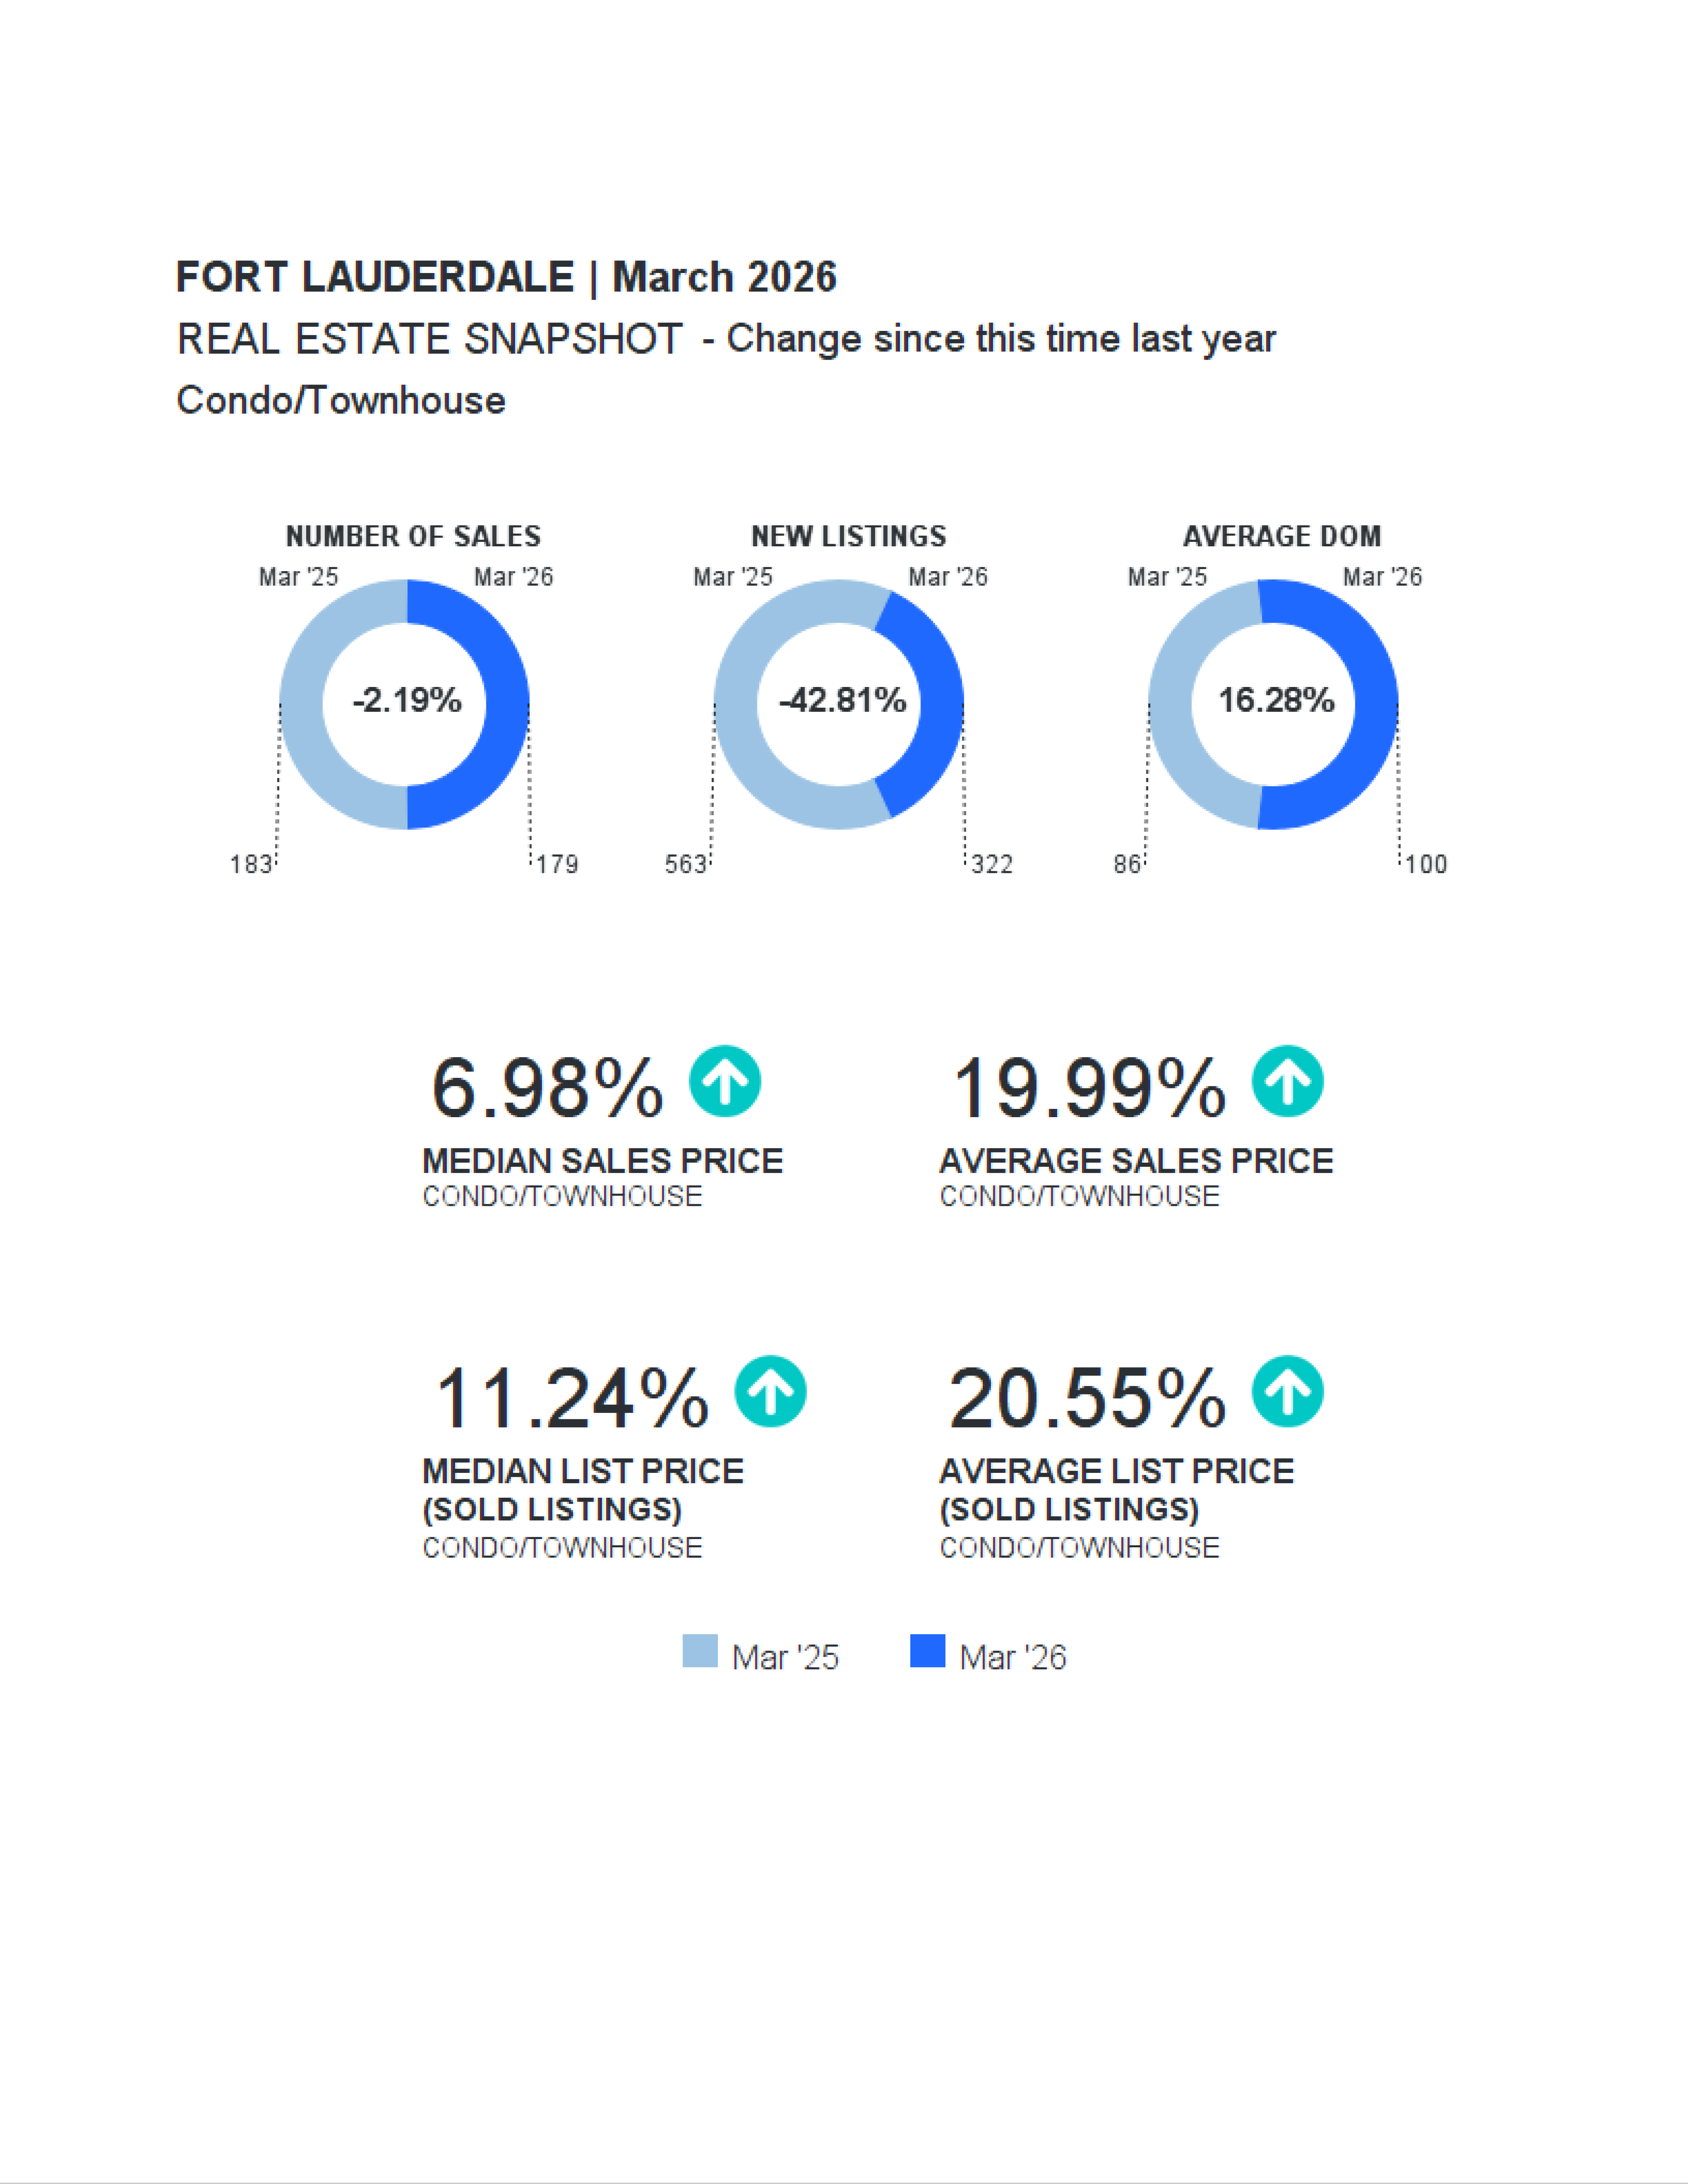
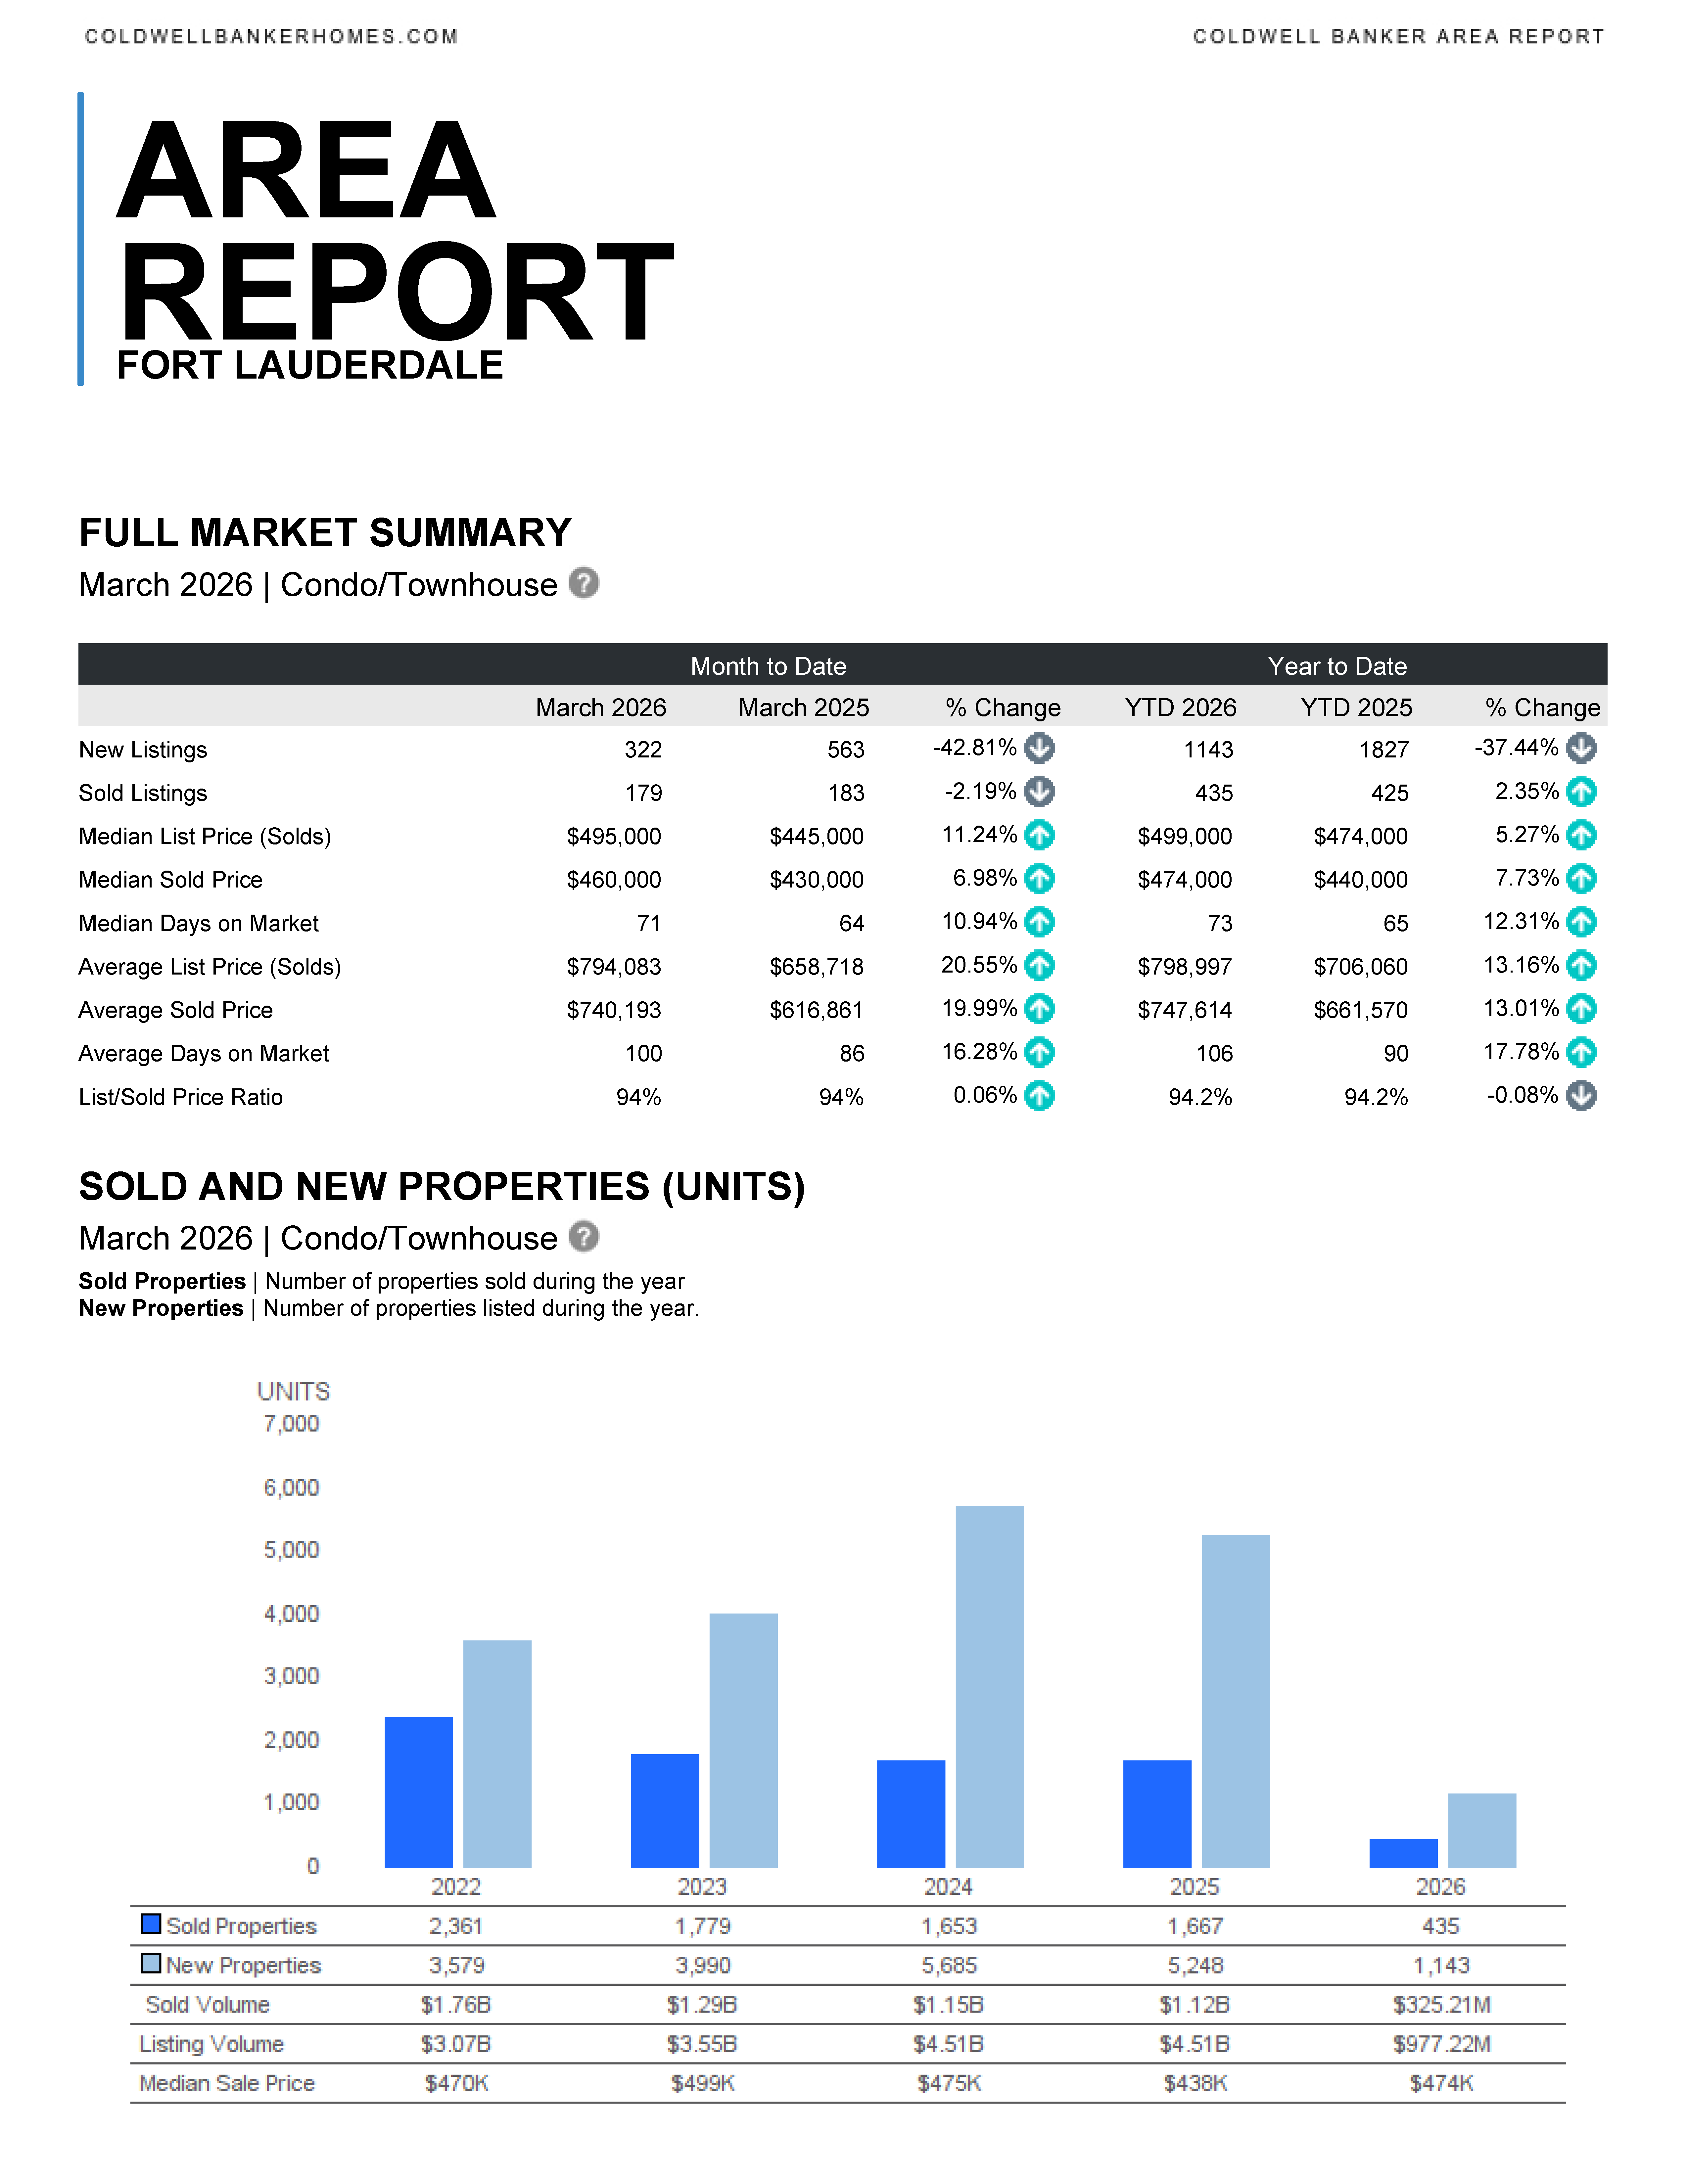
🏢 Condo & Townhome Market Highlights
- Inventory tightened significantly:
- New listings down 42.8% year over year
- Sales remained steady:
- 179 units sold (nearly flat vs. last year)
- Prices continue to rise:
- Median sold price: $460,000 (+7.0%)
- Average sold price: $740,193 (+20.0%)
- Longer selling timelines:
- Median days on market increased to 71 days
- Stable pricing power:
- List-to-sold price ratio held at 94%
📊 Market Trends to Watch
- Inventory is constrained across both property types, especially condos
- Buyers are taking more time, signaling a more balanced market
- Luxury and higher-priced segments remain resilient
- Price growth is strongest in the condo/townhome sector
✅ Quick Market Takeaway
The Fort Lauderdale real estate market in March 2026 reflects a shift toward balance. Fewer new listings and longer days on market indicate cooling momentum, yet strong sales activity and rising average prices—especially in condos—show continued buyer confidence. Sellers benefit most when homes are priced strategically, while buyers are gaining slightly more negotiating power.


In this housing market in SE Florida, you need to work with an experienced and knowledgeable real estate professional. Please contact me if you would like to be sent updated market reports for YOUR specific neighborhood, Fort Lauderdale, or another SE Florida city. We can discuss the market, current trends and how we can work together to accomplish your real estate goals. I am here to help.
CONTACT ANNETTE
Let’s start working together!
Annette Dammeyer, REALTOR®, ABR®, AHWD®
Coldwell Banker Realty
901 E Las Olas Blvd STE 101, Fort Lauderdale, FL 33301
808.747.3686
SL 3535792
Fort Lauderdale February 2026 Area Report
Fort Lauderdale February 2026 real estate statistics have been published.
Fort Lauderdale Area Reports
Single Family Homes
Condominium & Townhouses
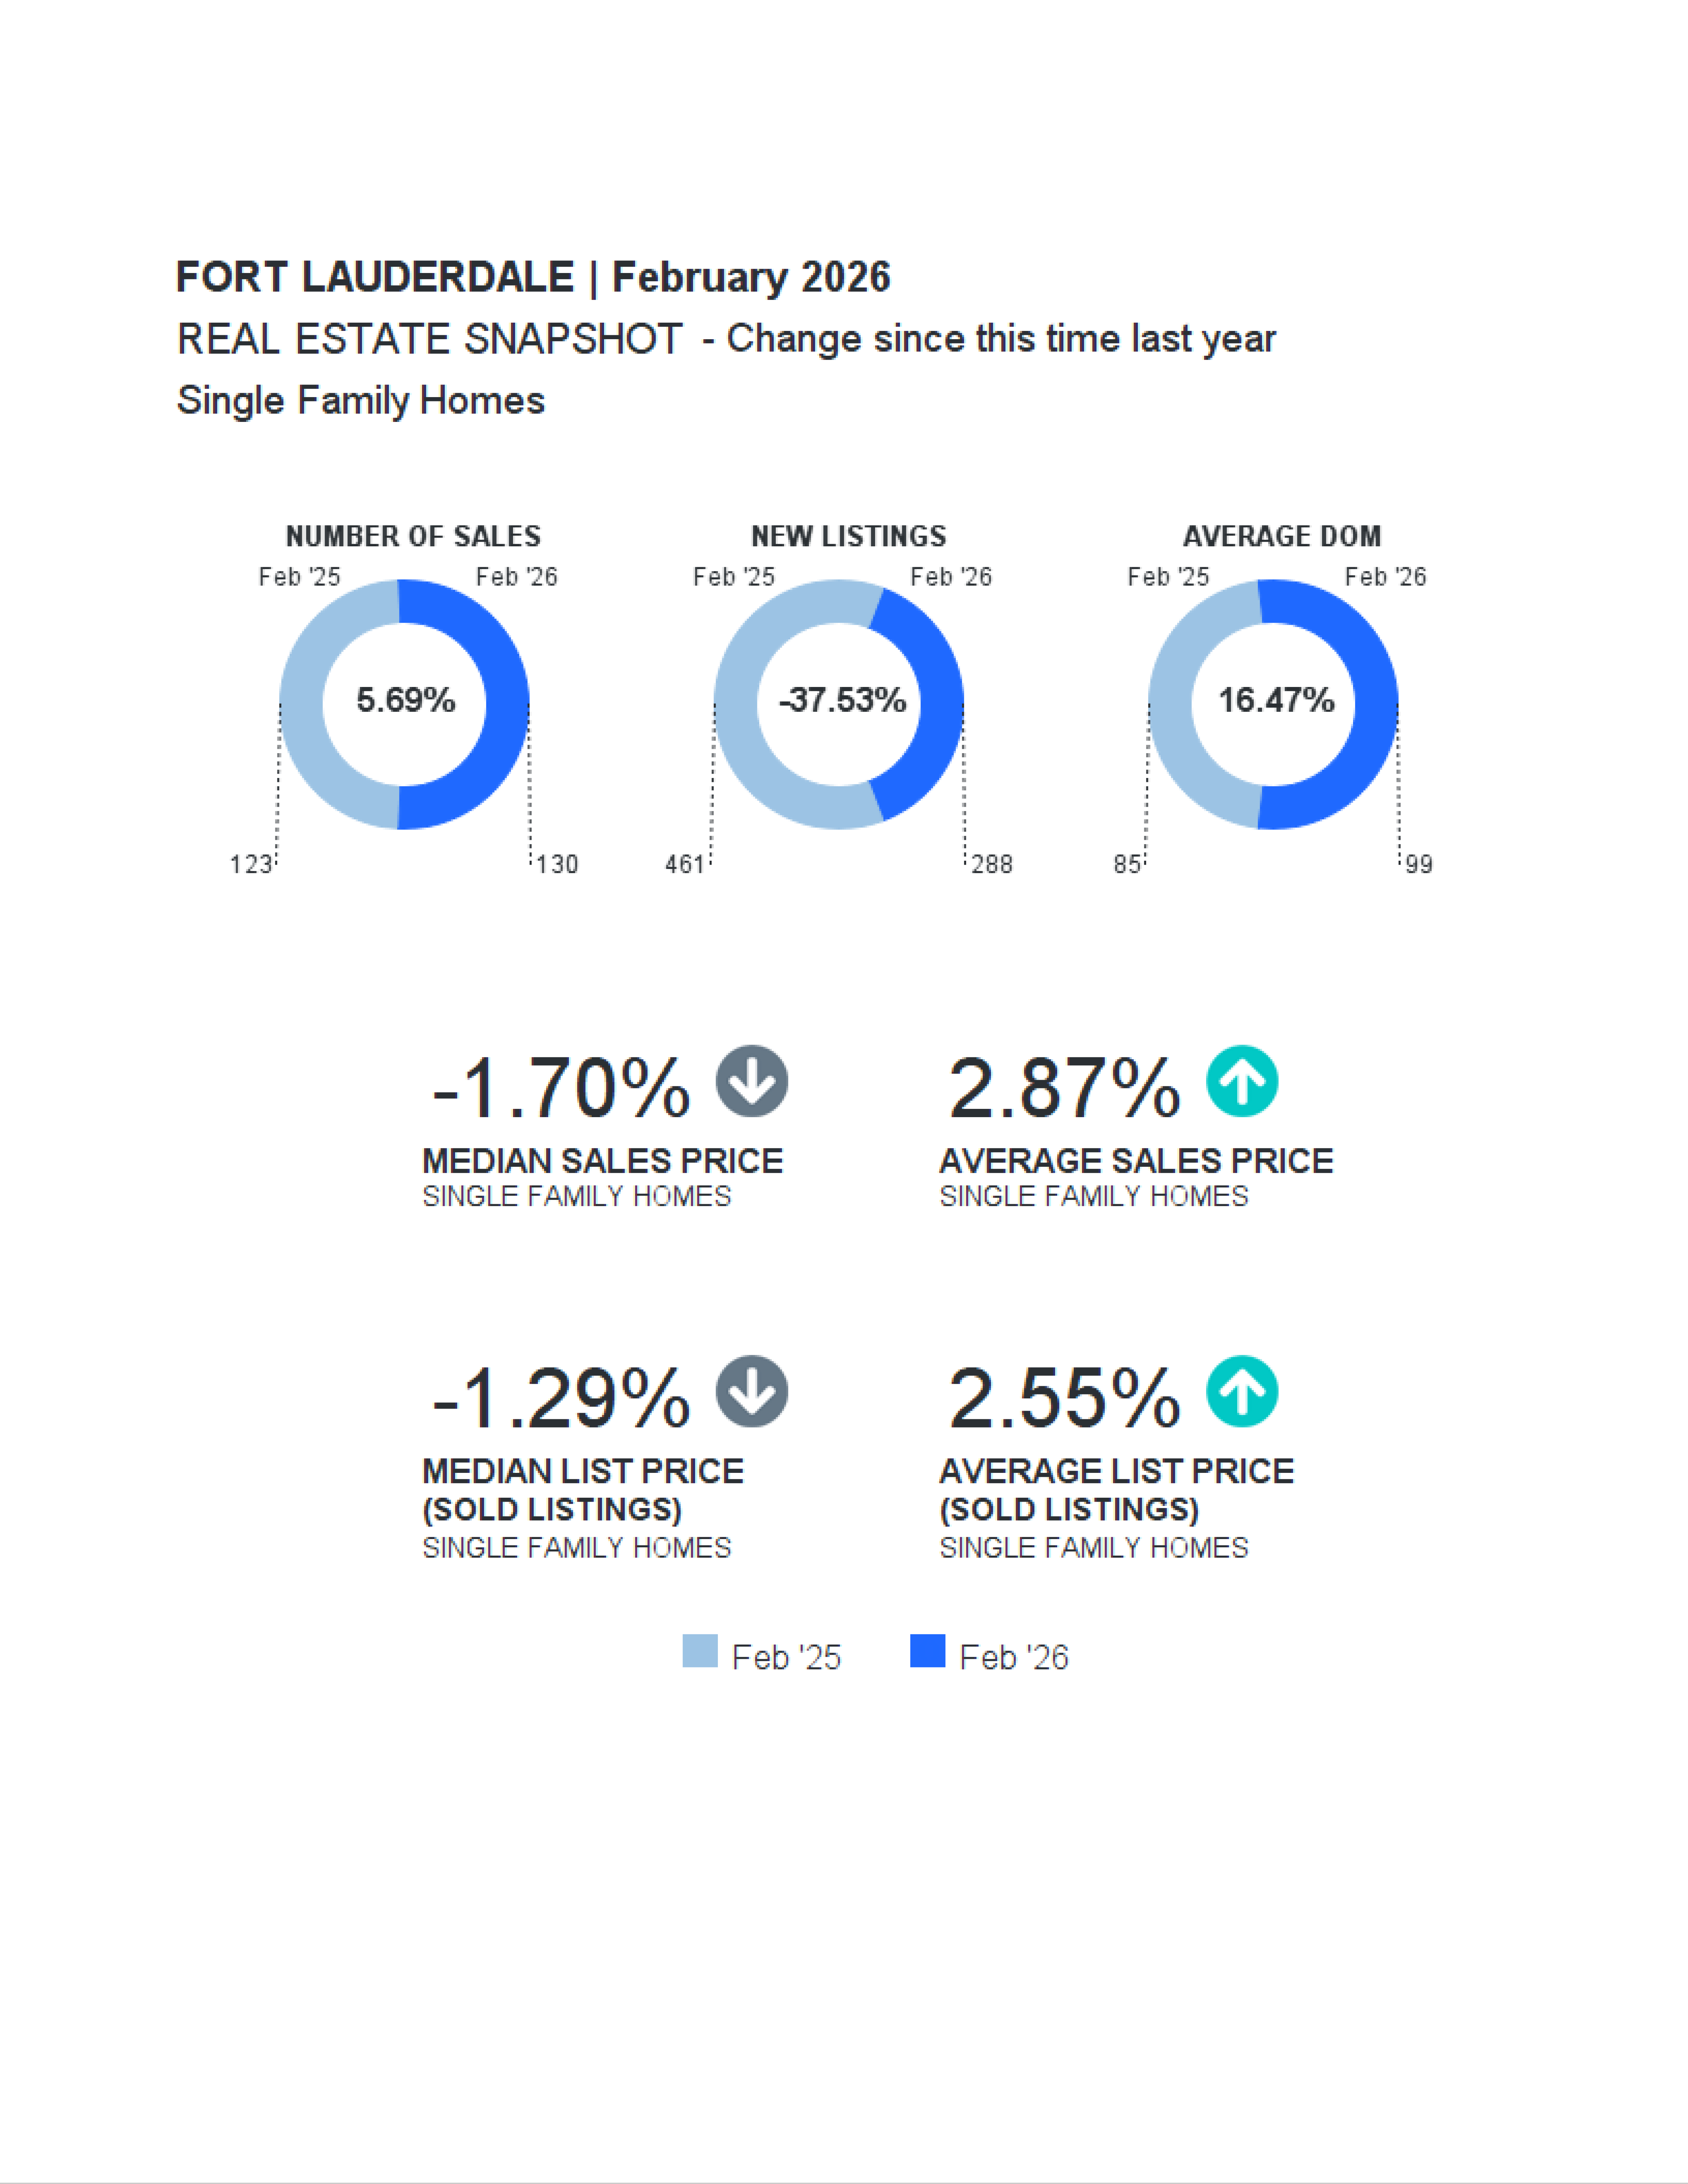
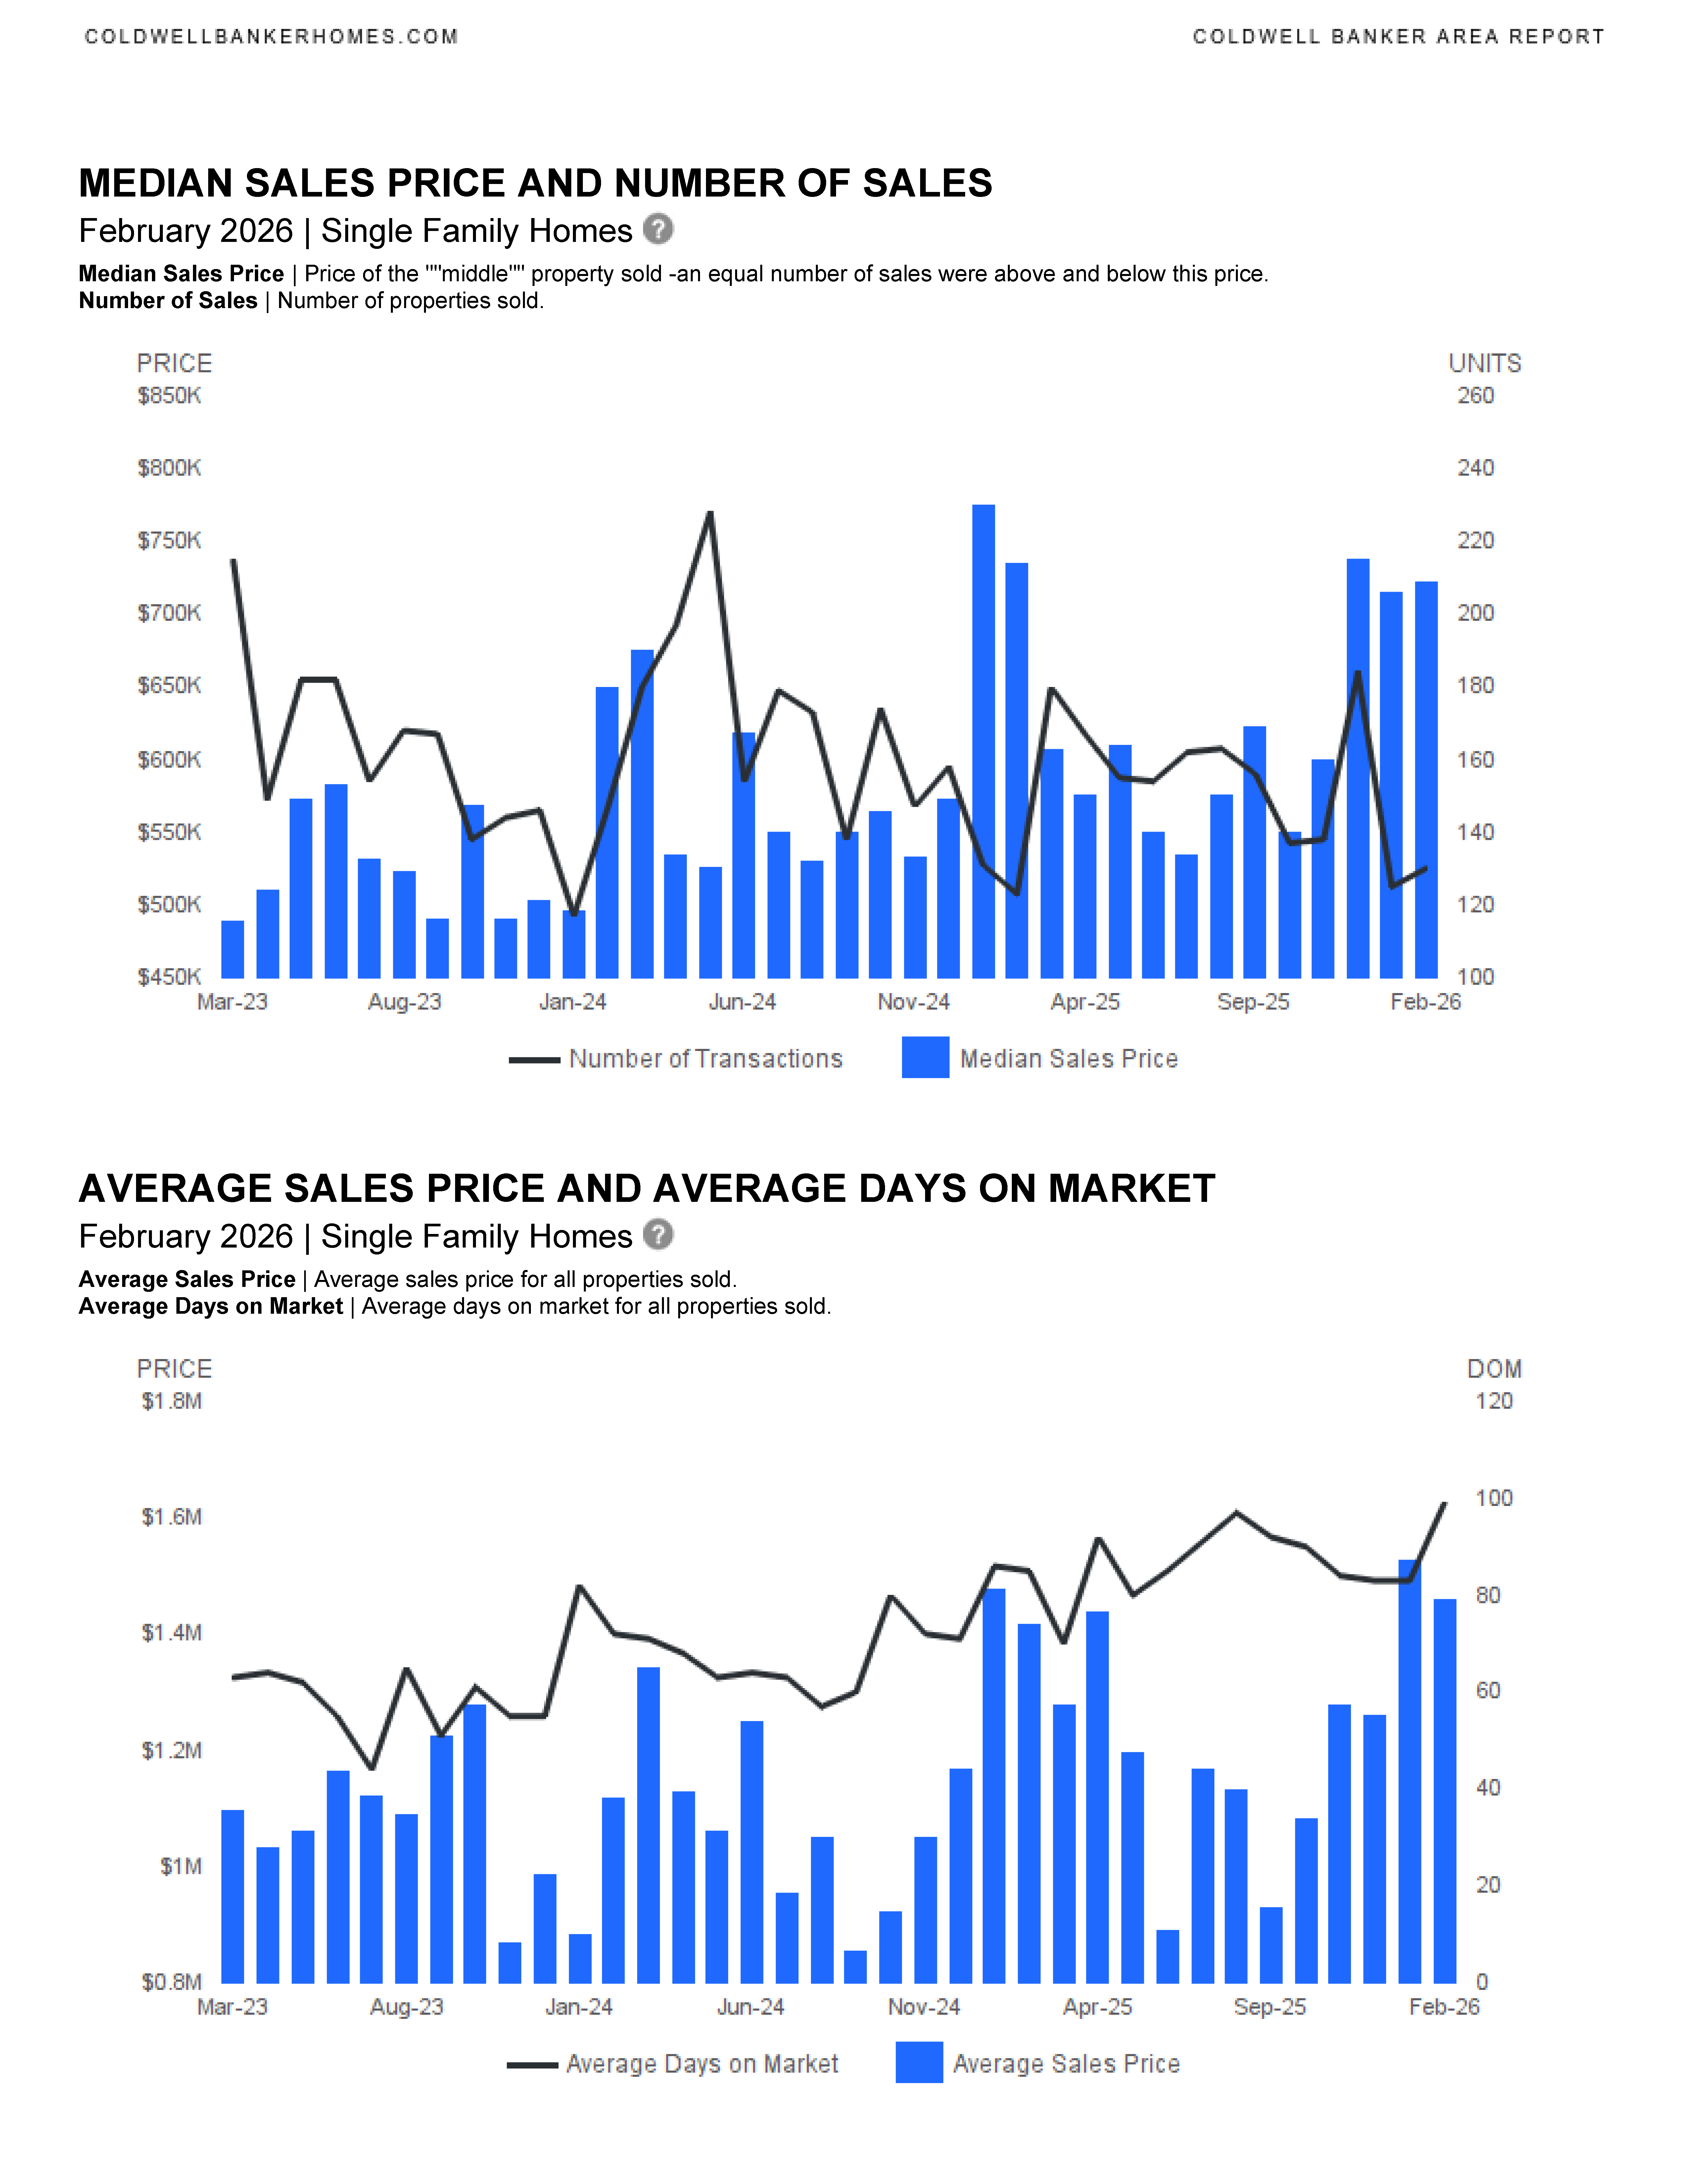
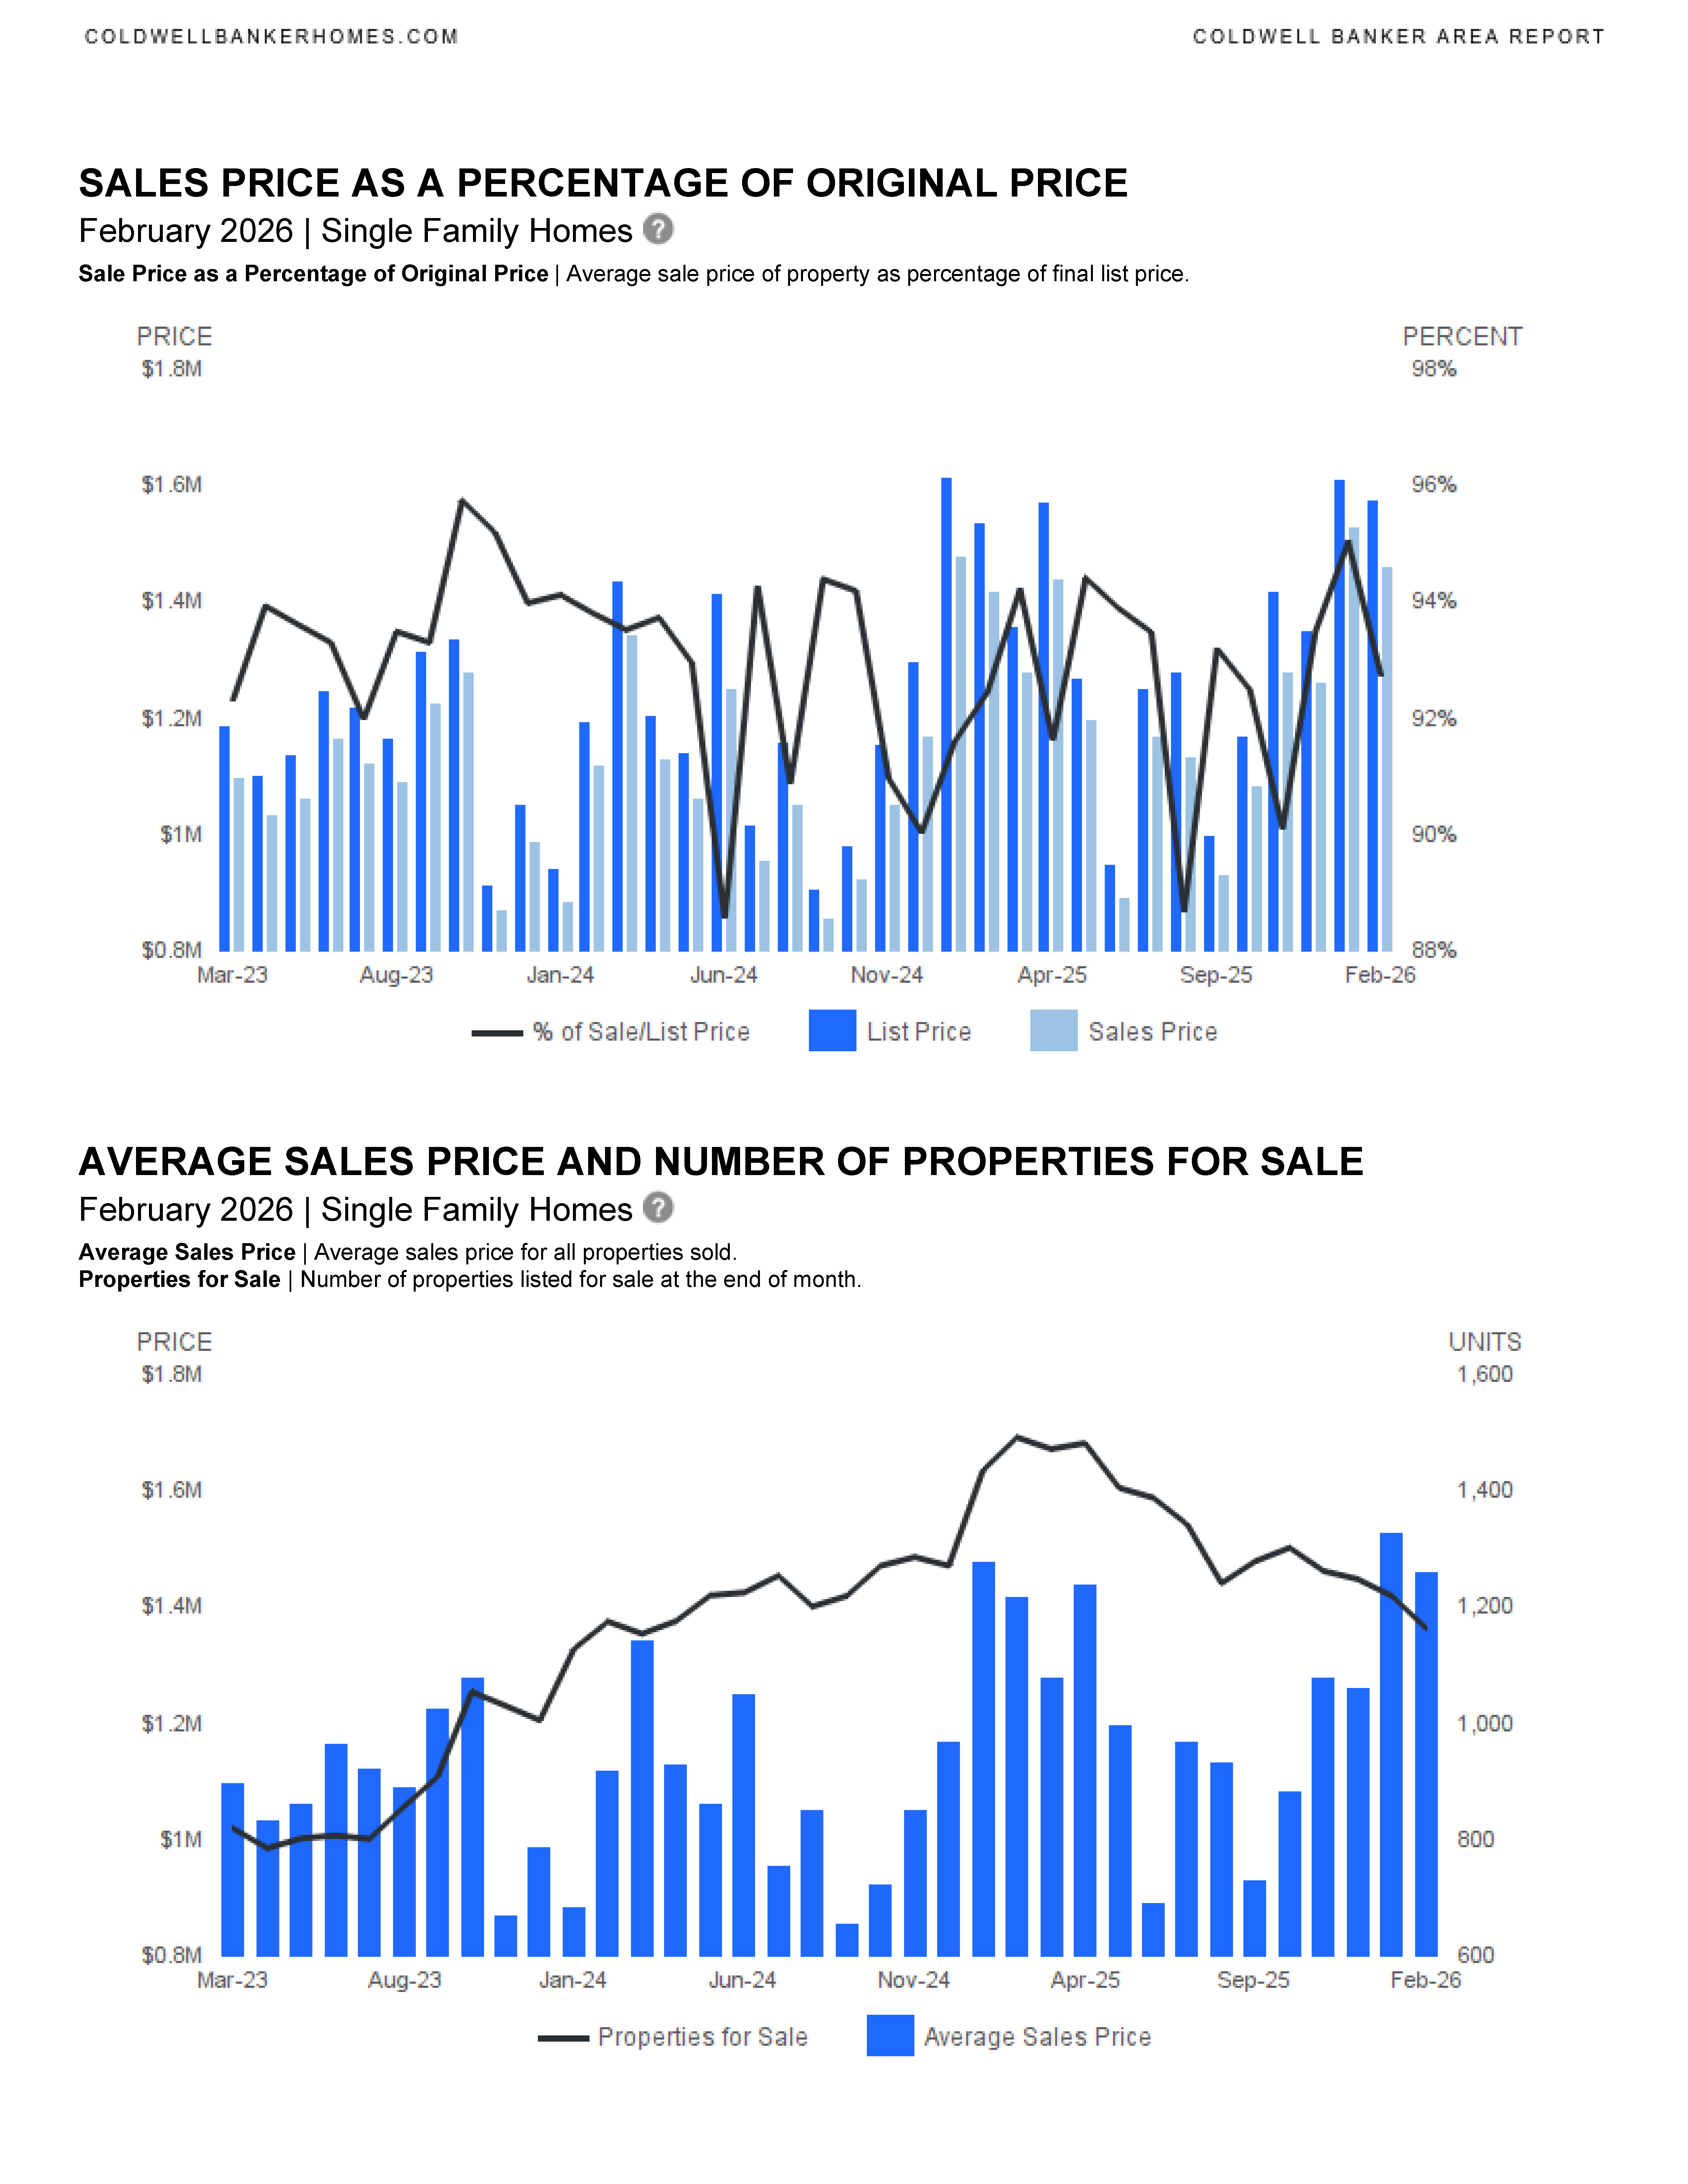
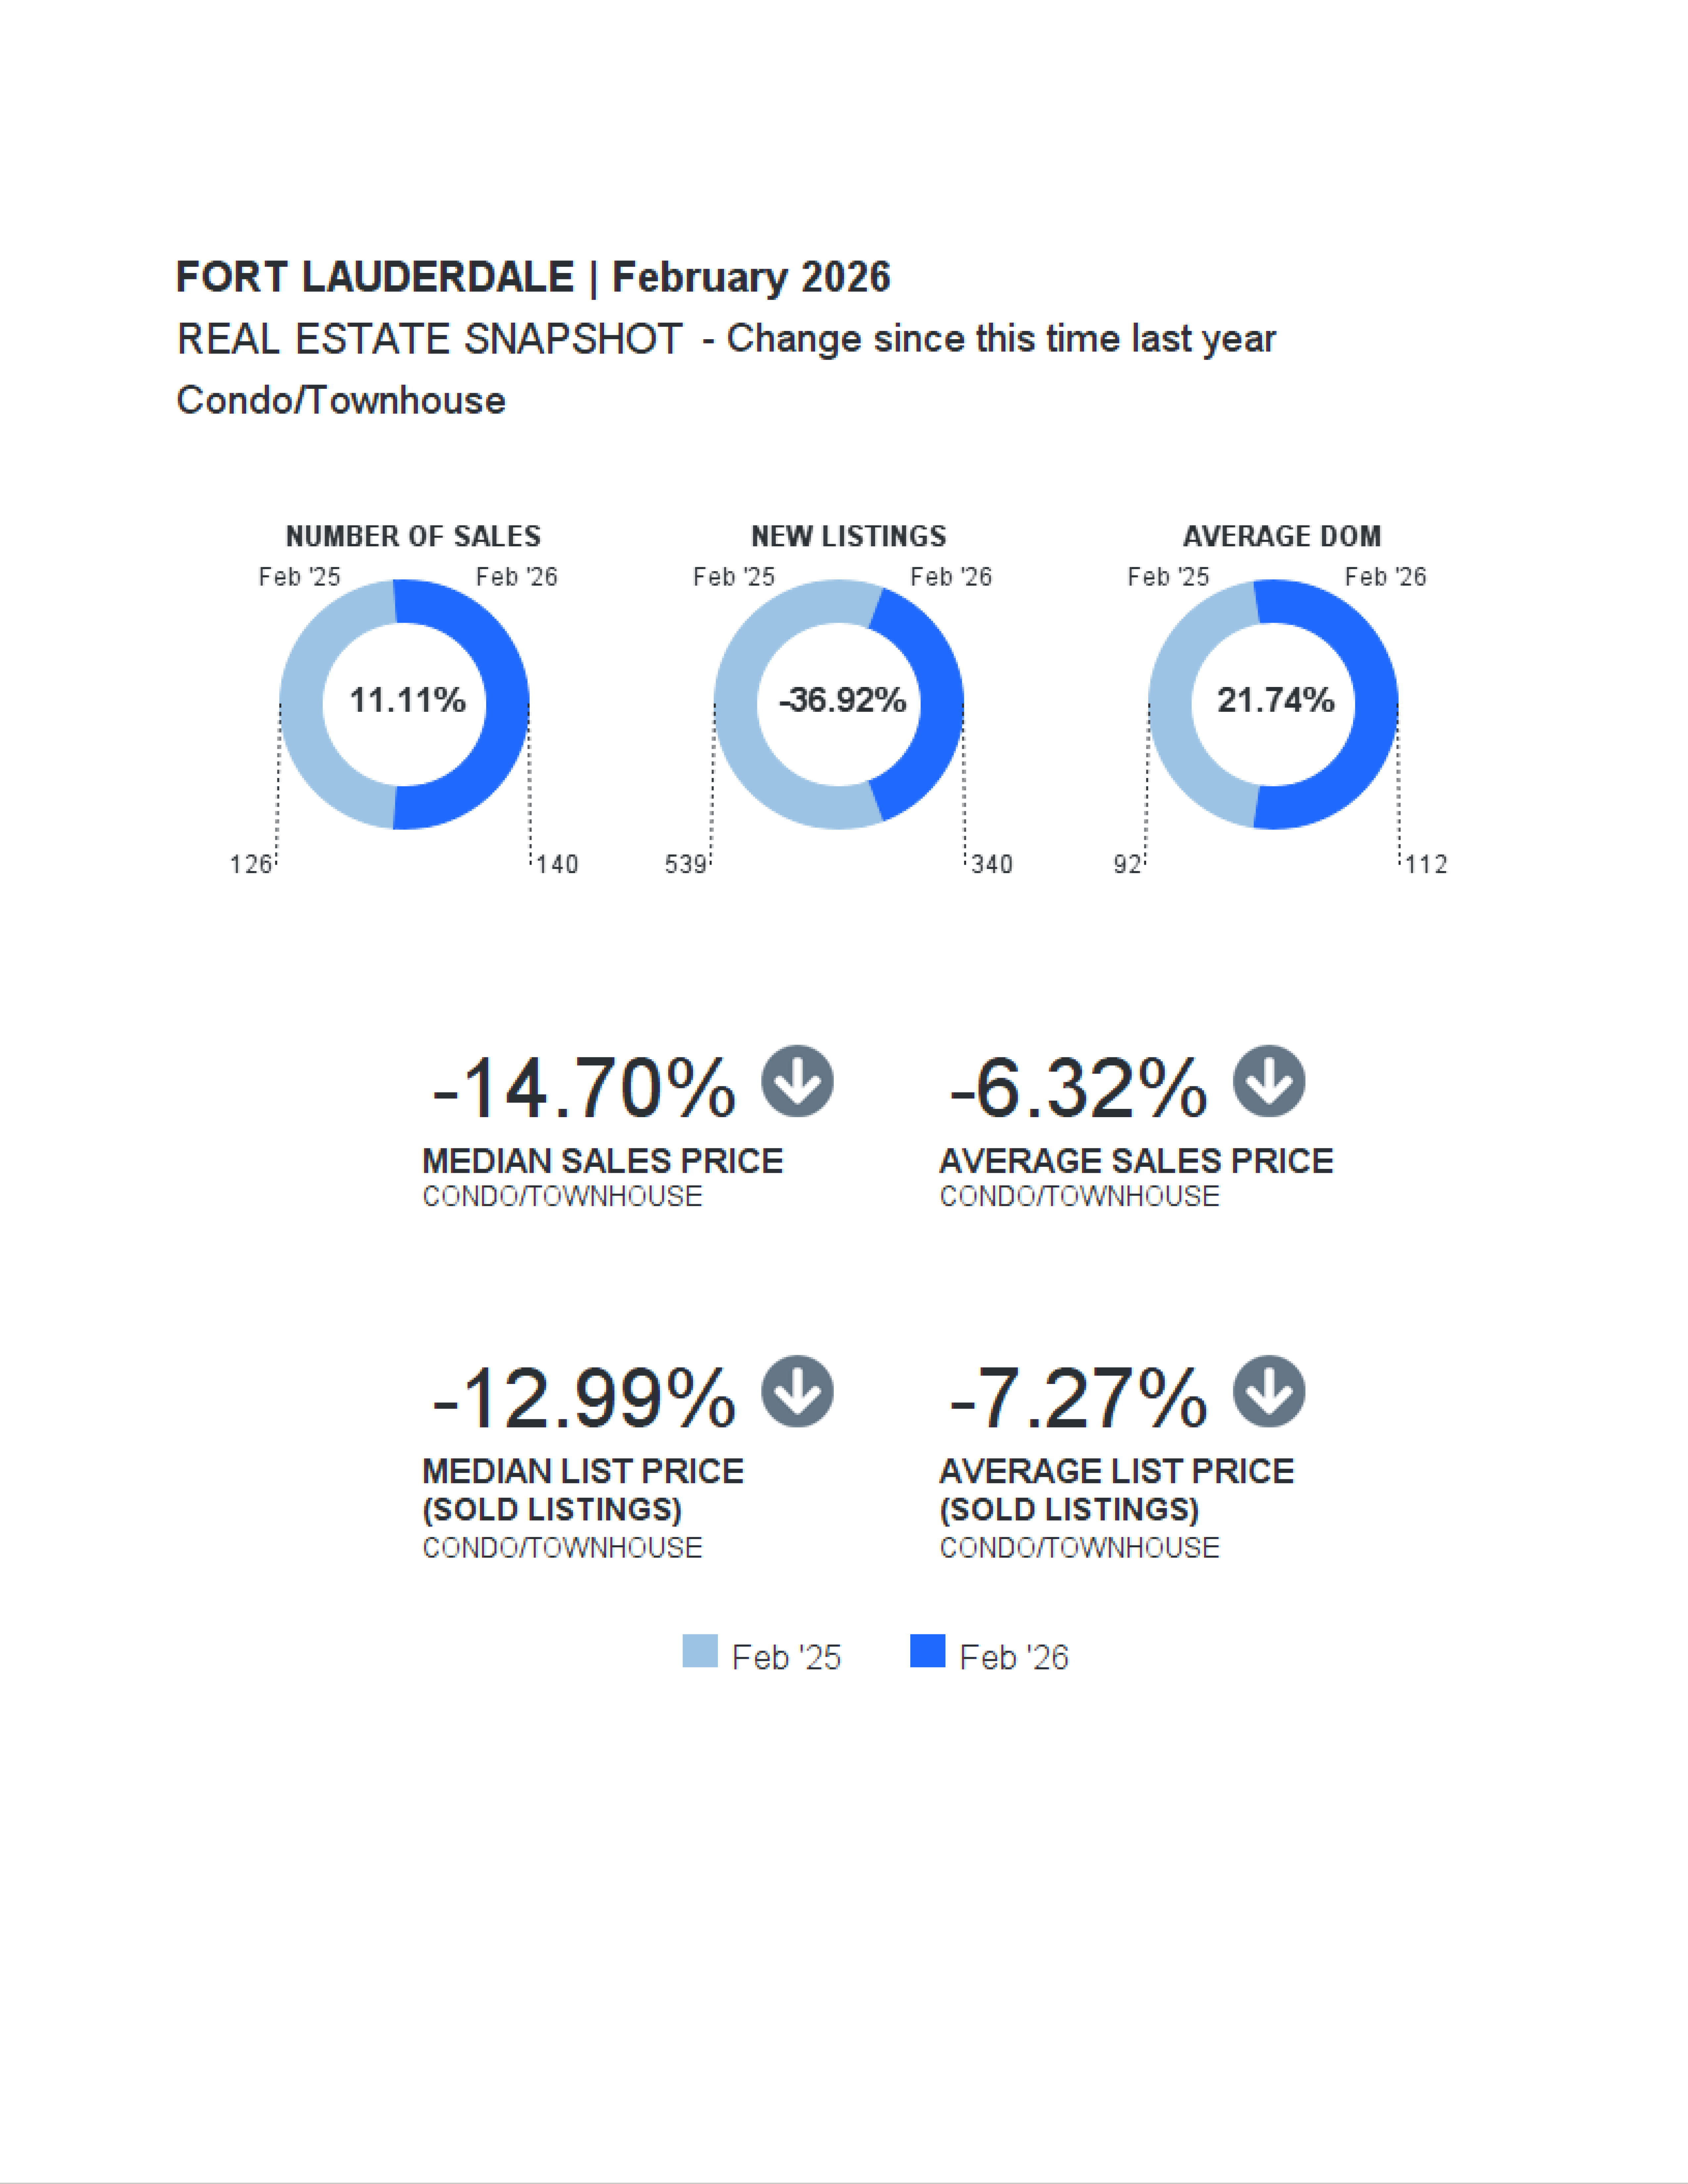
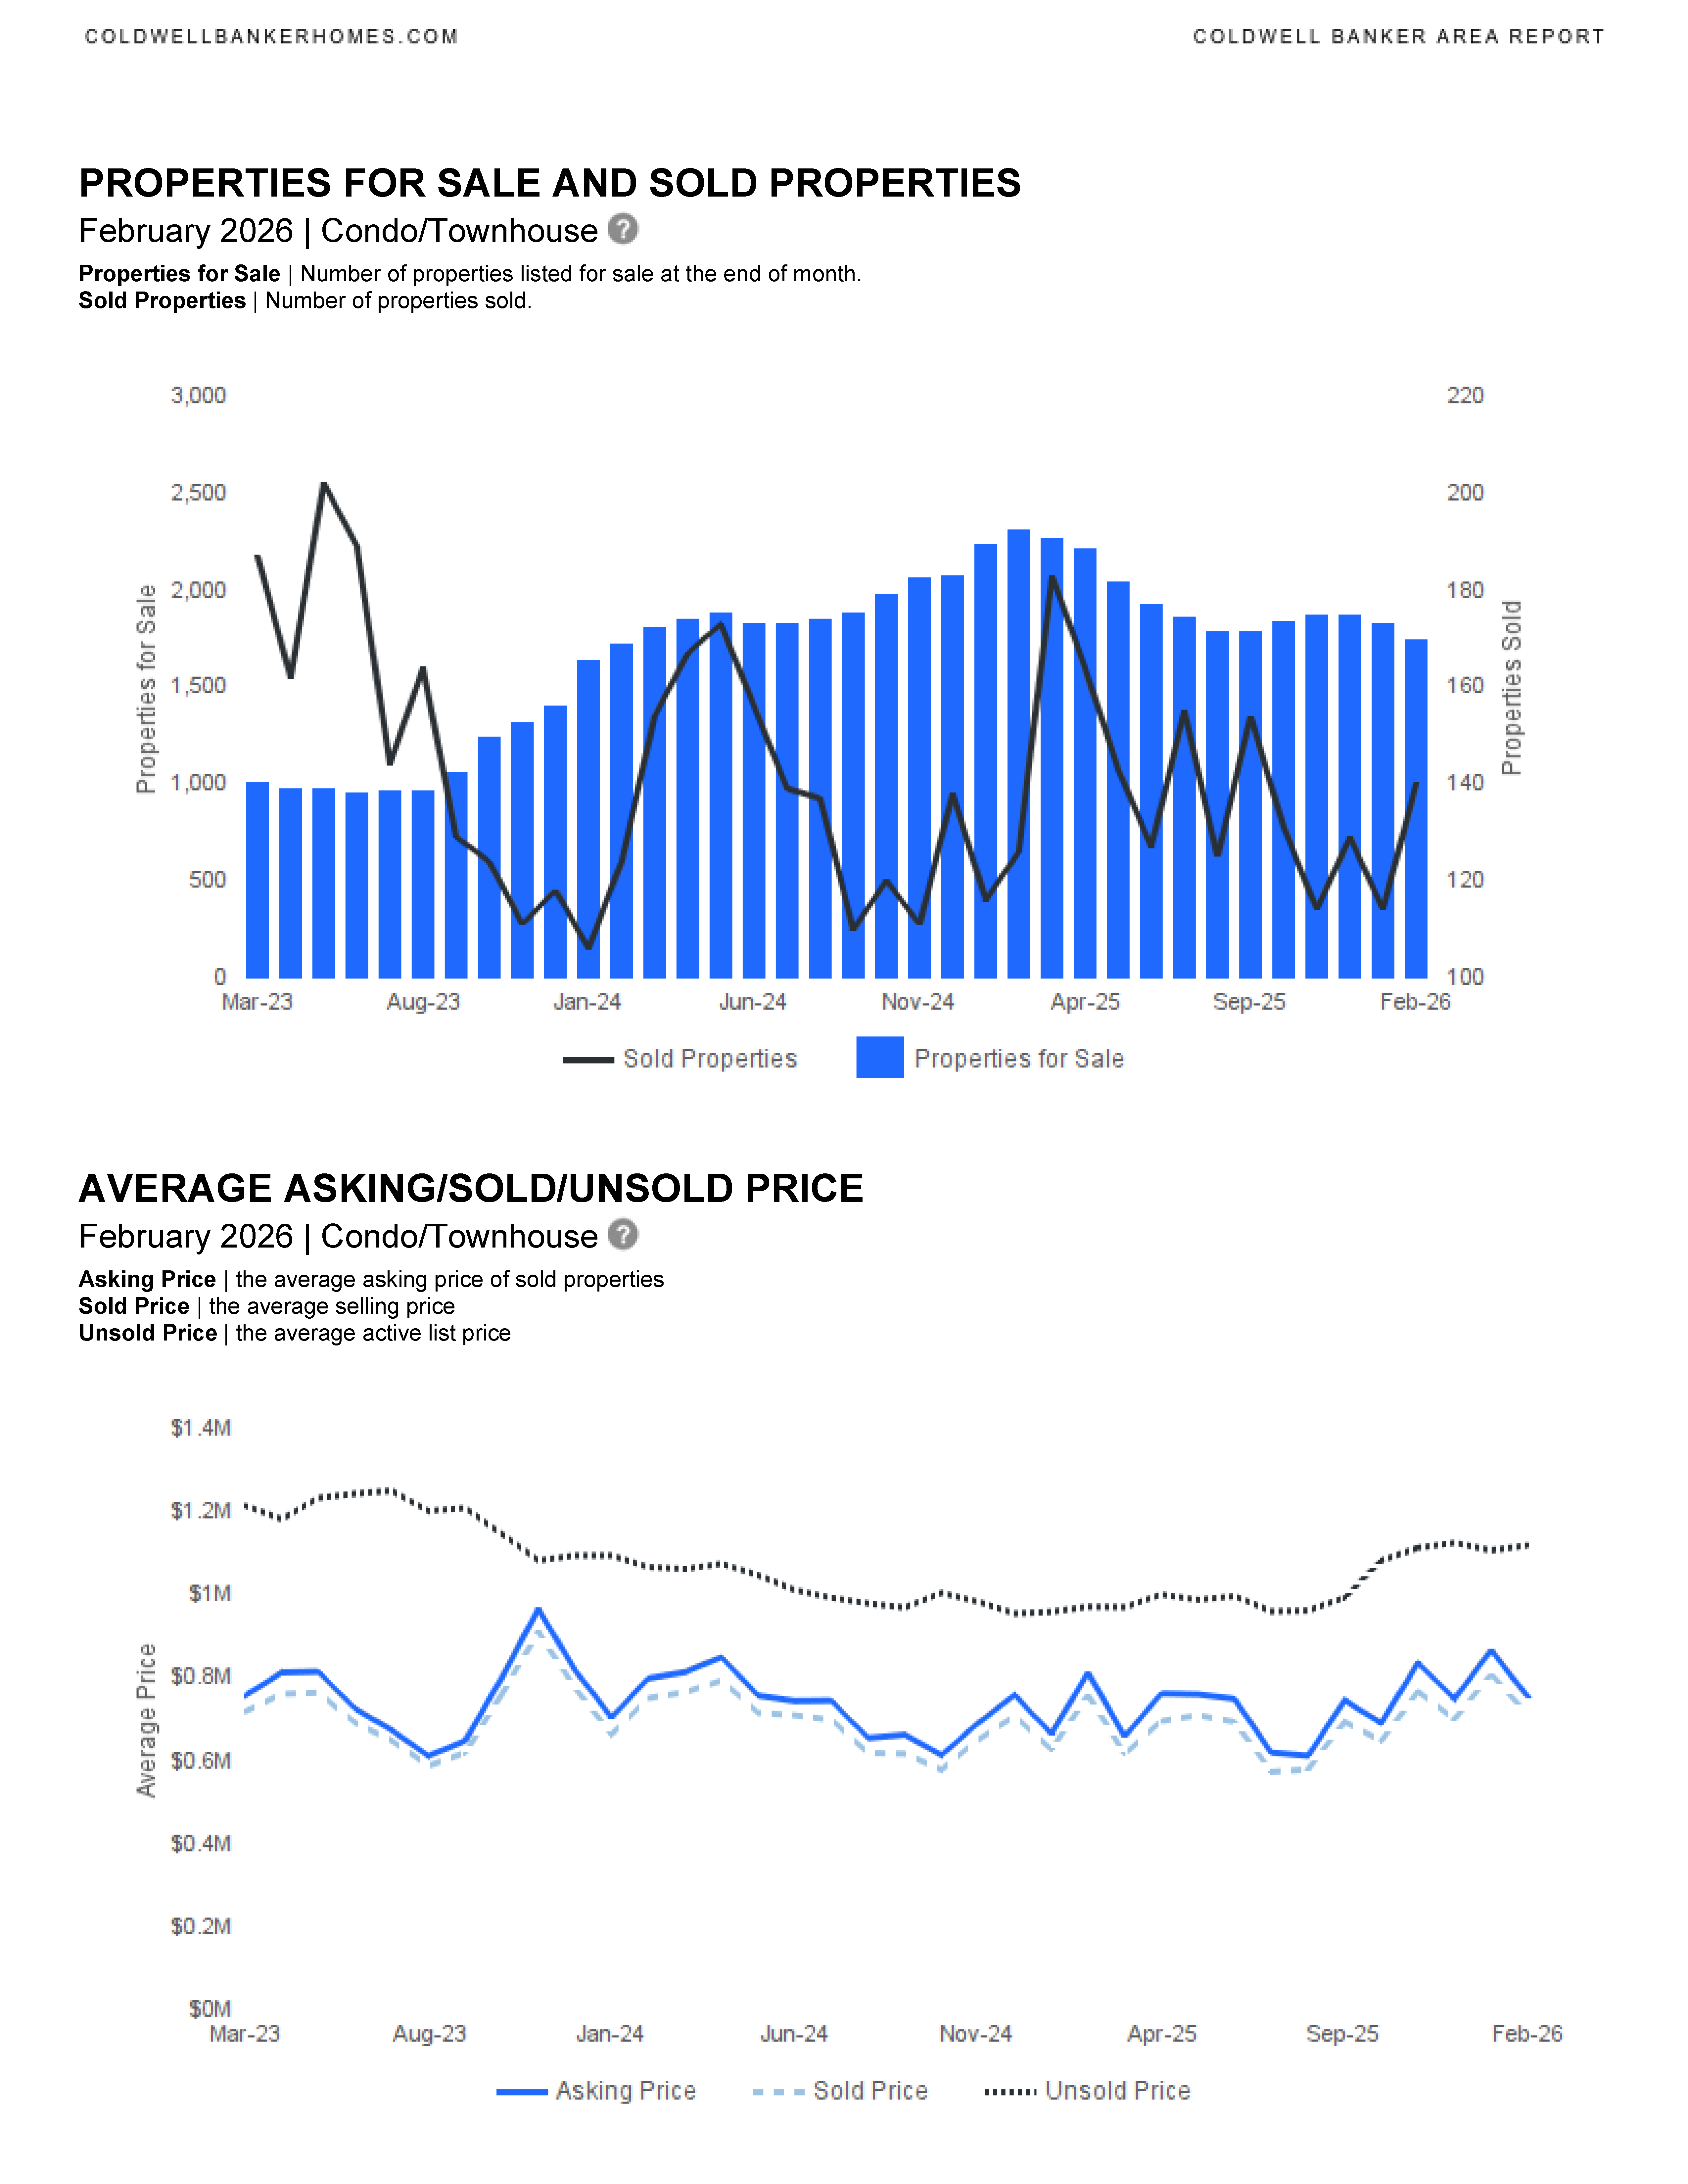
Fort Lauderdale Real Estate Market — February 2026
The February 2026 Fort Lauderdale real estate market shows contrasting trends between single-family homes and condos/townhomes, driven by declining inventory, shifting buyer behavior, and price stabilization.
Single-Family Homes
Inventory continues tightening, with new listings down 37.5% year-over-year (288 vs. 461). Despite fewer homes available, closed sales increased 5.7%, signaling strong buyer demand. Prices remained relatively stable:
- Median sold price: $722,500 (↓1.7%)
- Average sold price: $1.46M (↑2.87%)
- Median days on market: 51 (↓13.6%)
Sellers maintain an advantage in the mid‑to‑high‑end market, with a 94.9% list-to-sold ratio.
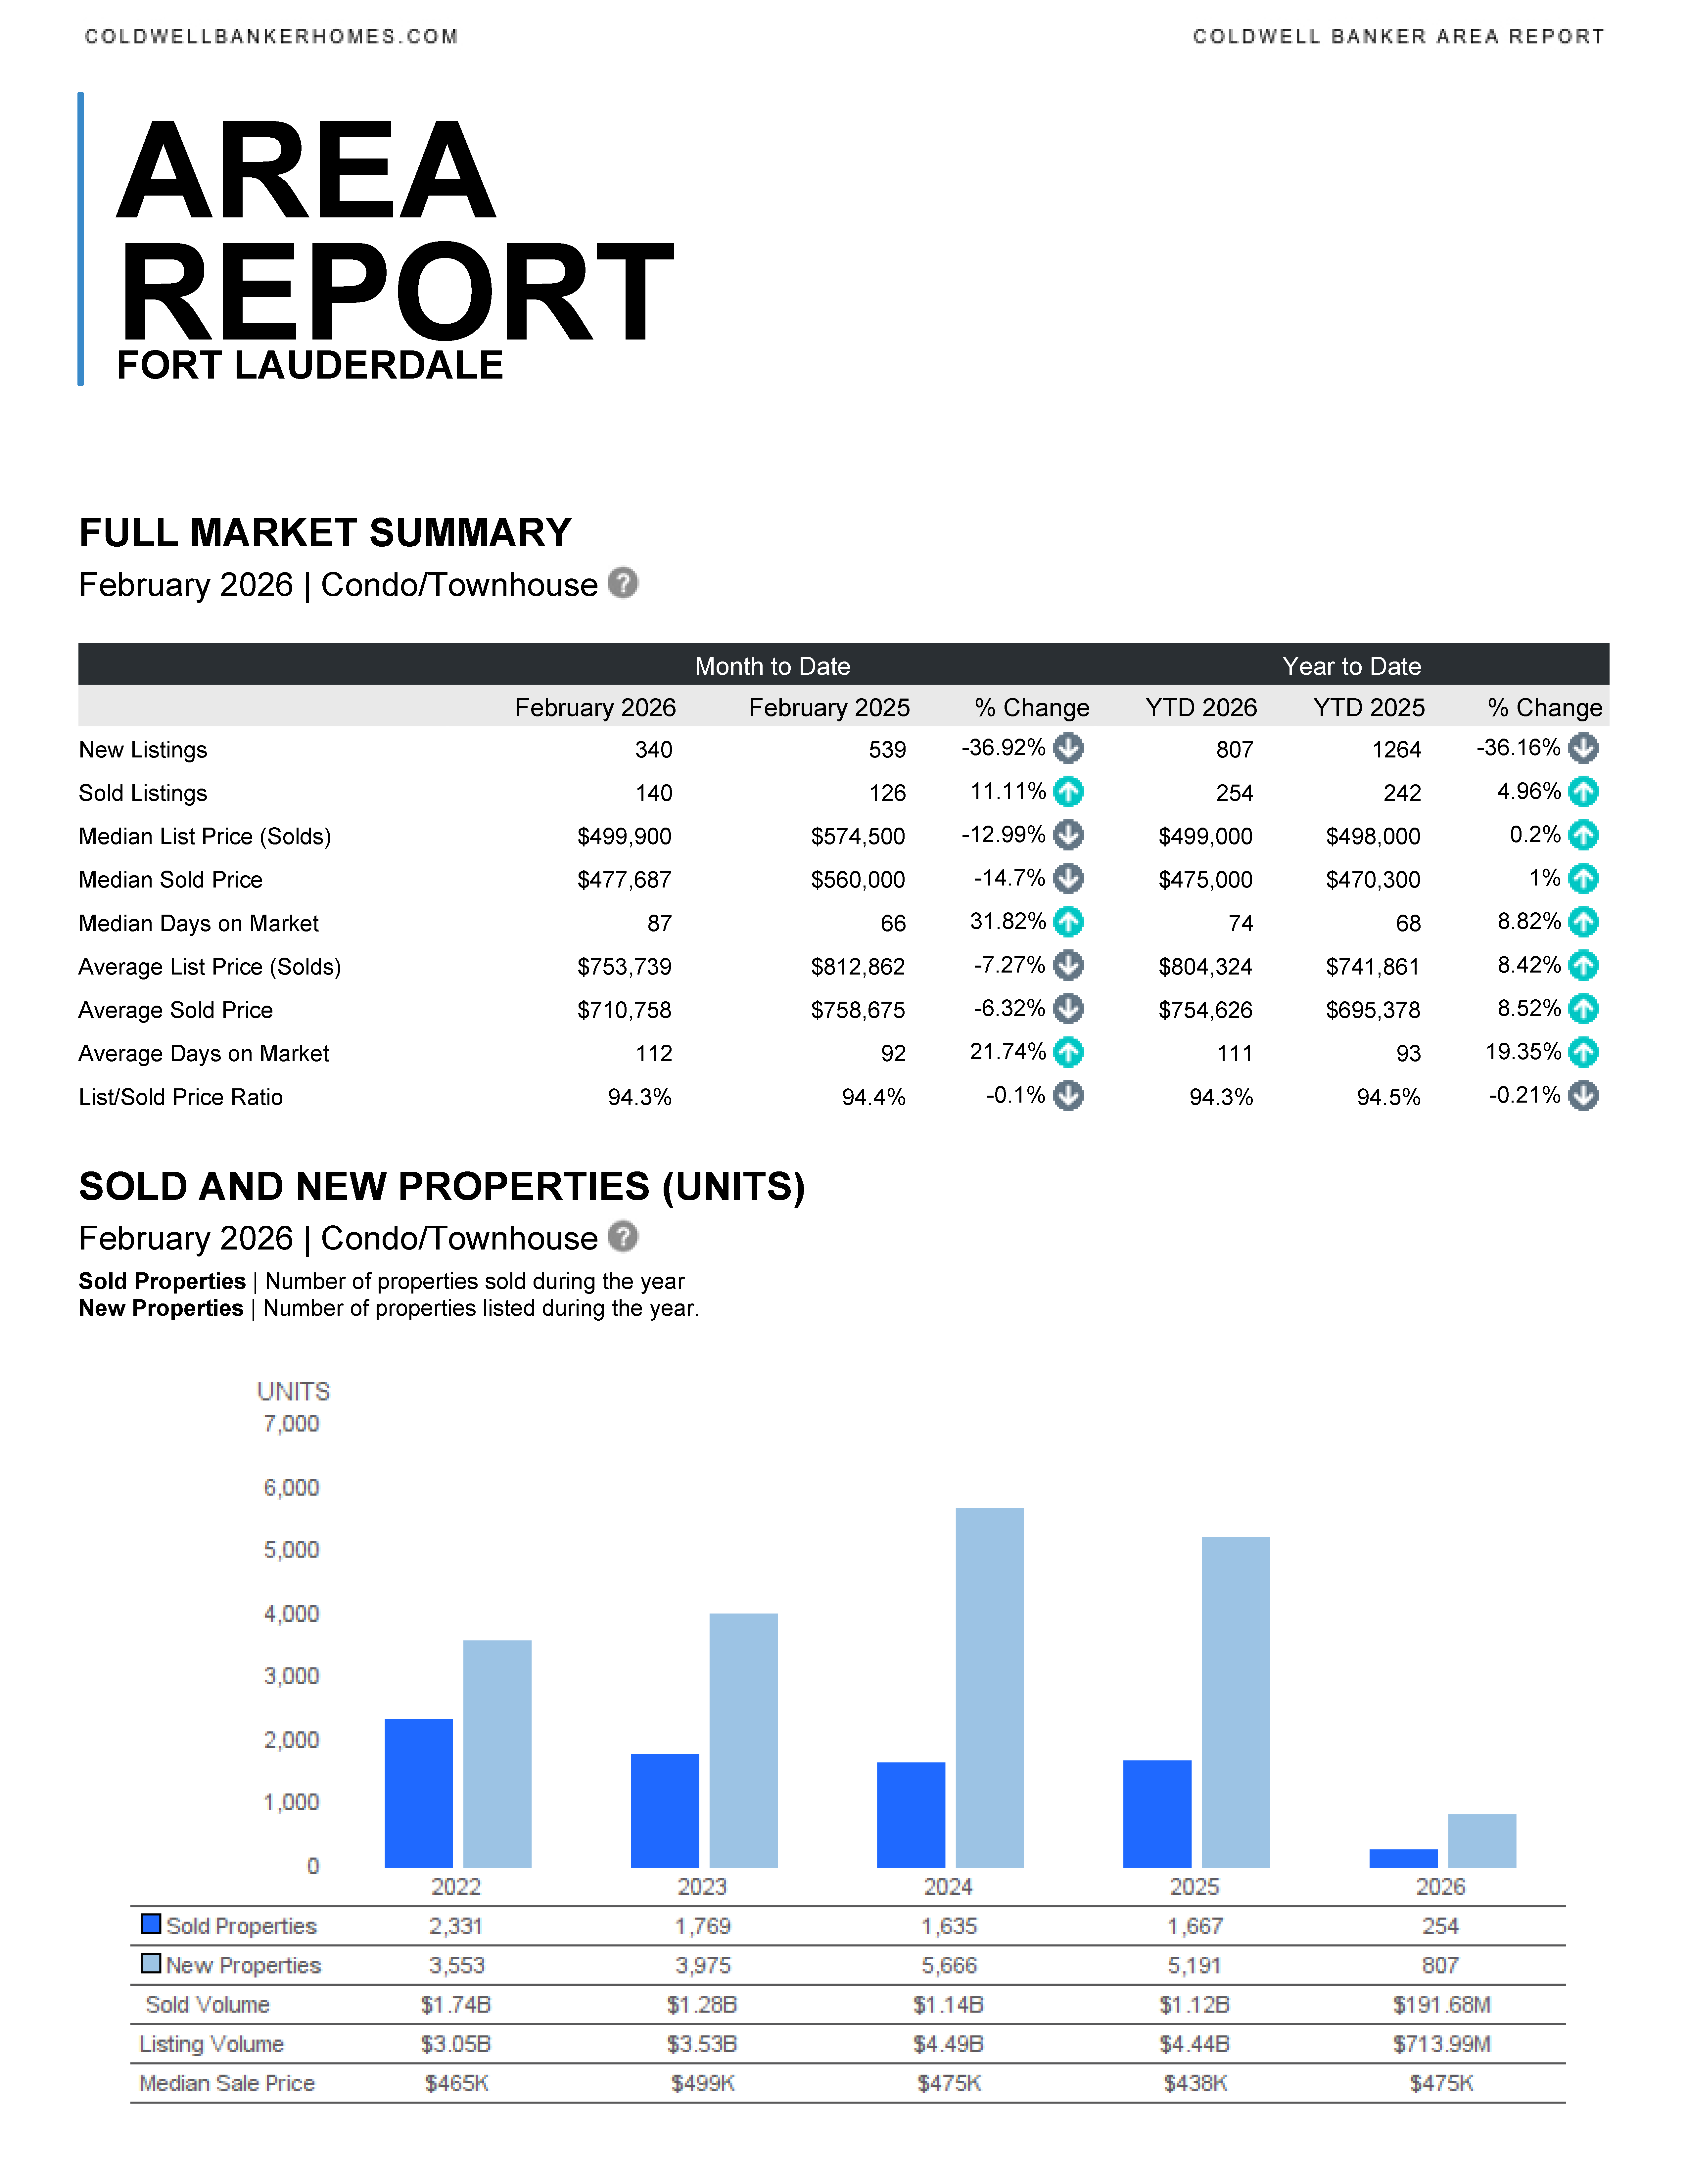
Condo / Townhome Market
The condo market also experienced a sharp decline in new listings (down 36.9%), but sales jumped 11.1% year-over-year, creating upward pressure in certain sub‑markets. Price activity was mixed:
- Median sold price: $477,687 (↓14.7%)
- Average sold price: $710,758 (↓6.3%)
- Days on market: 87 (↑31.8%)
While buyers have more negotiation power due to increasing DOM, the overall reduction in new listings indicates demand remains solid.
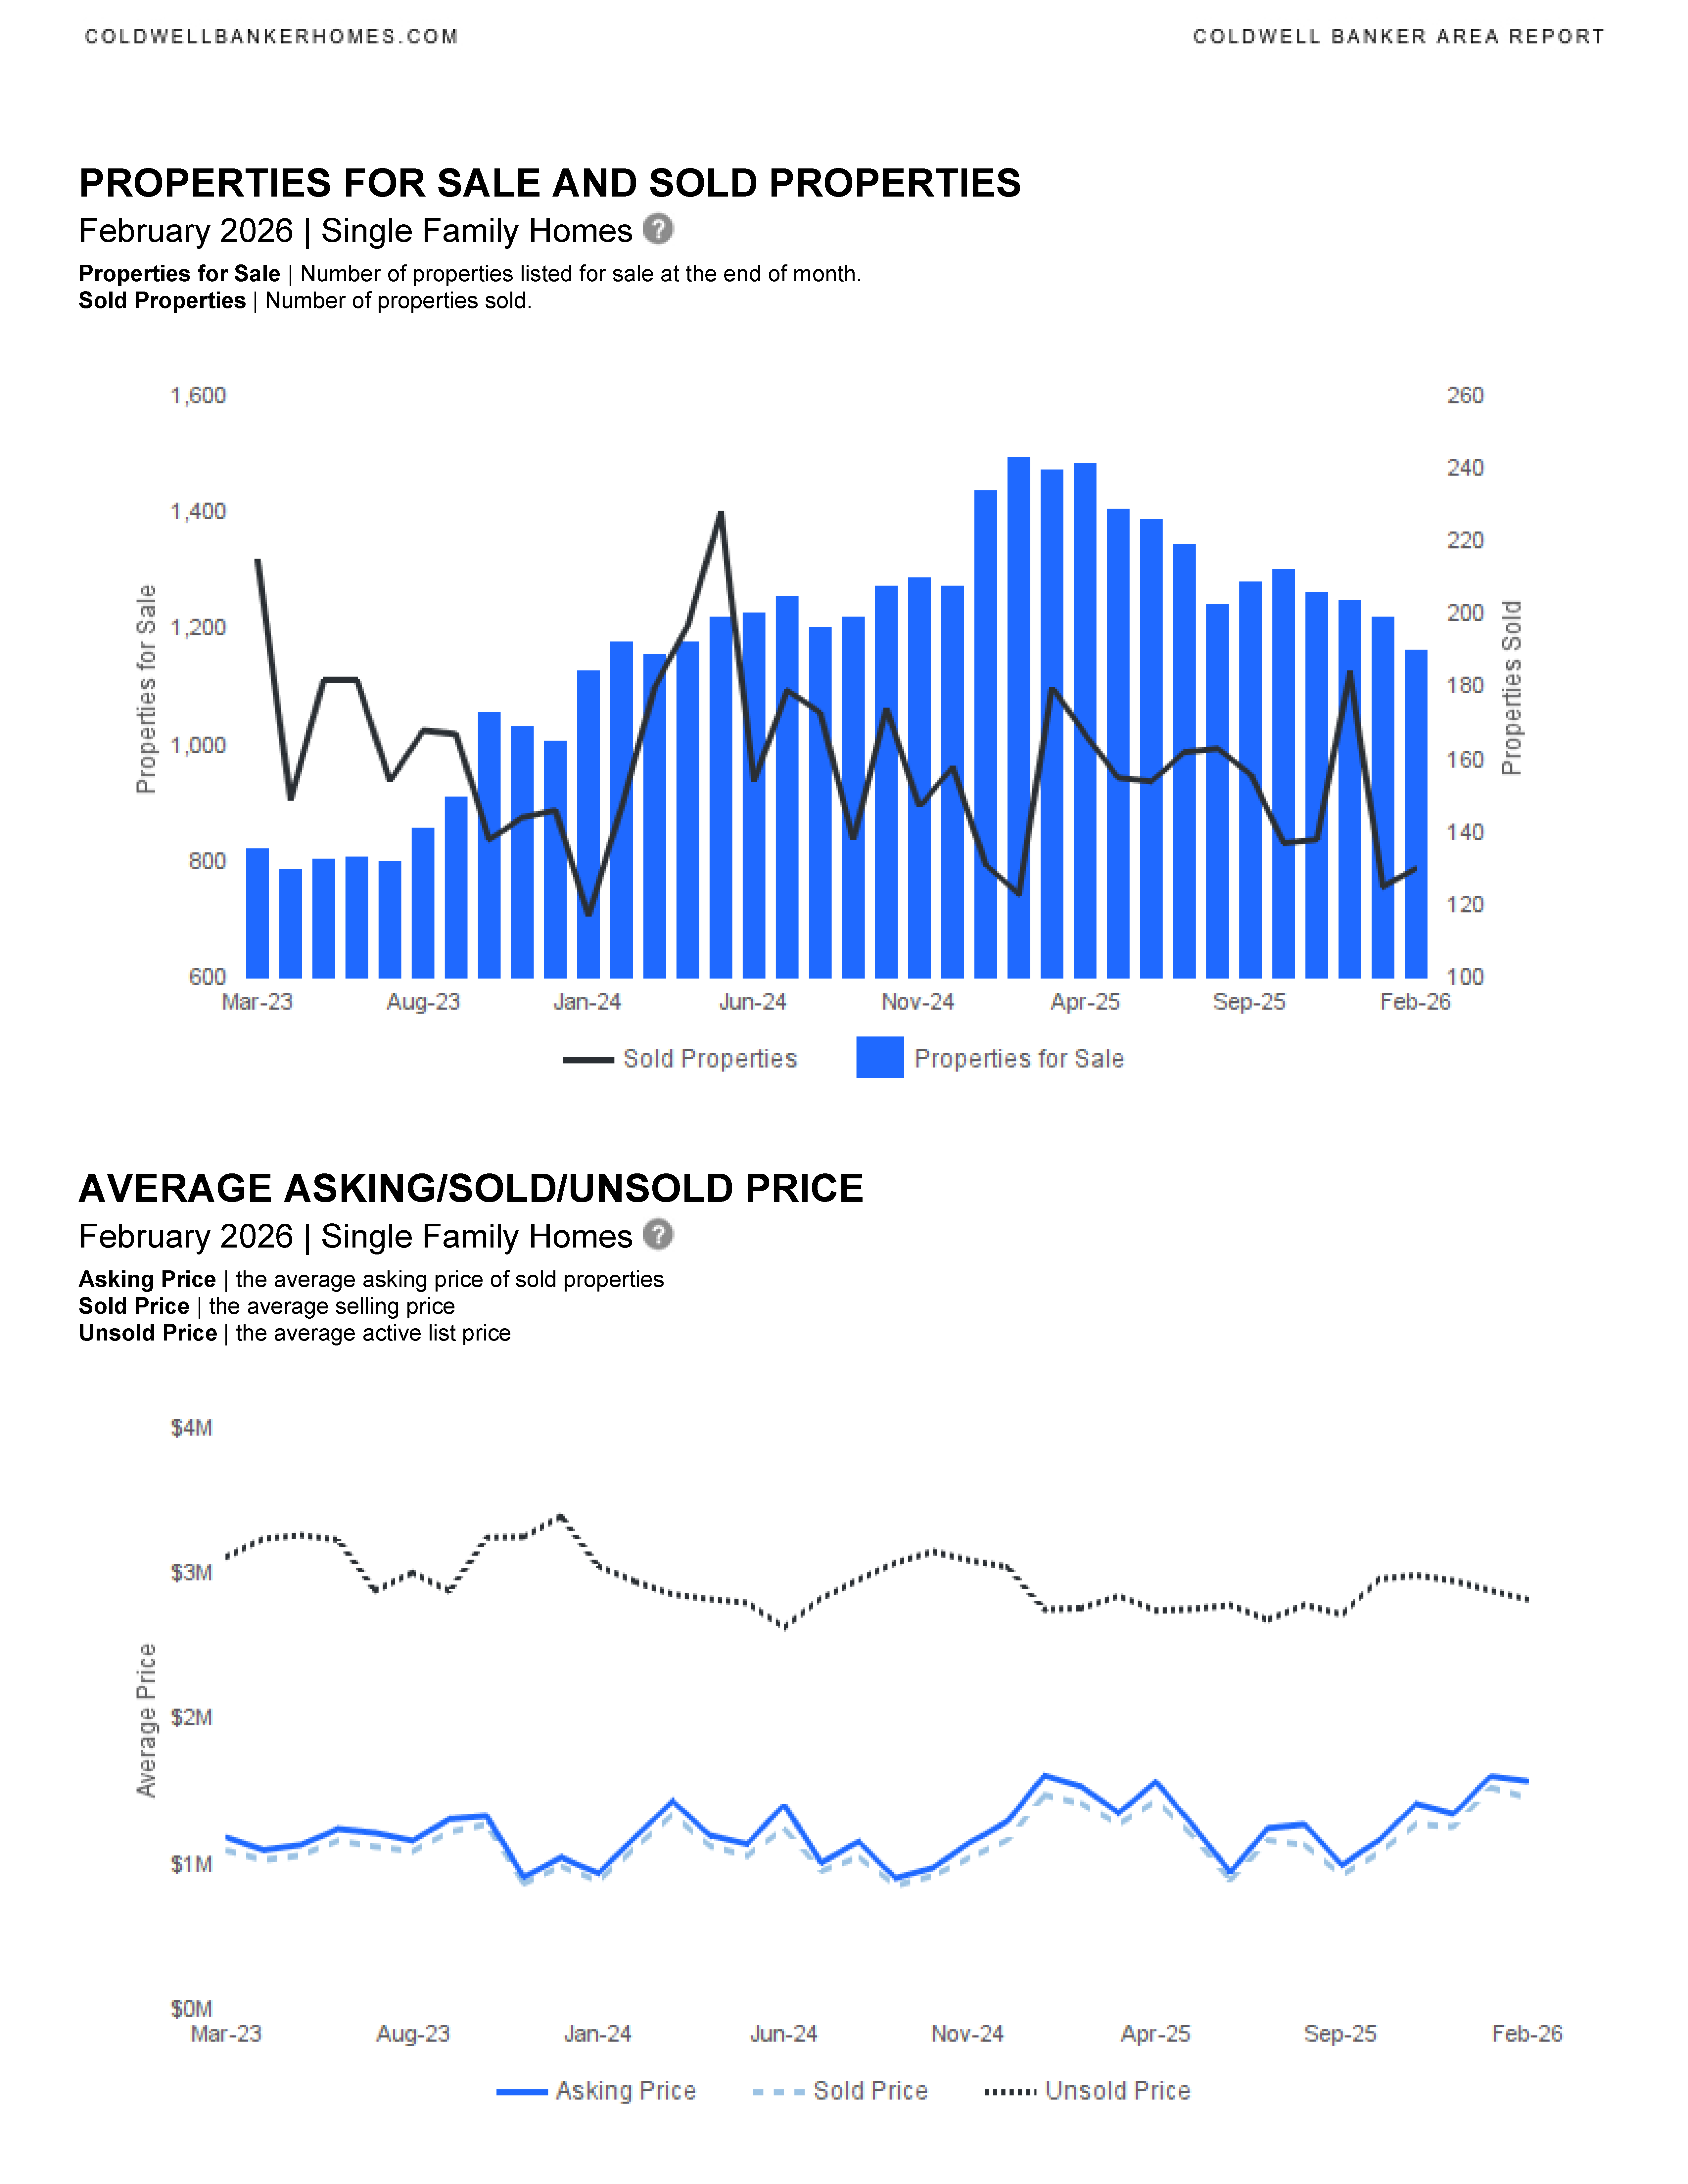
Market Snapshot
Across both segments, reduced inventory and consistent buyer activity are creating a competitive landscape, especially for well‑priced, turnkey properties. Luxury and waterfront listings in Fort Lauderdale continue to attract strong interest.
Commonly asked questions while reviewing the reports:
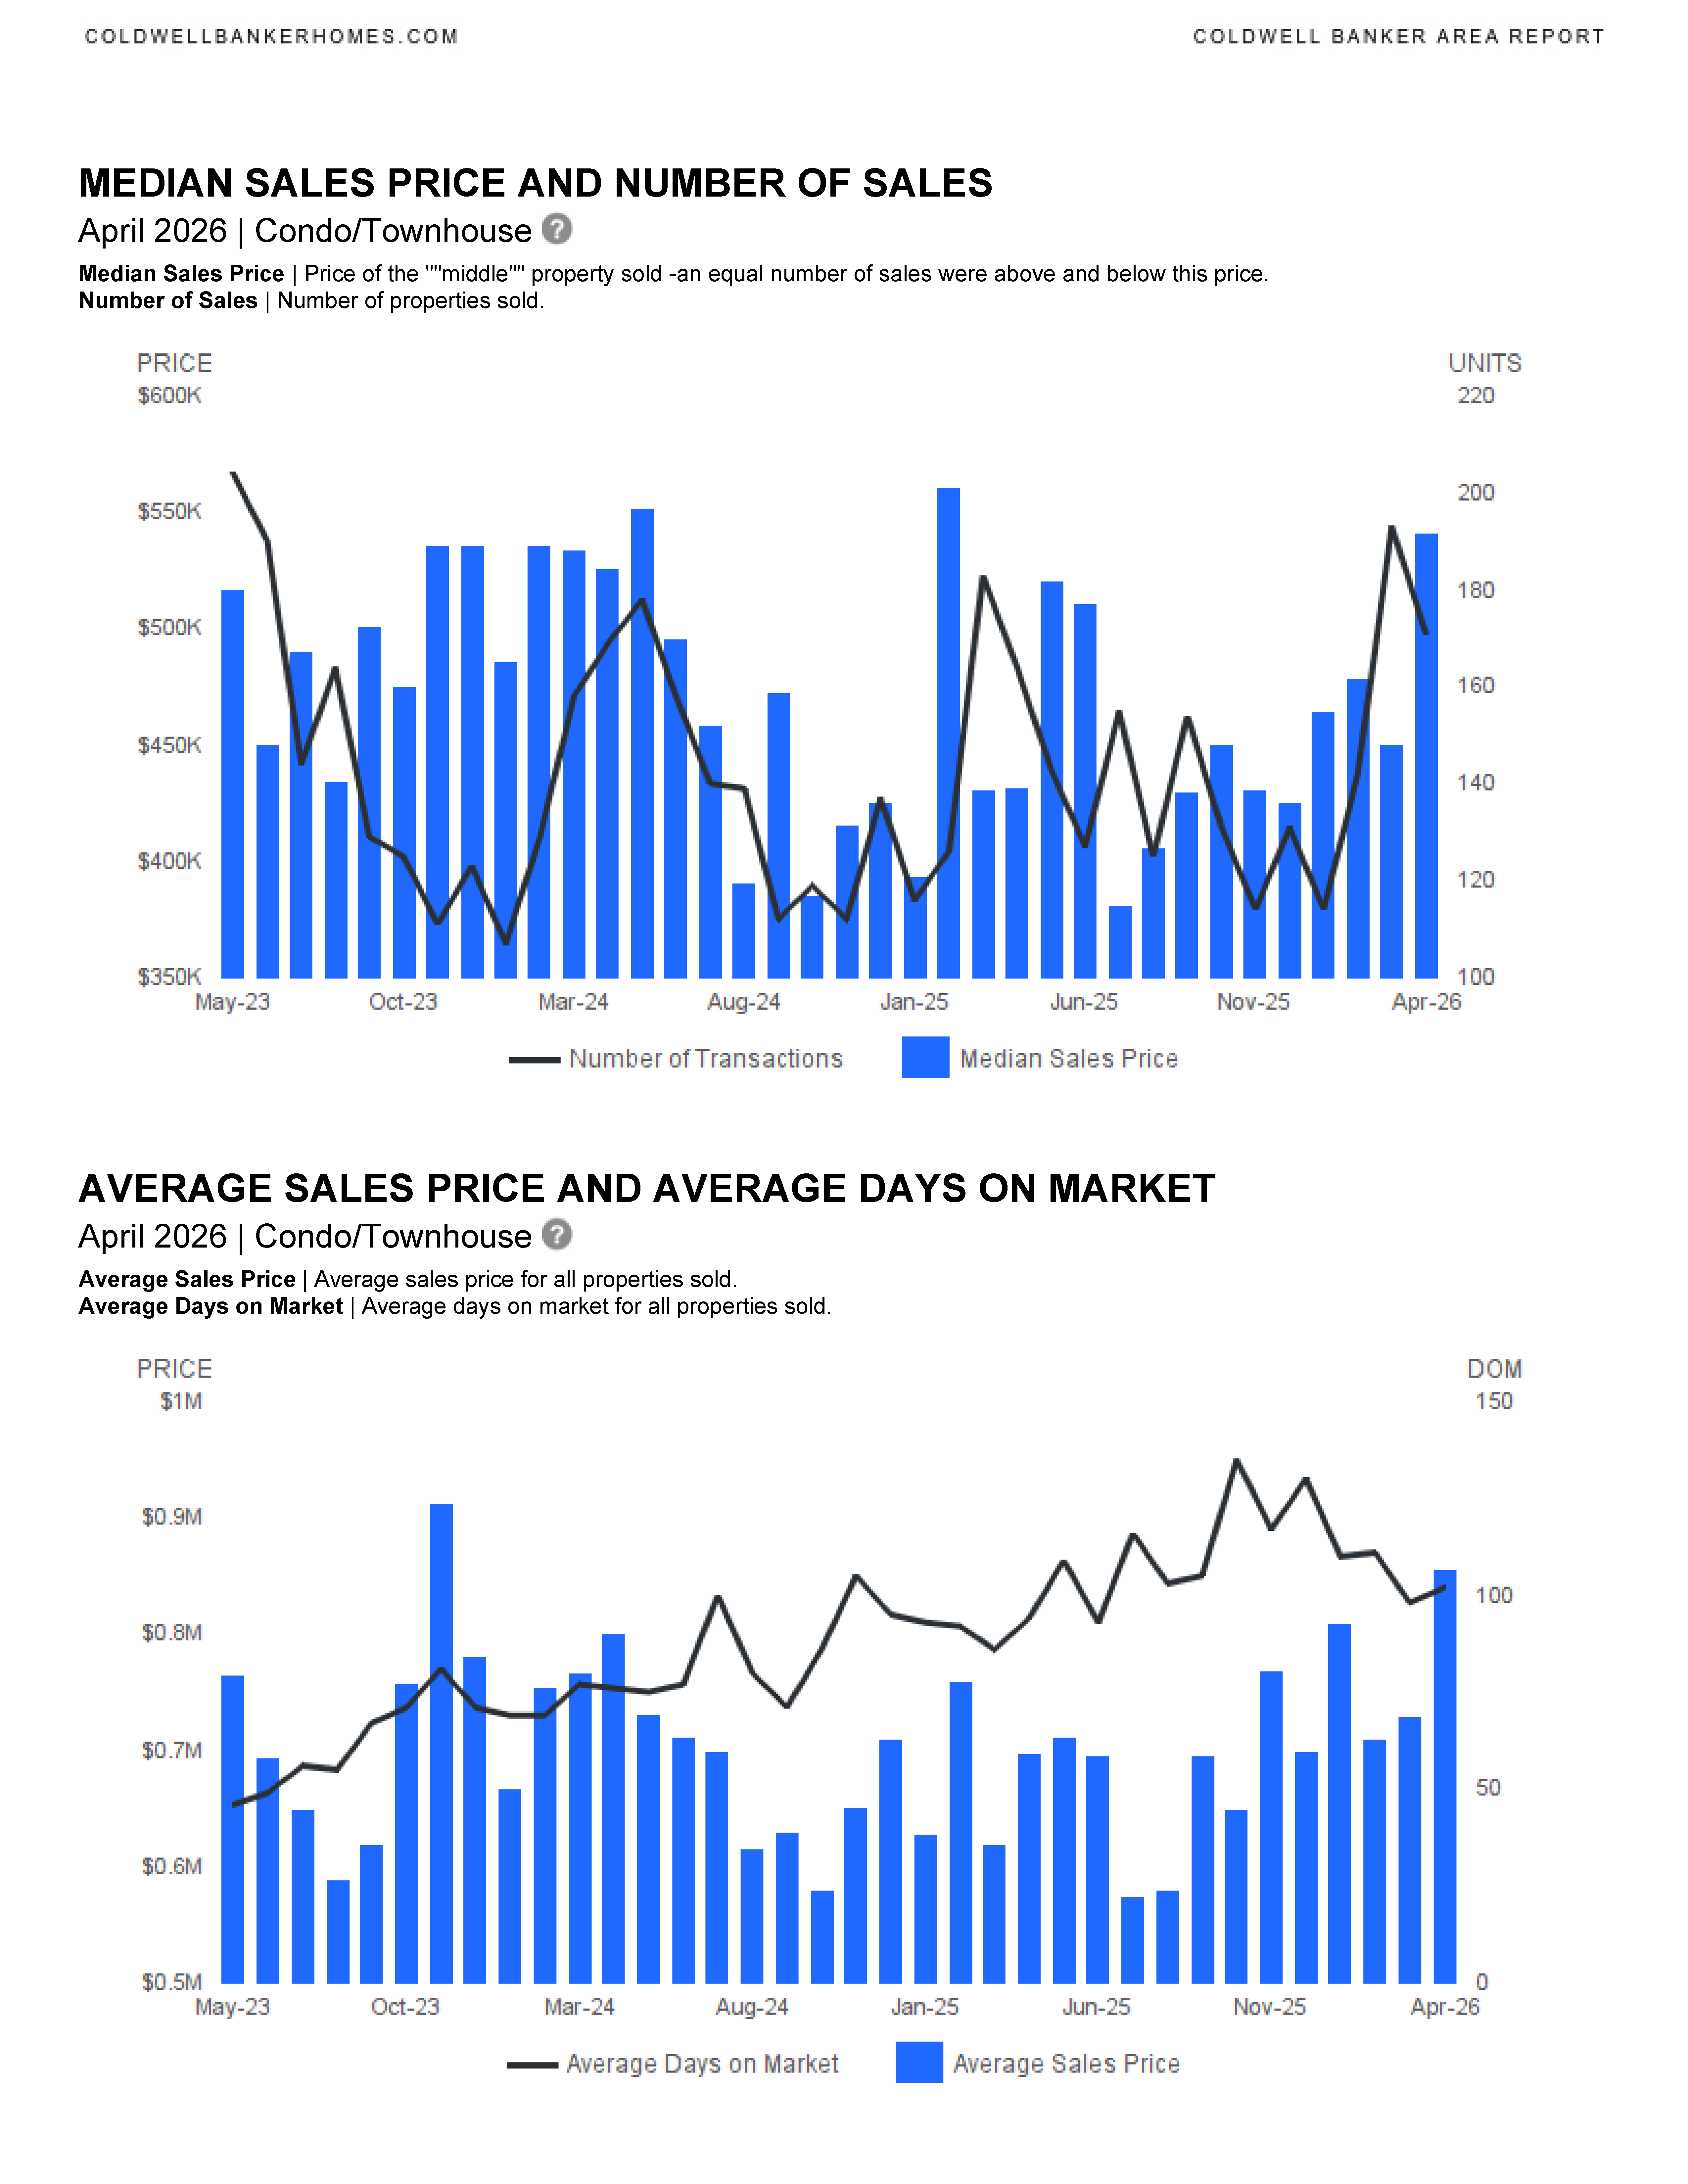
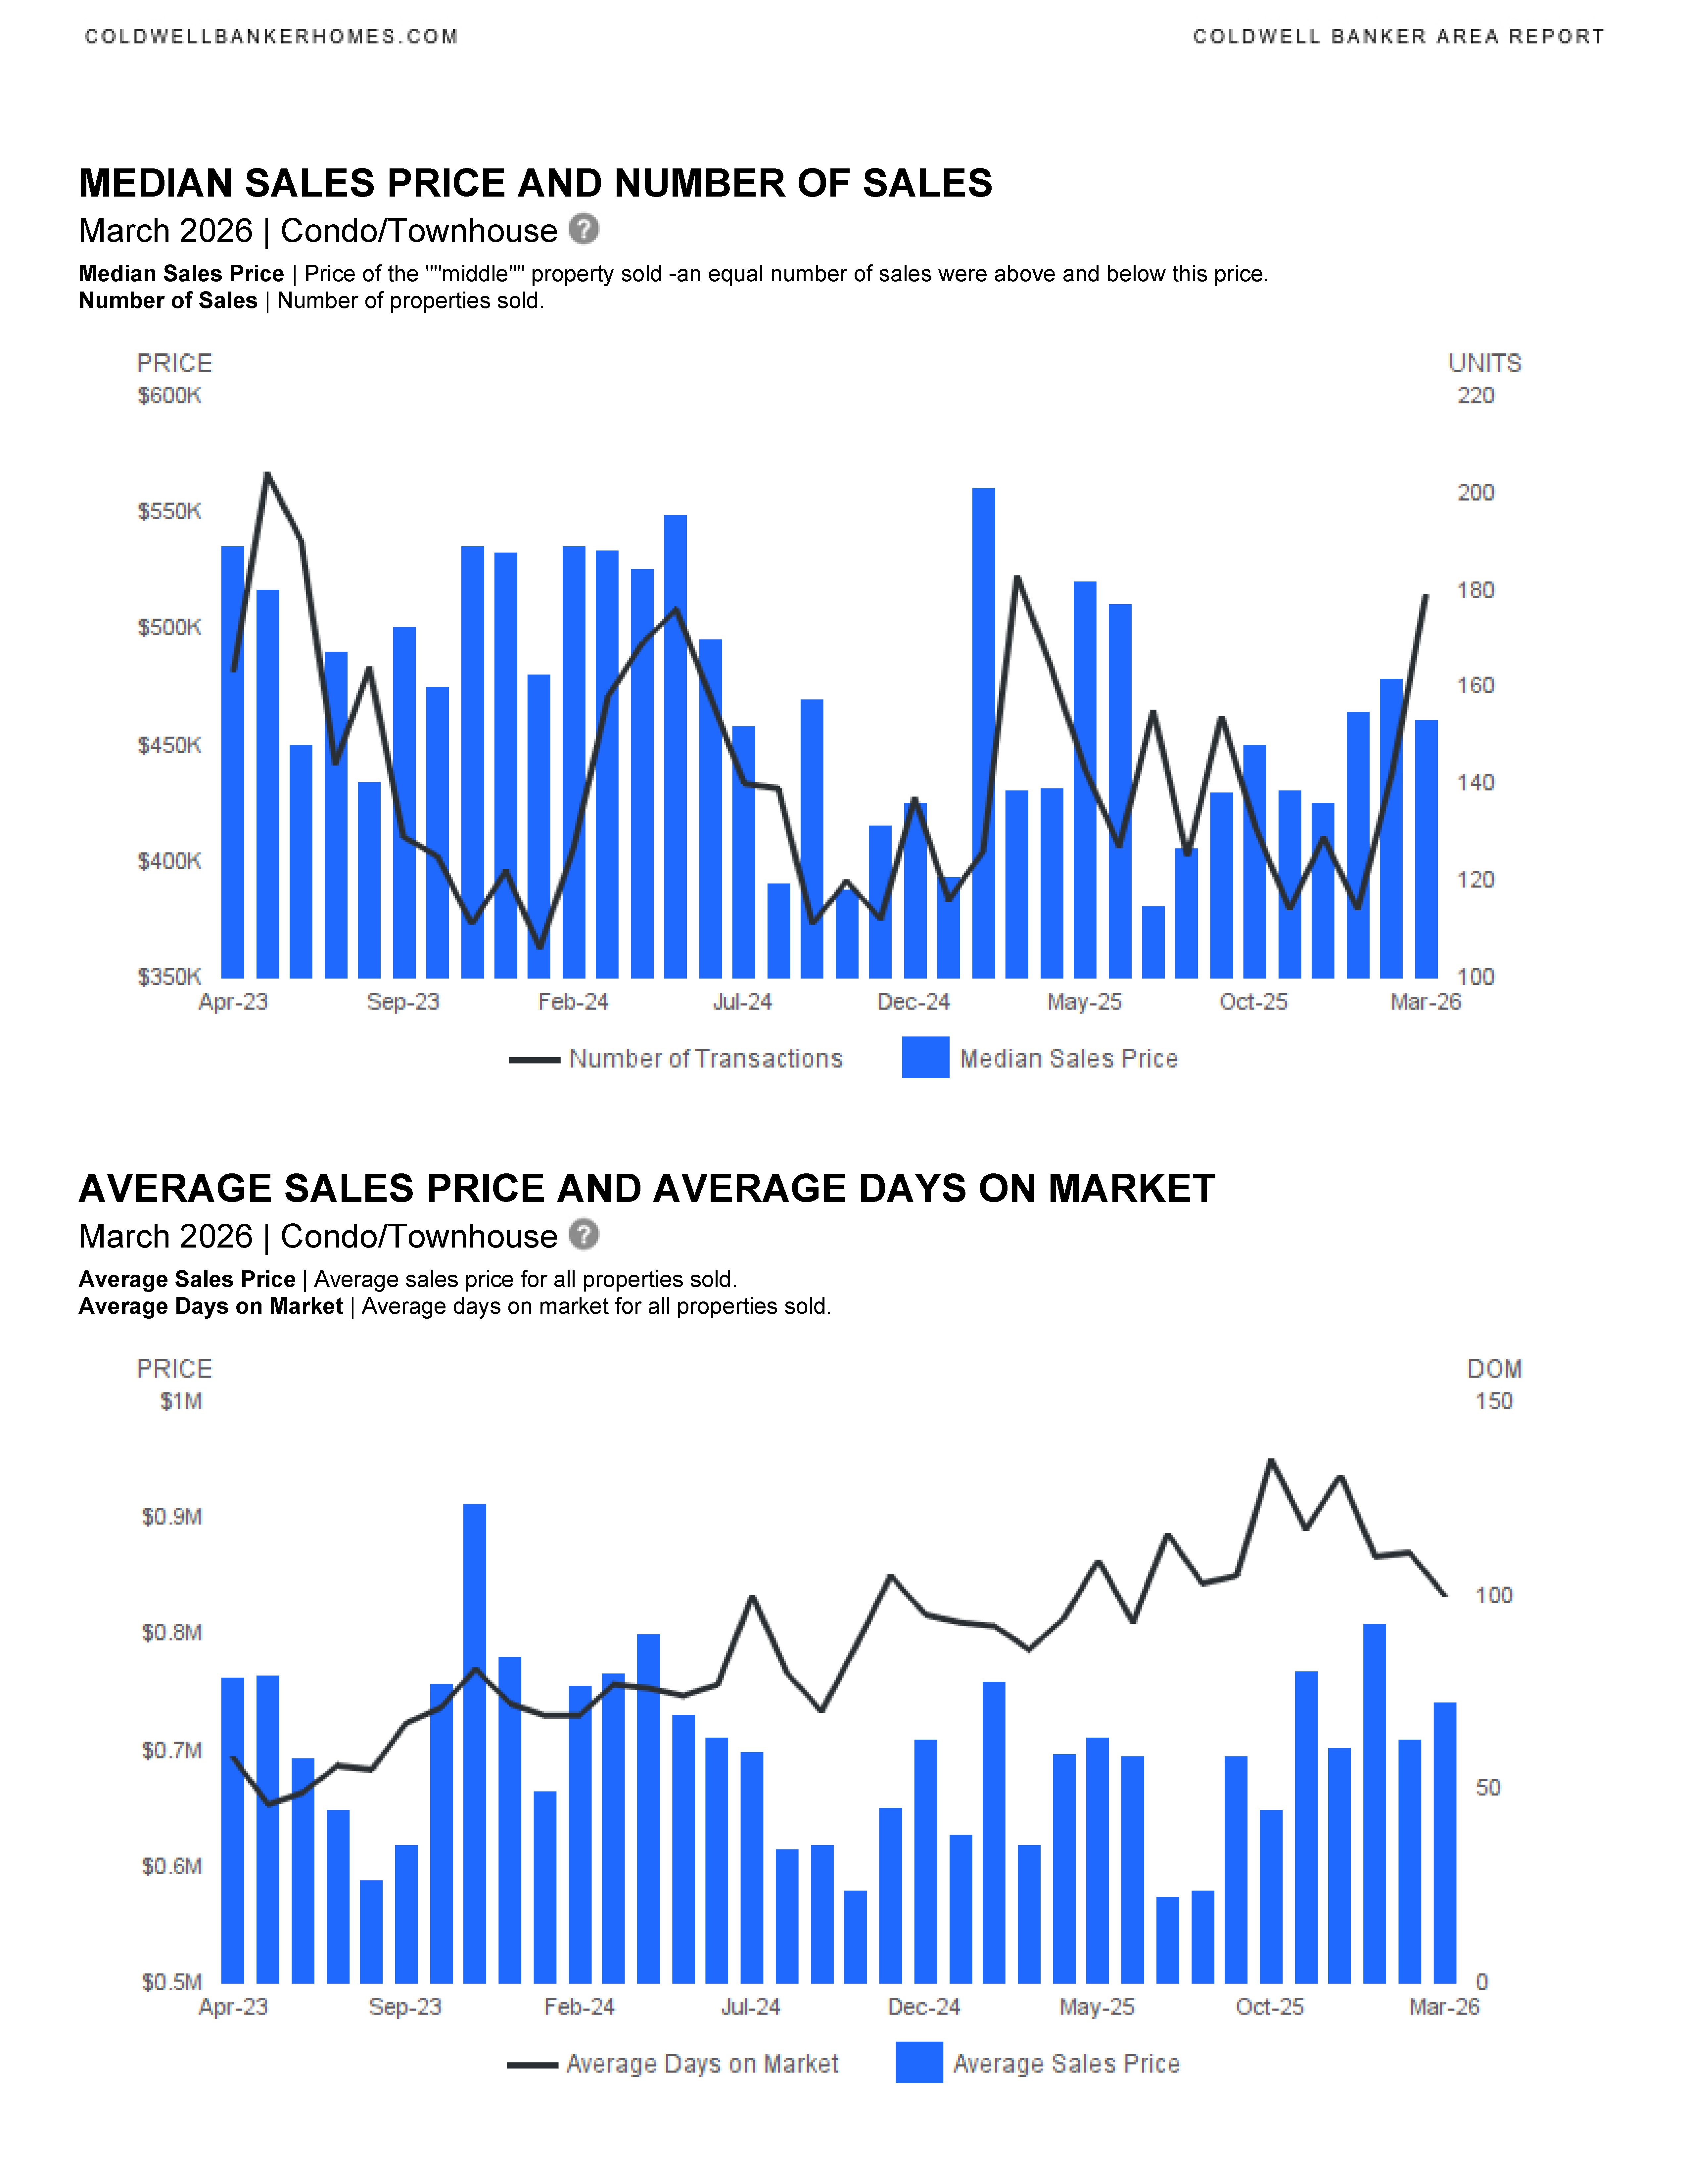
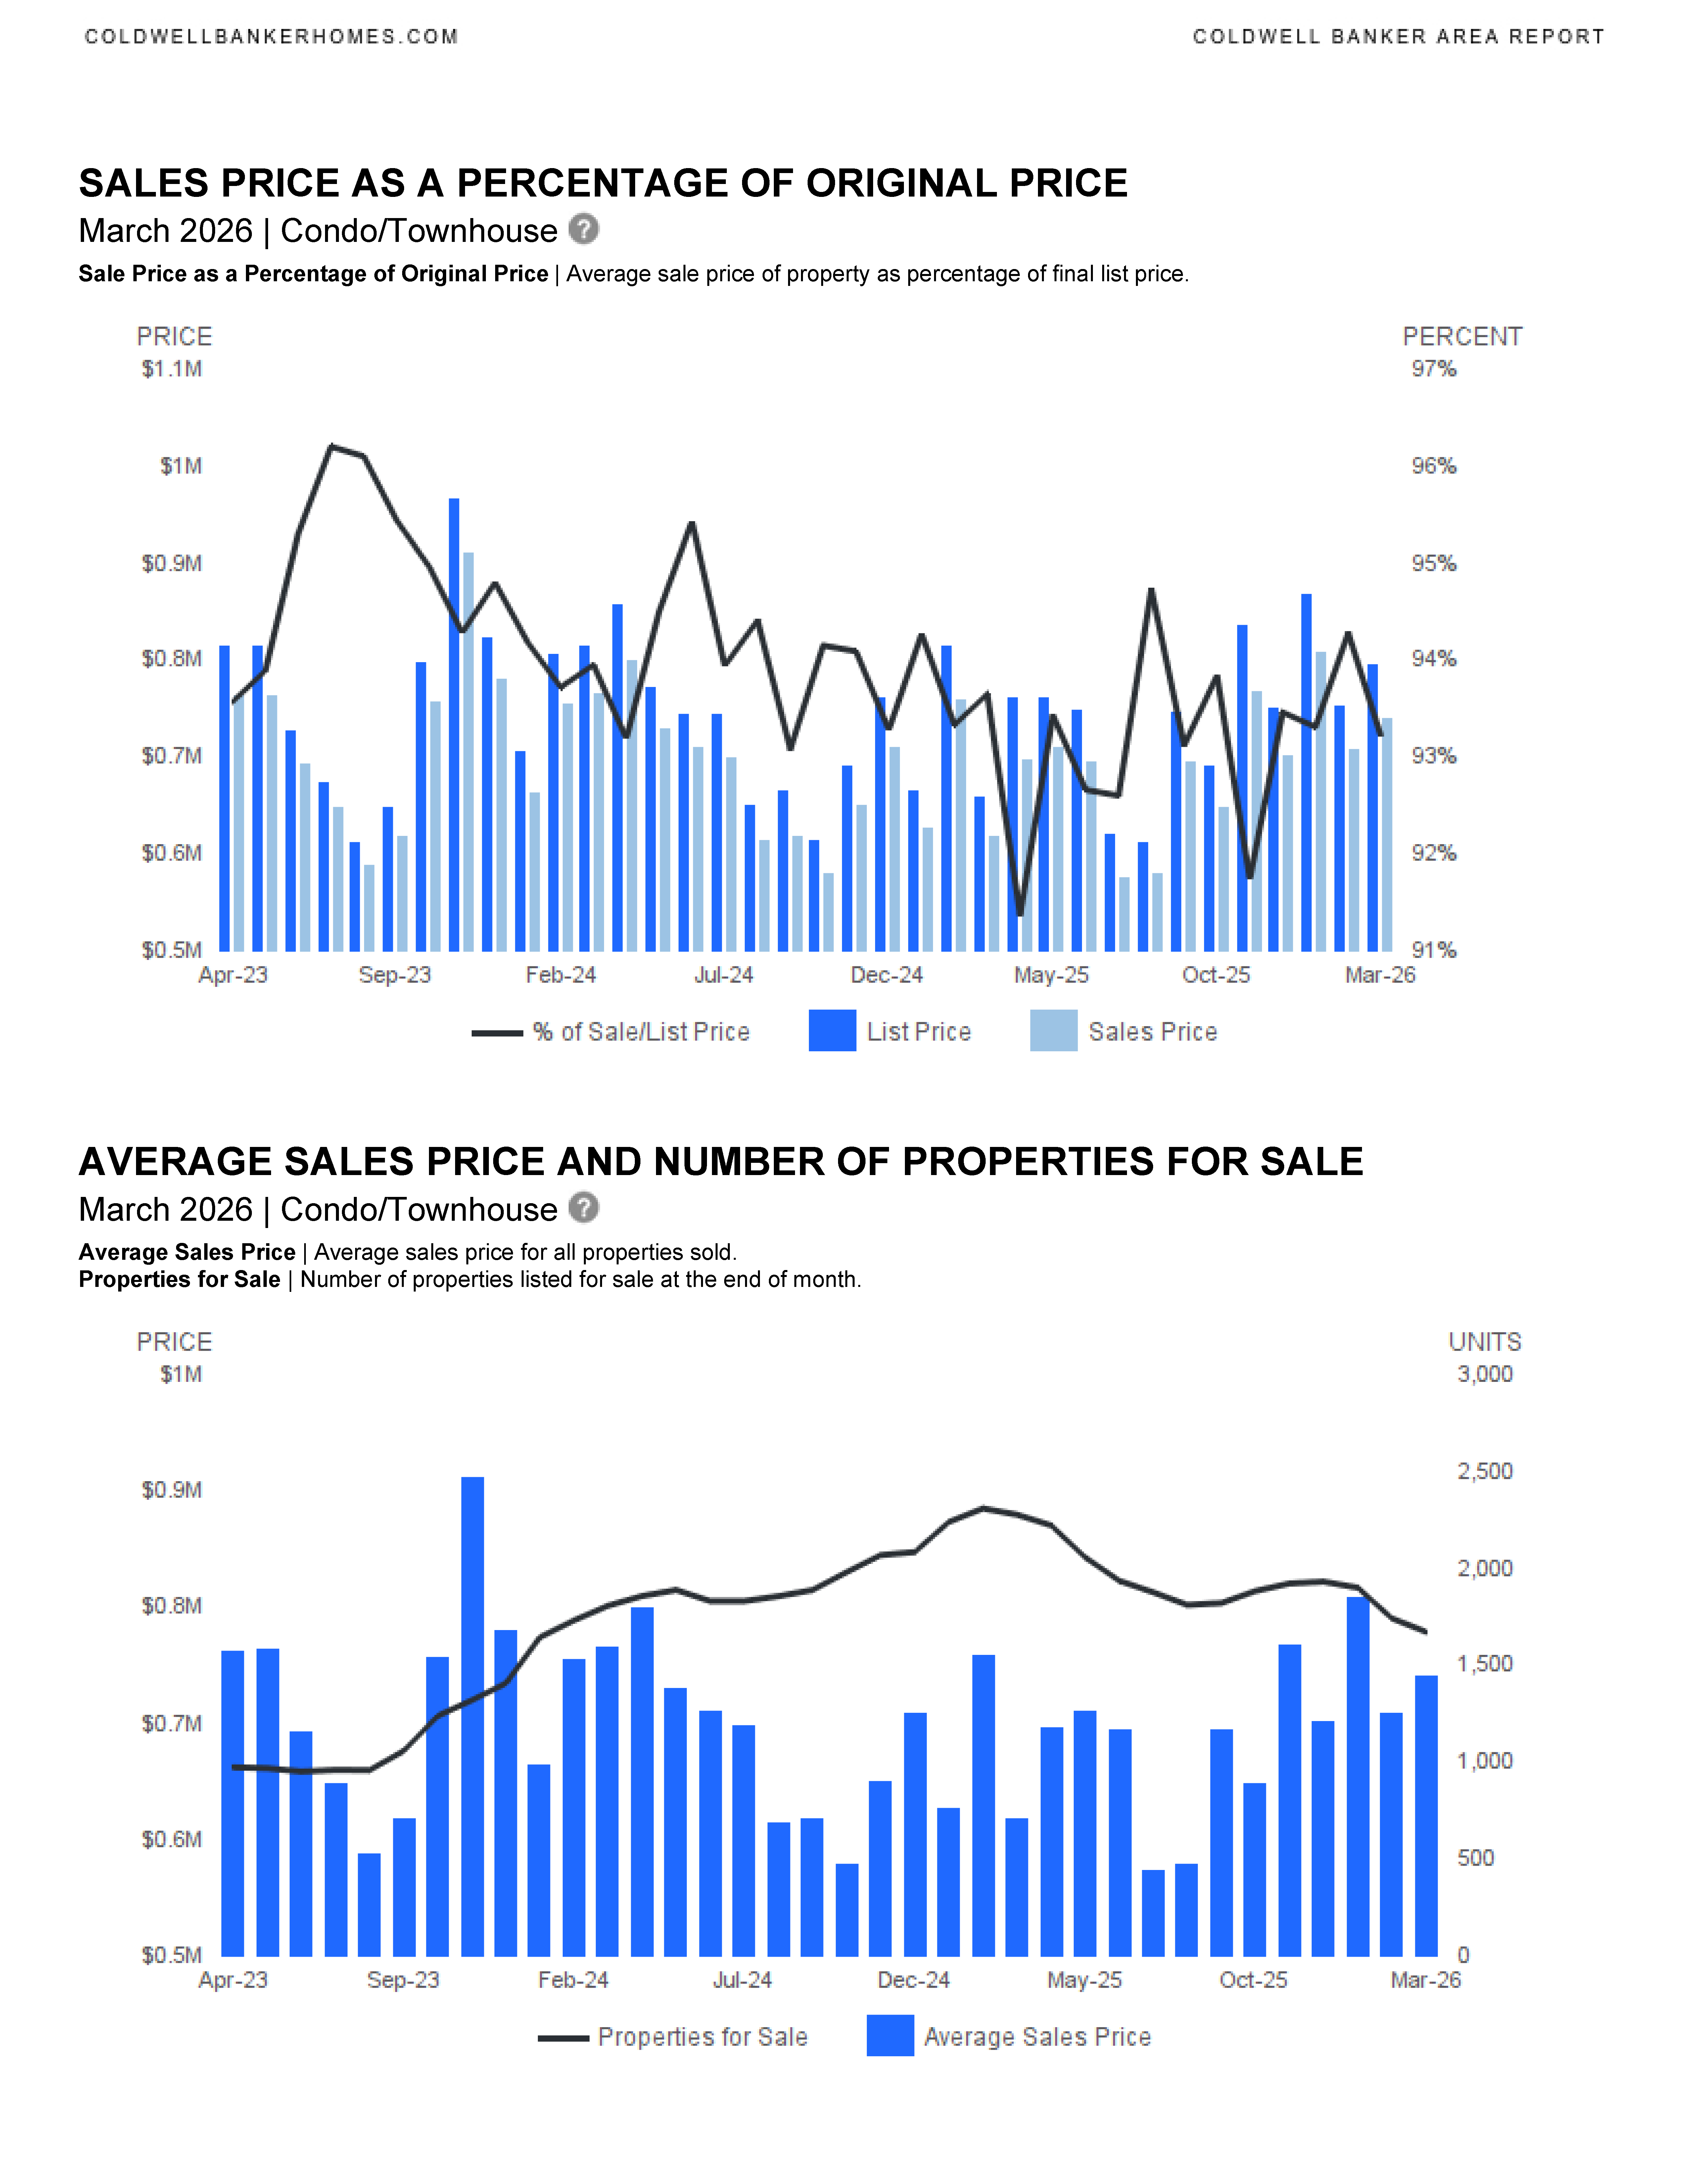
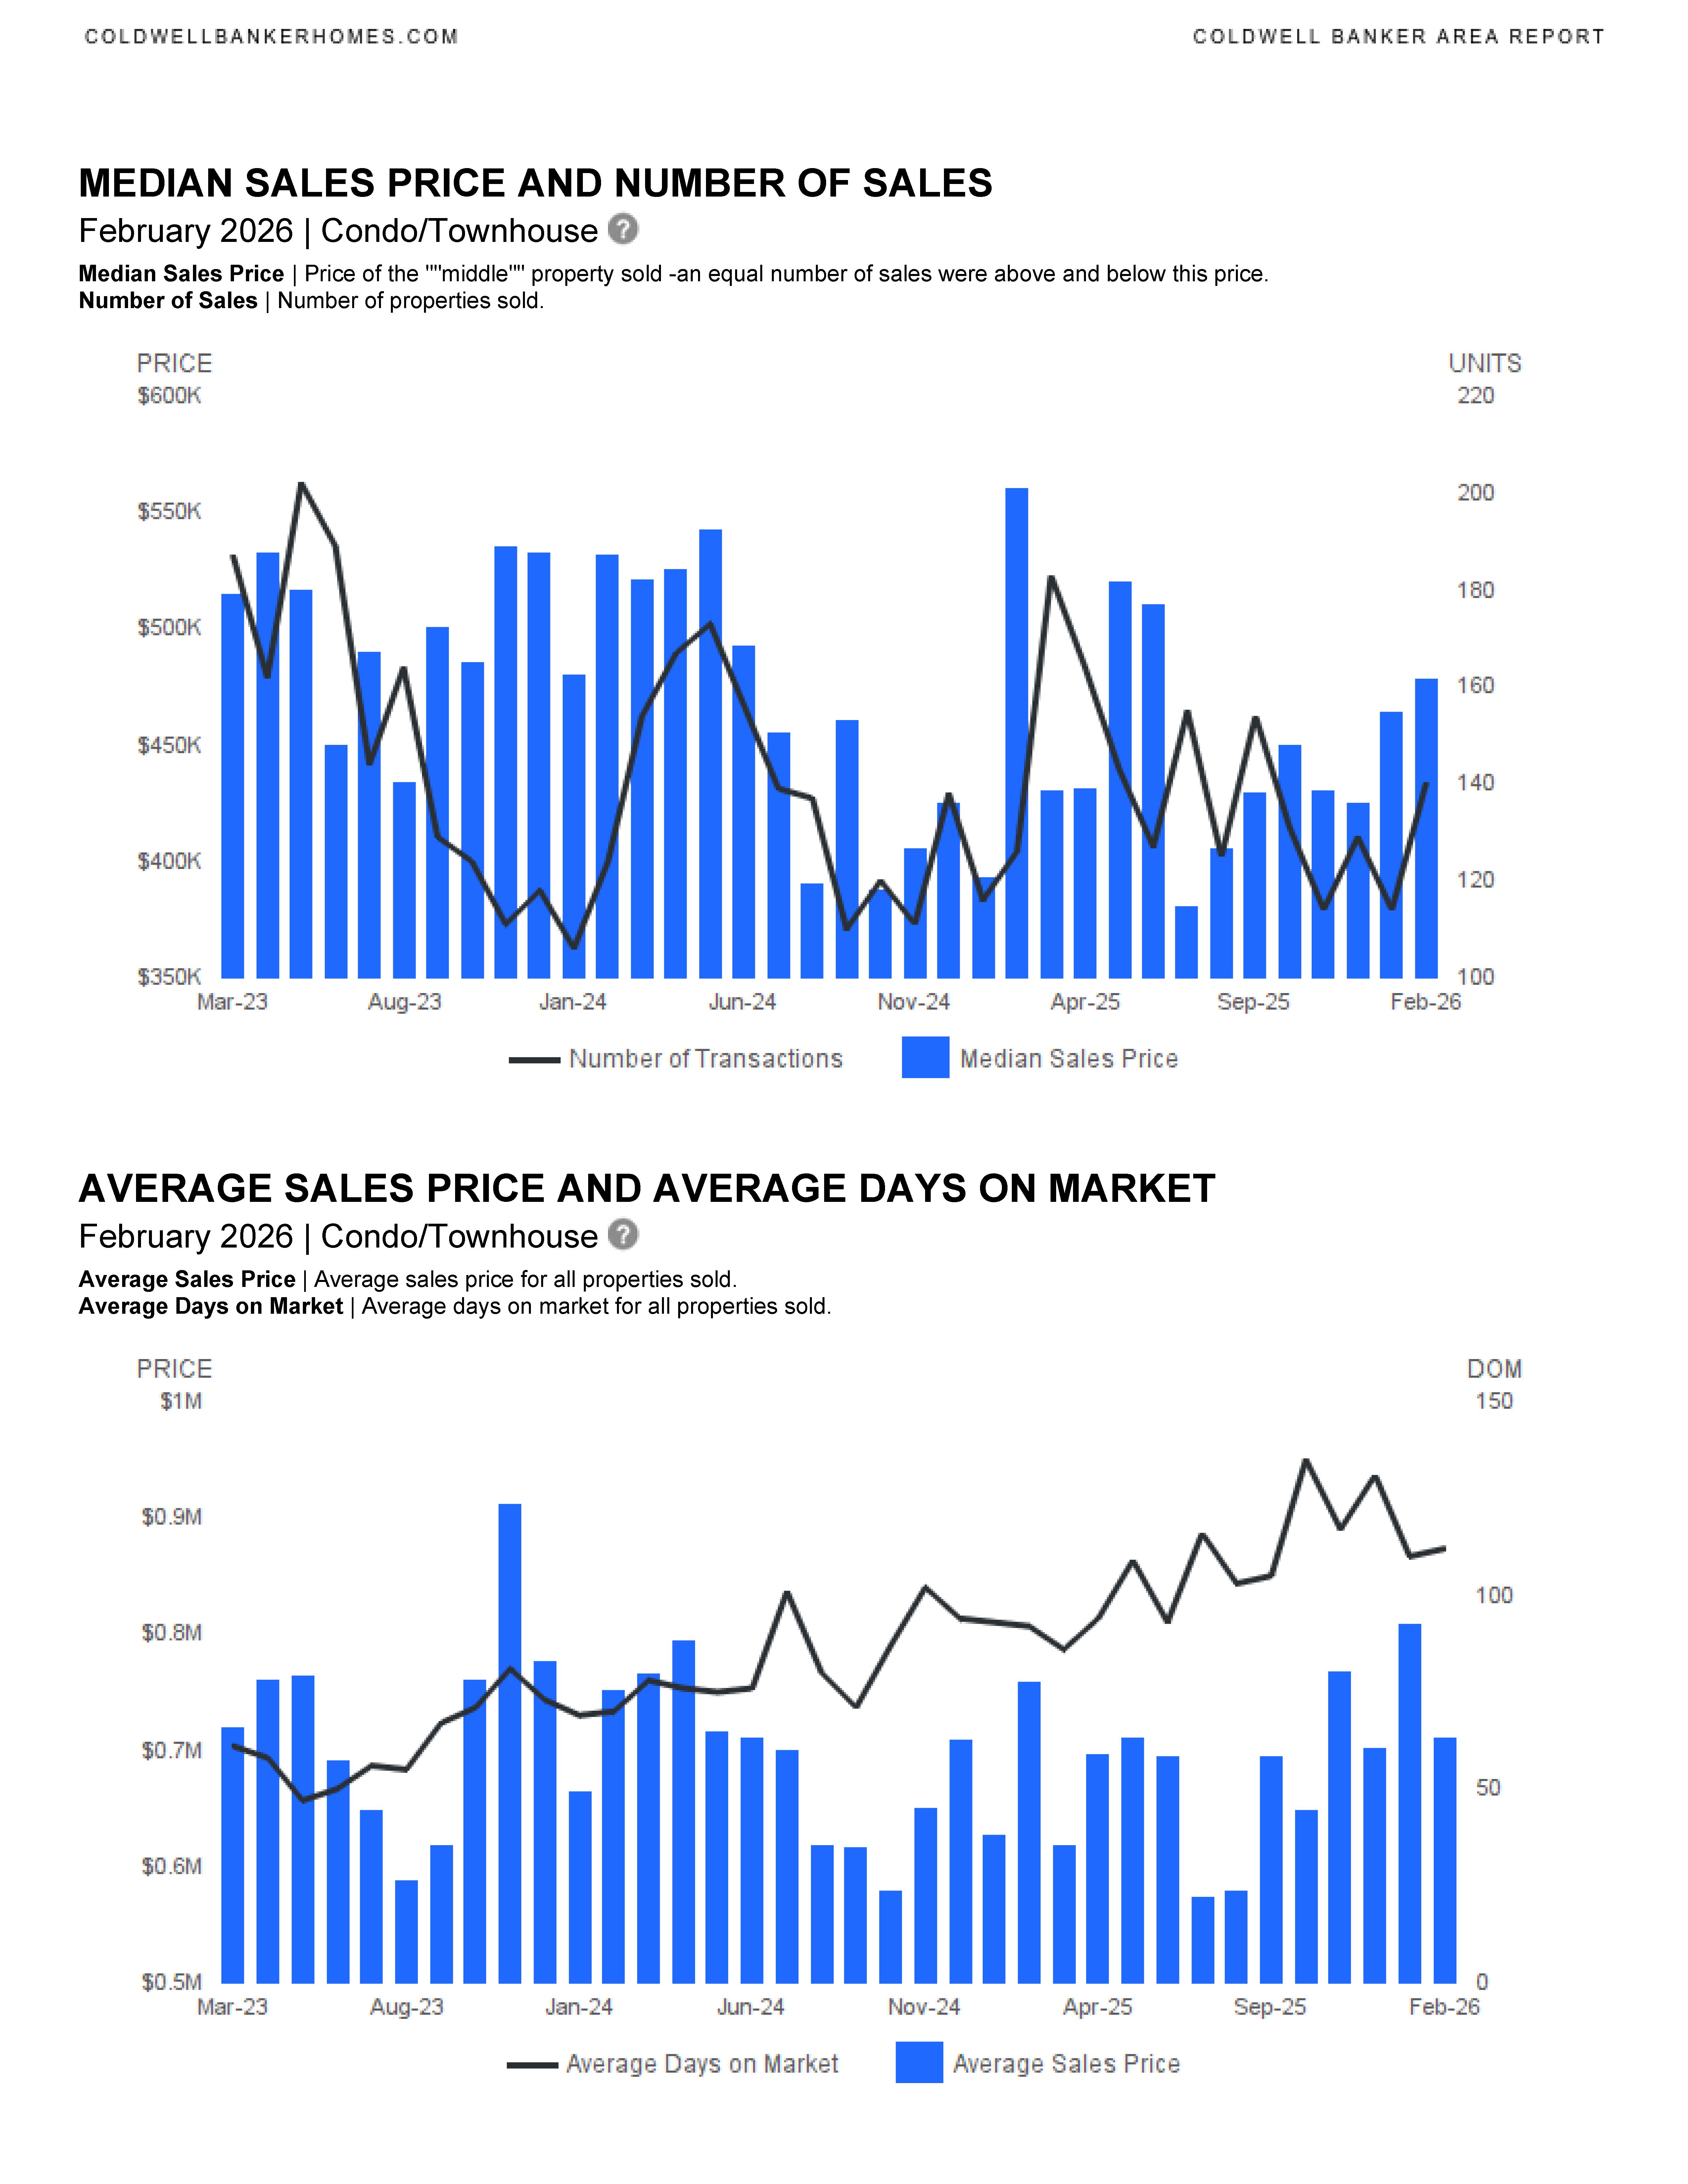
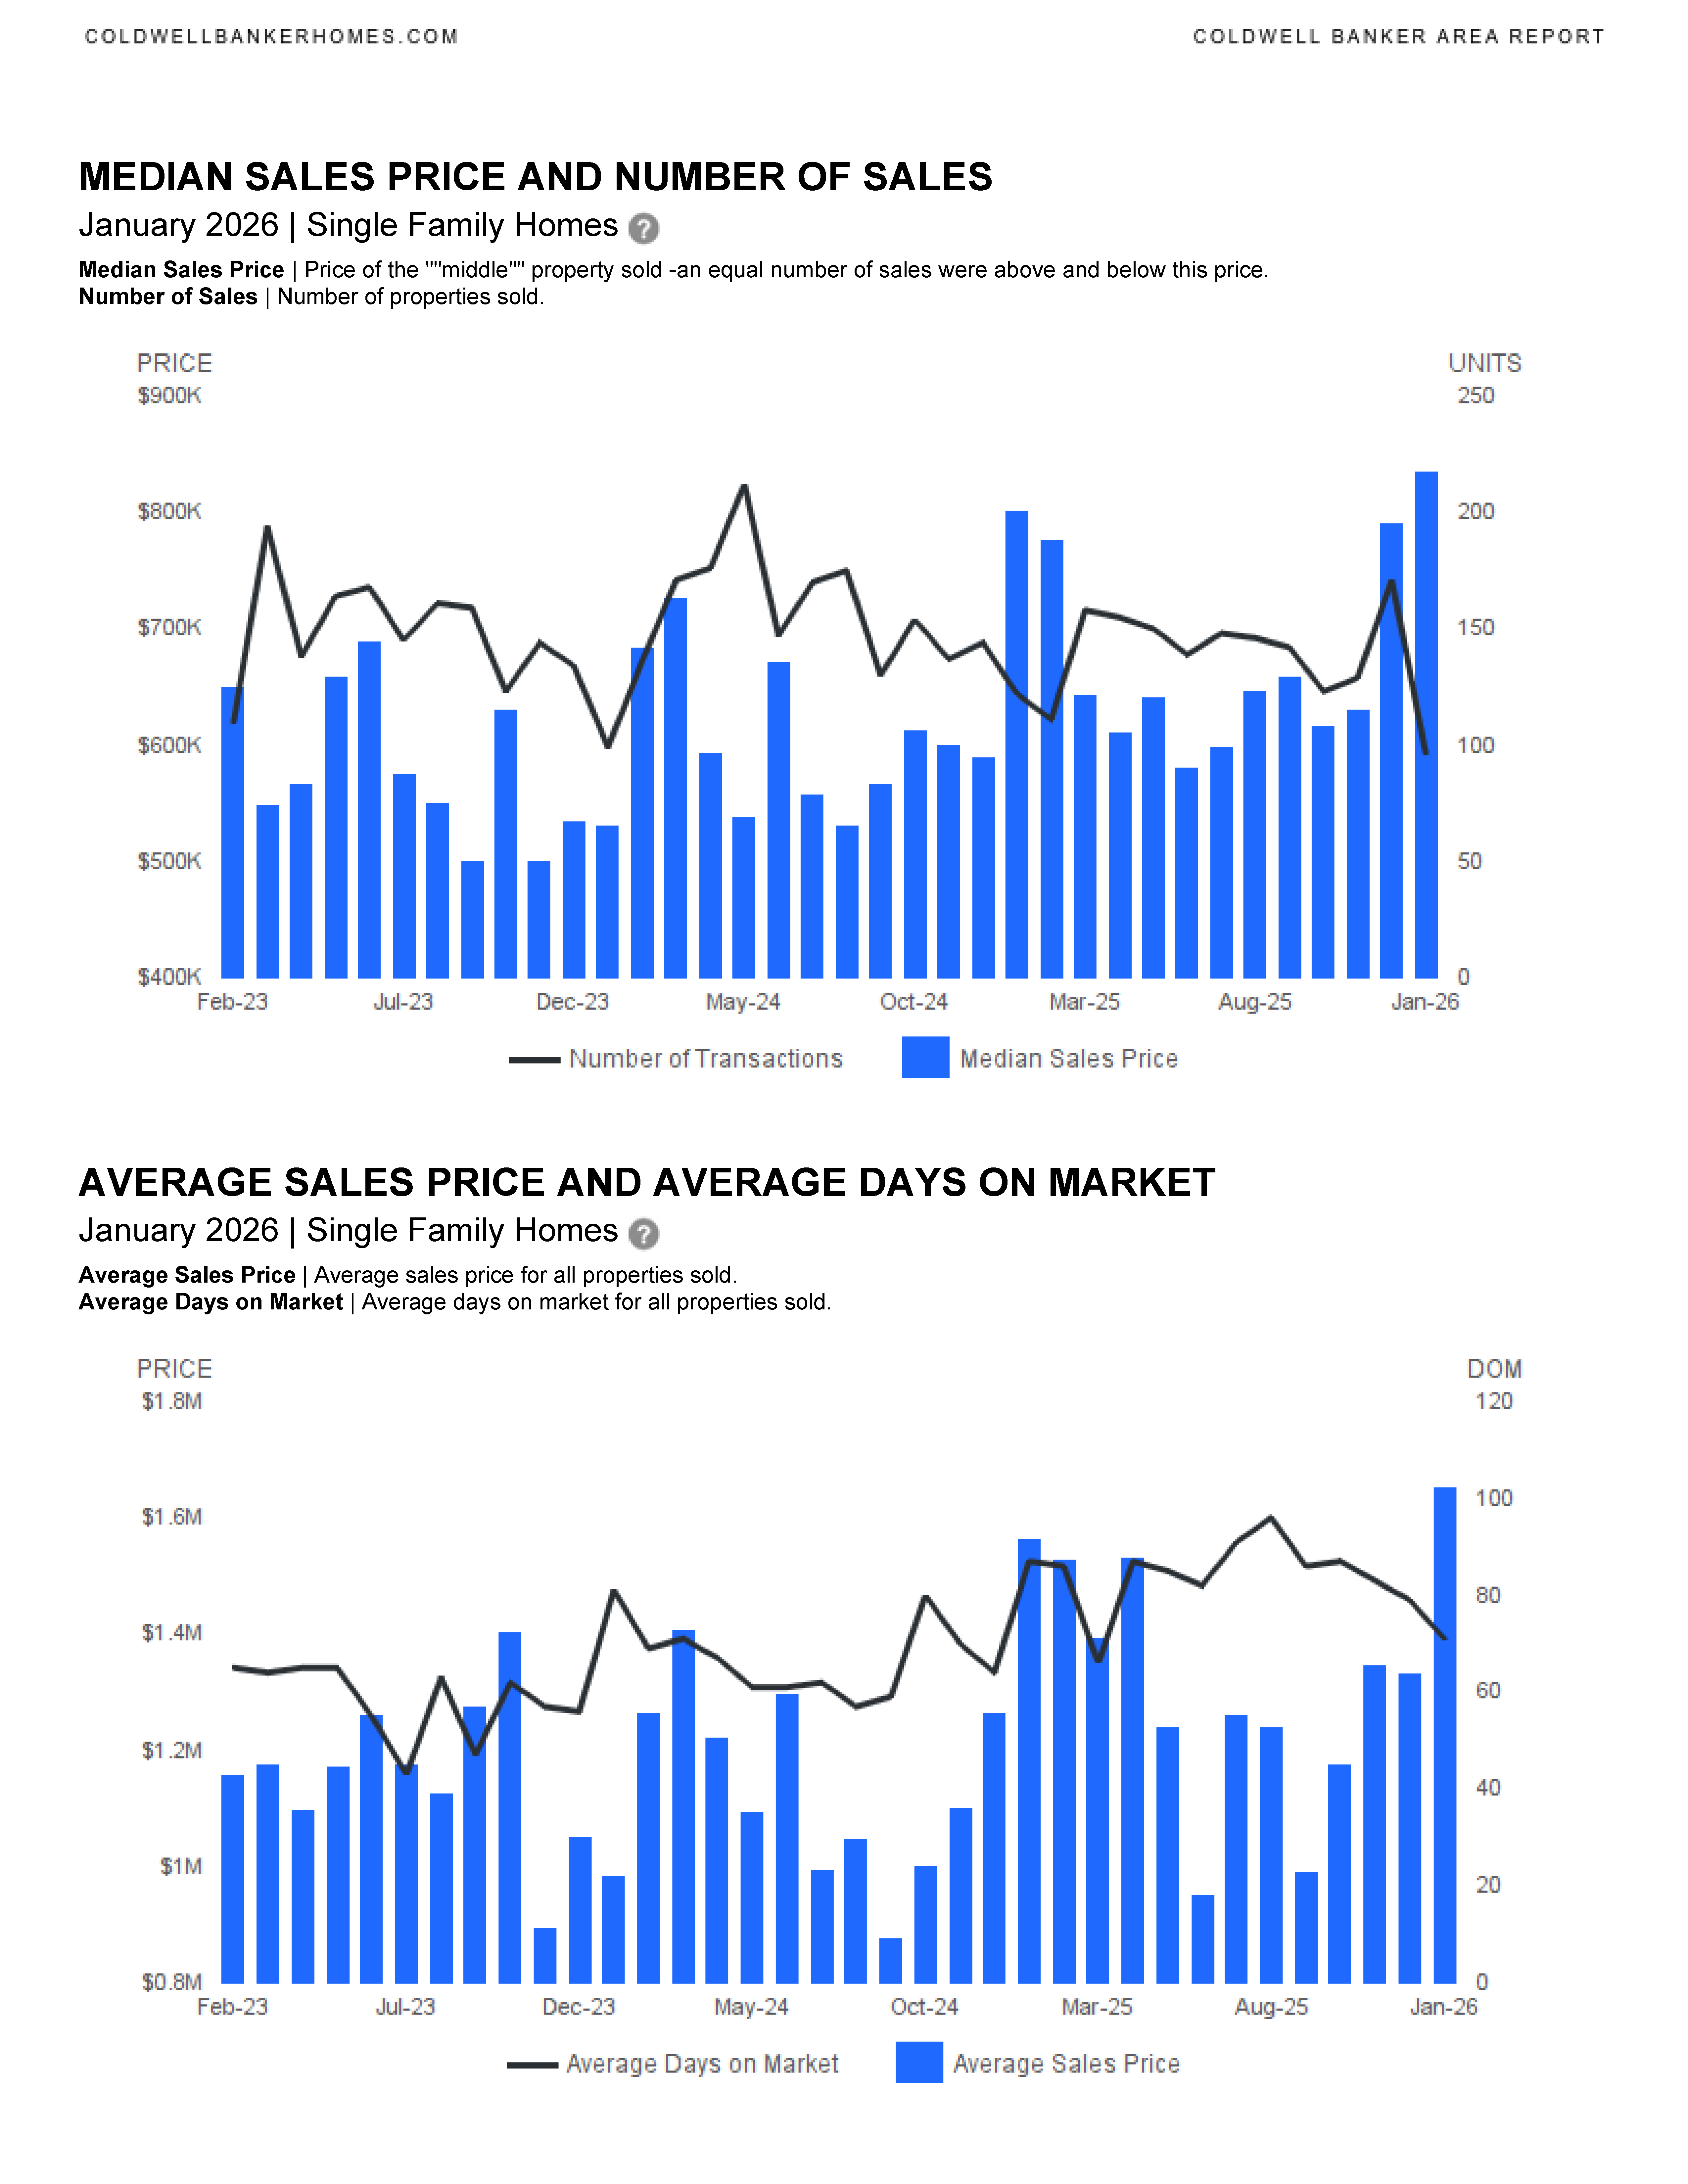
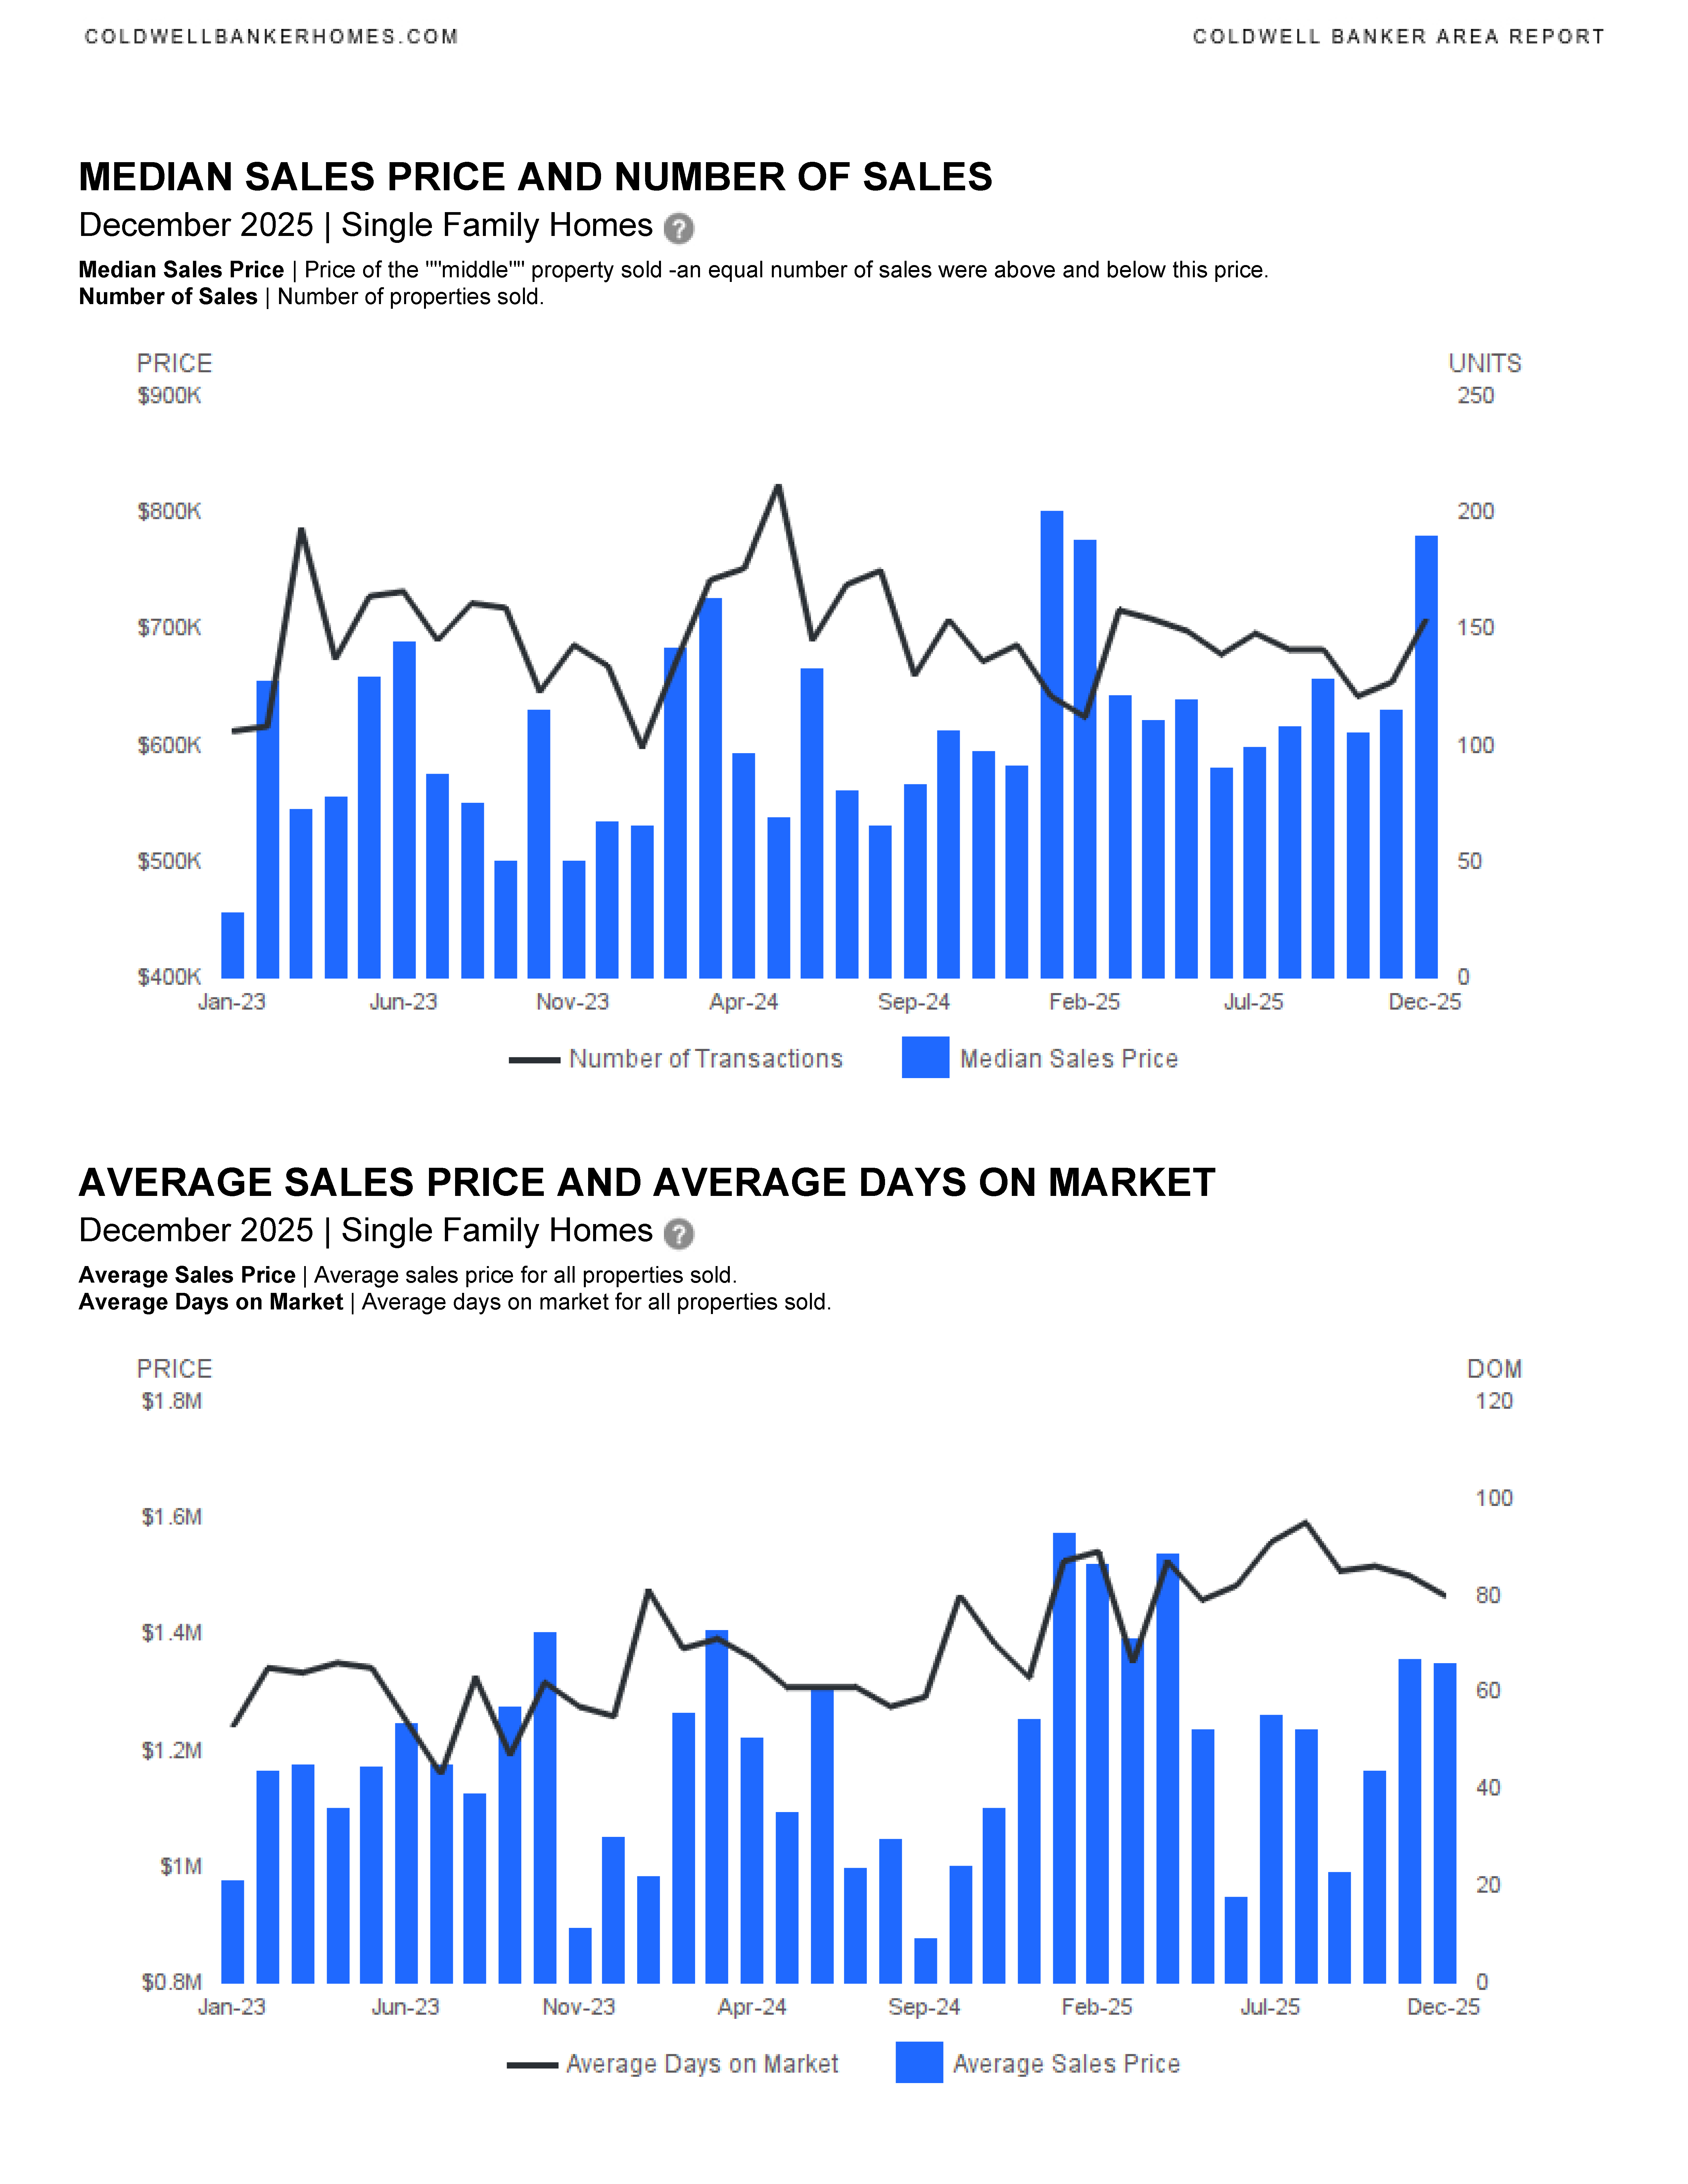
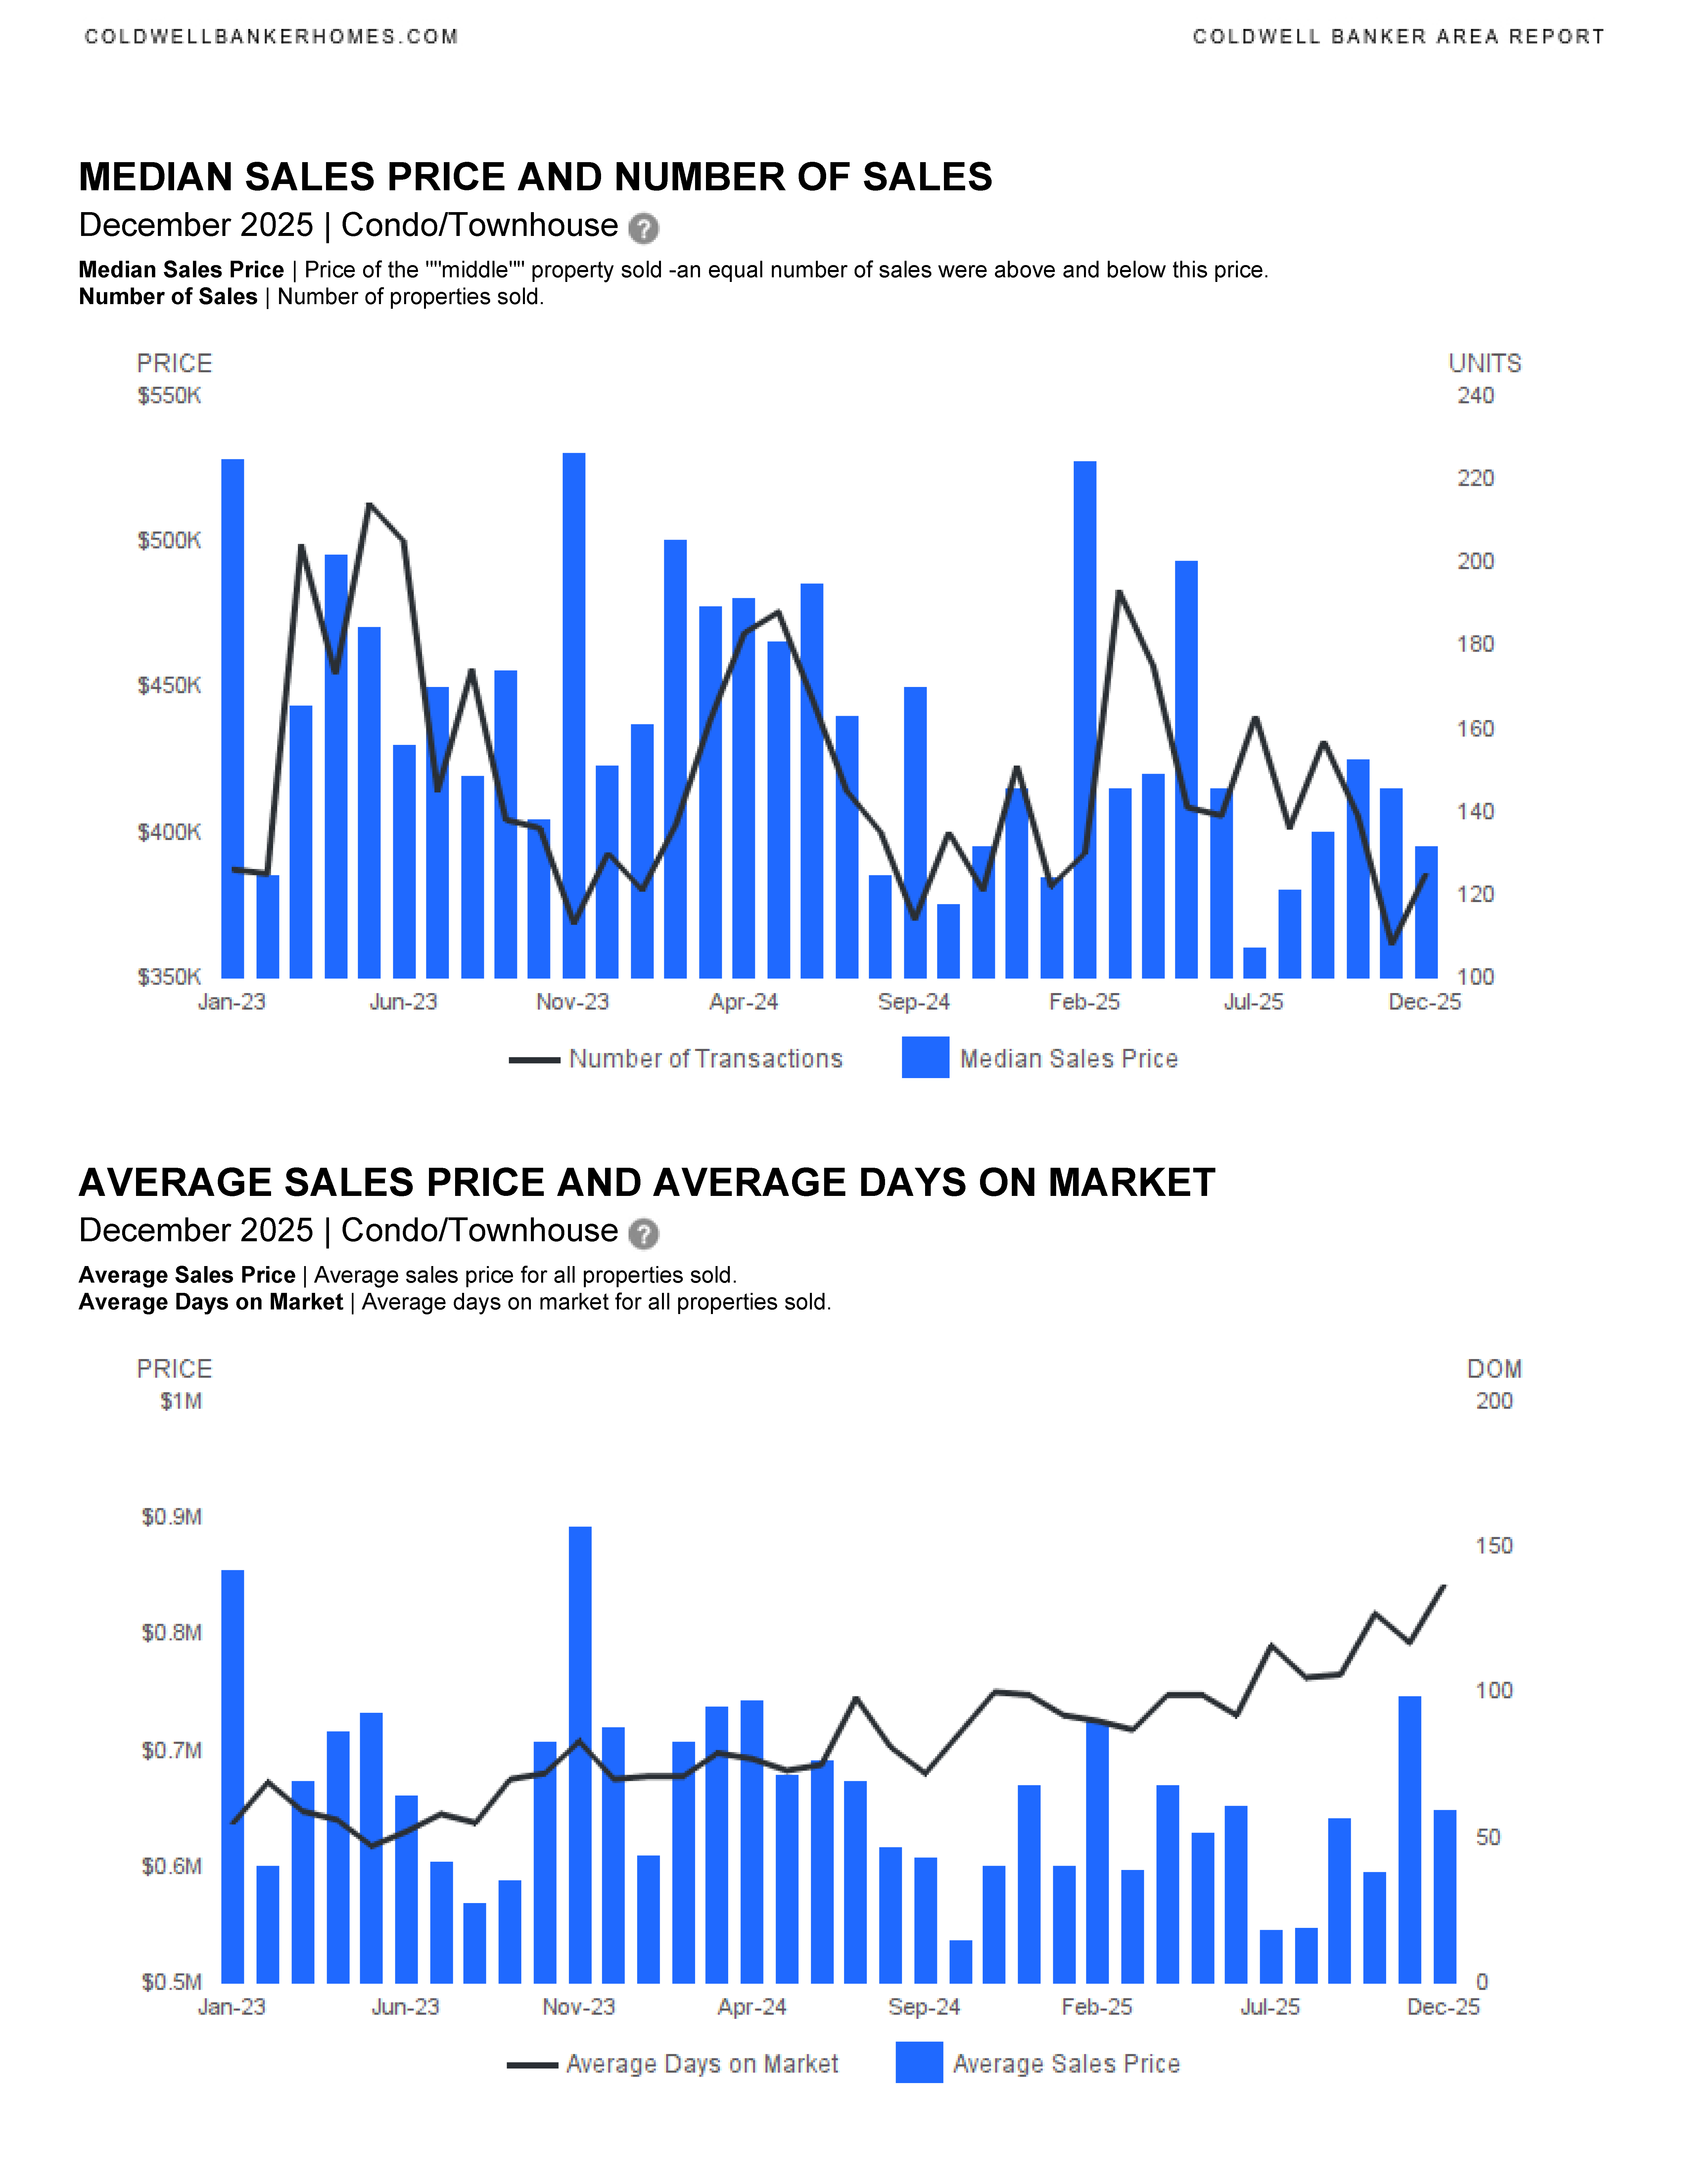
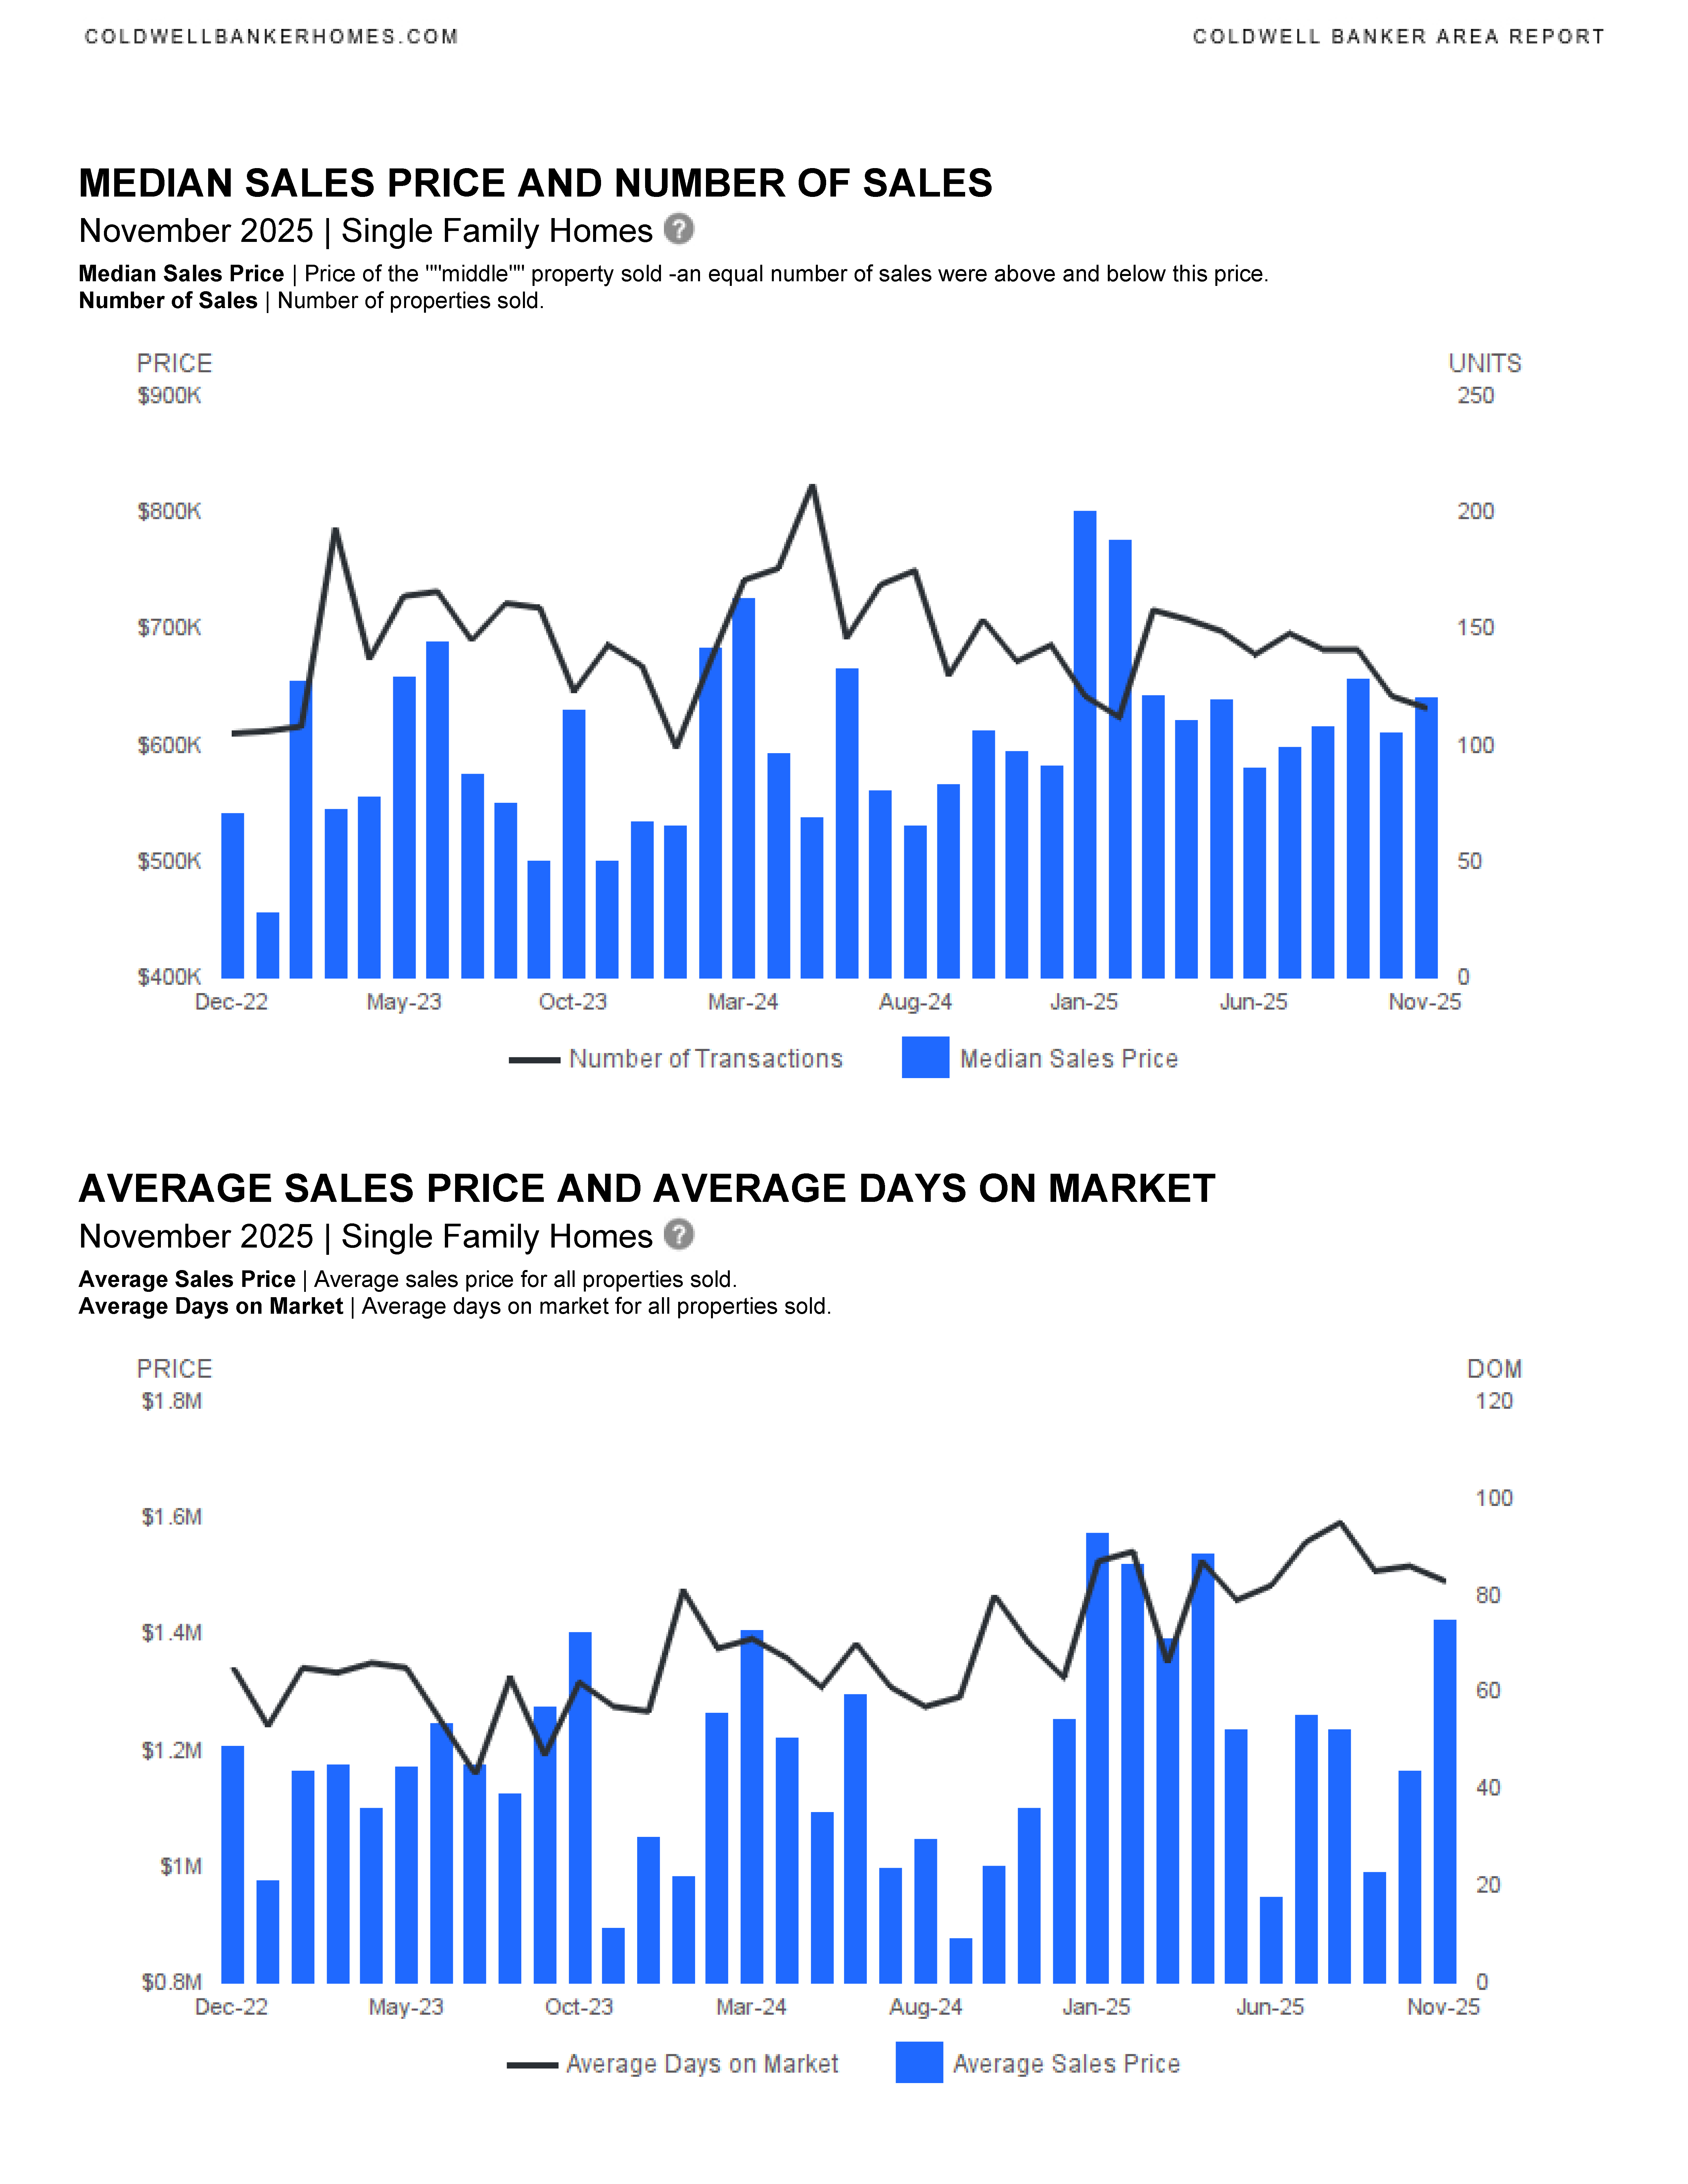
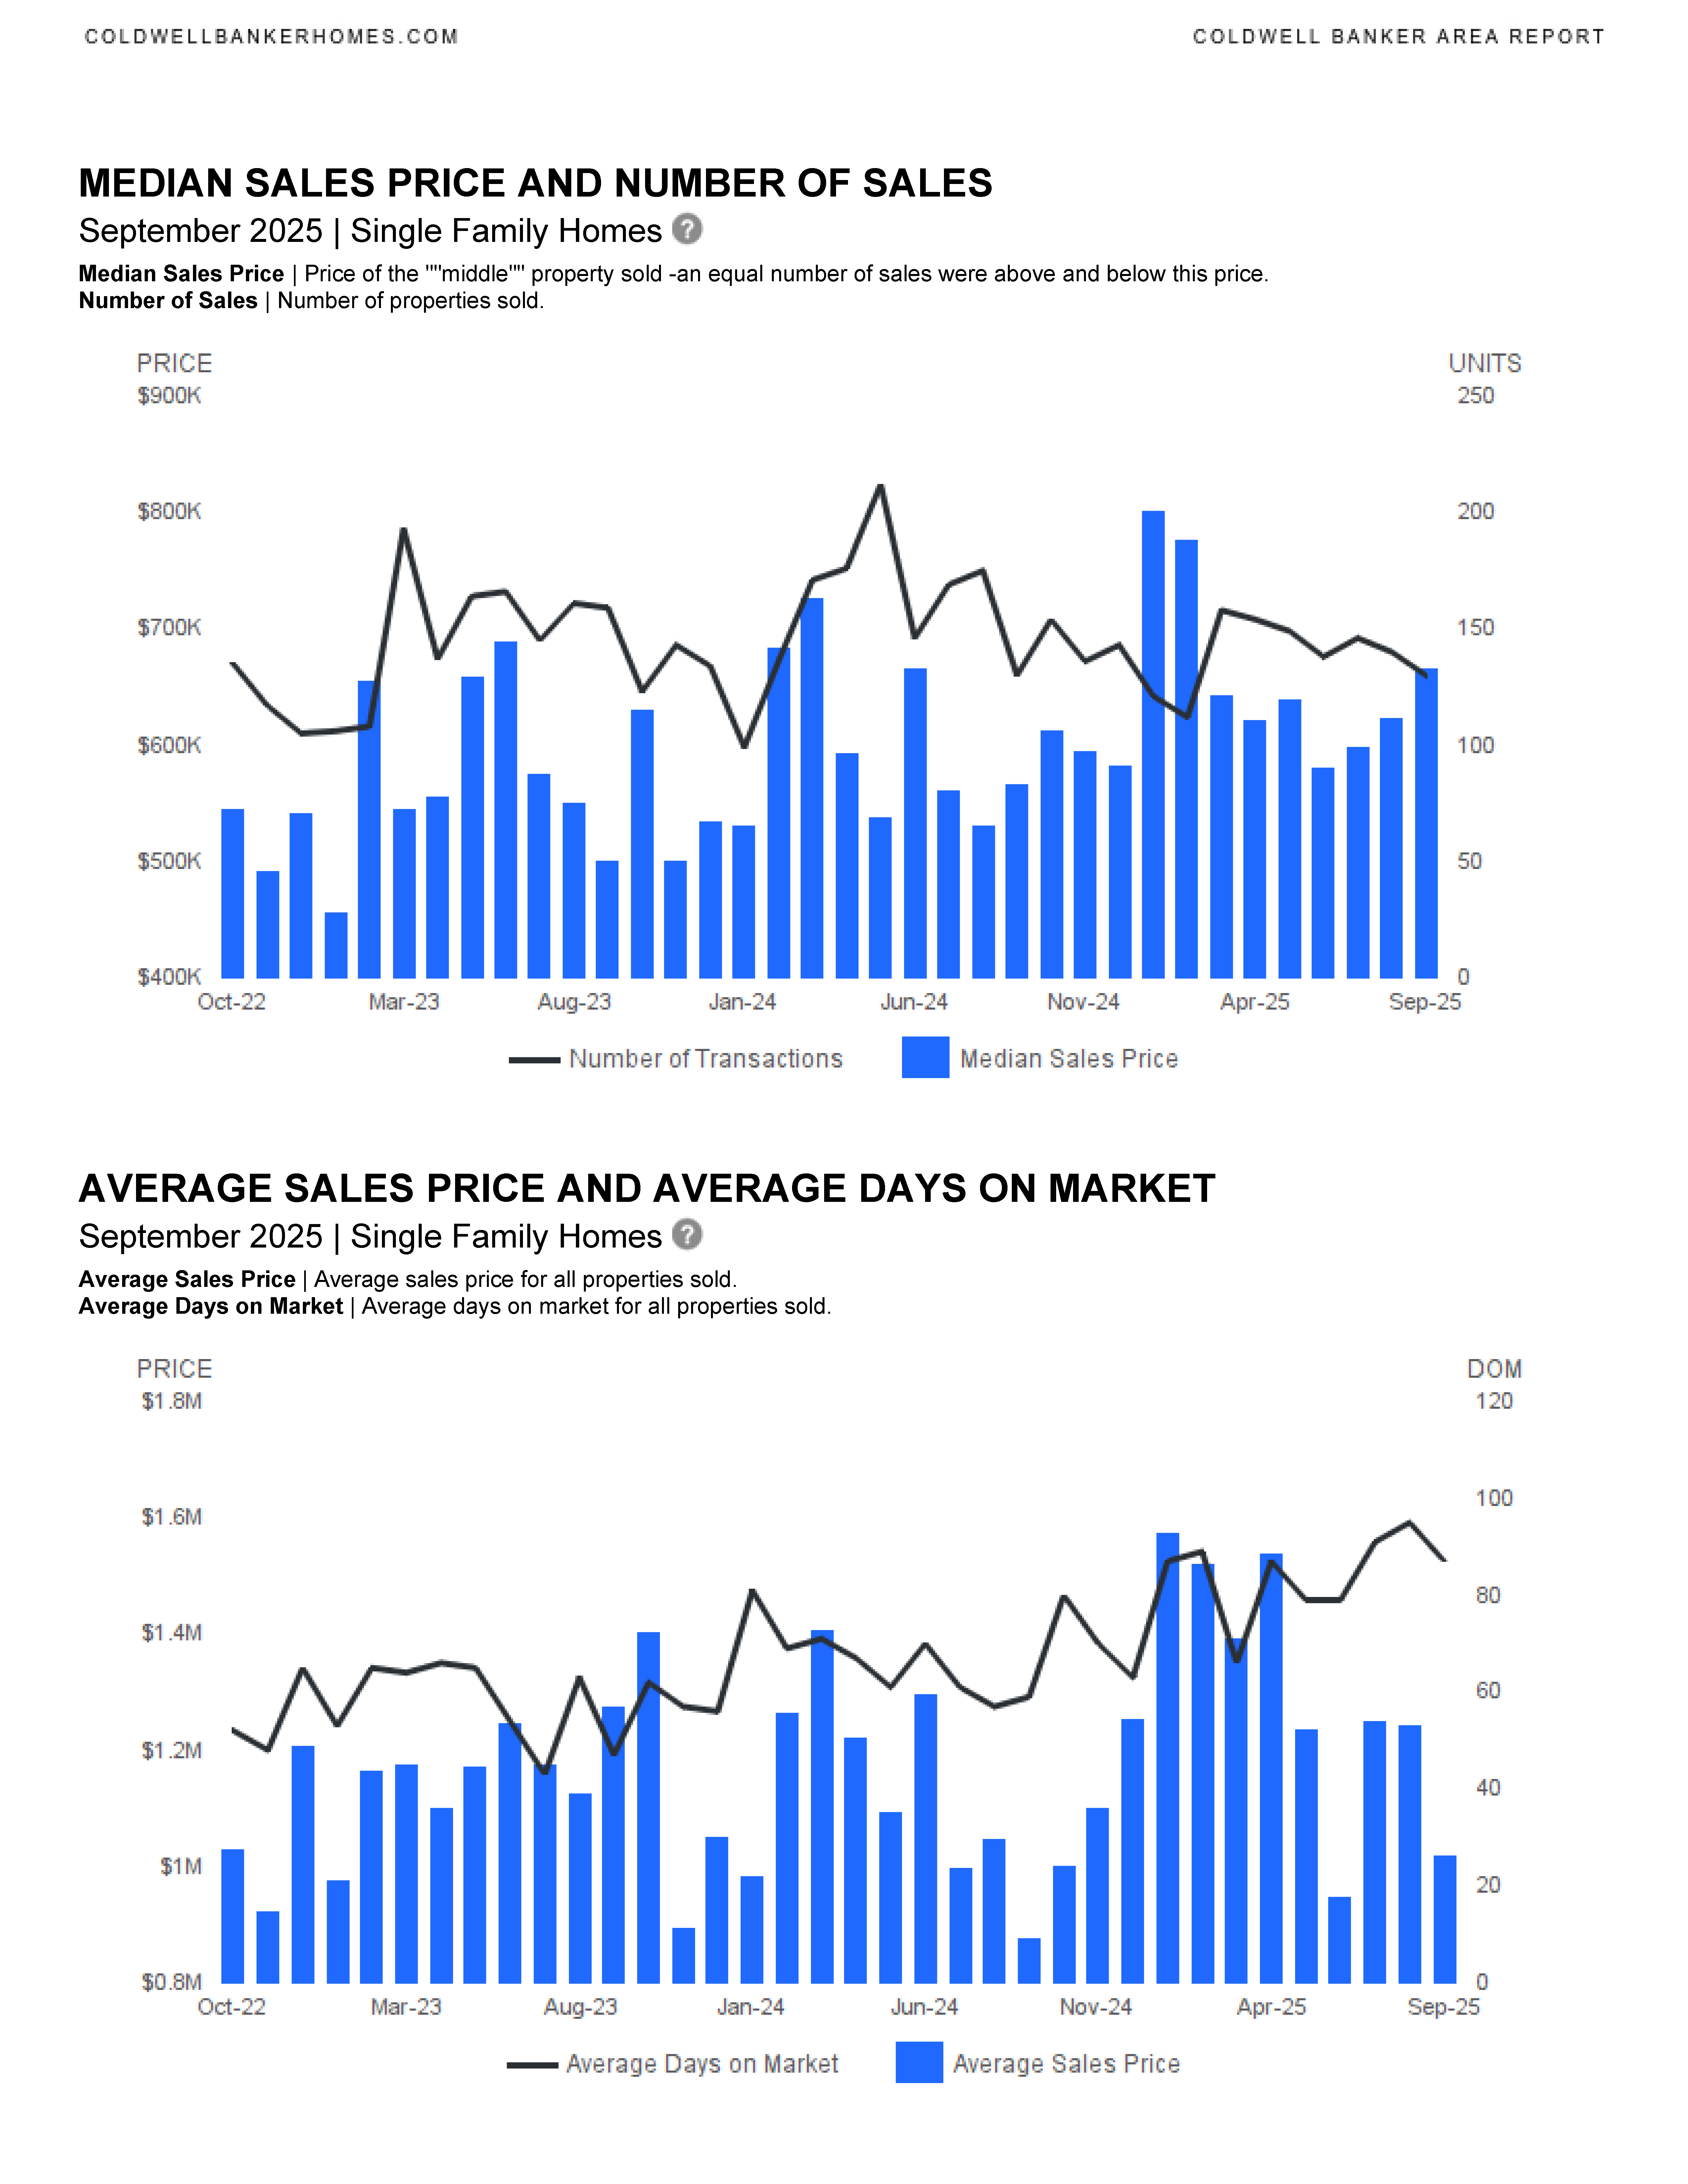
What is the difference between “Median Sales Price” and “Average Sales Price”?
Median Sales Price | Price of the “”middle”” property sold -an equal number of sales were above and below this price.
Average Sales Price | Average sales price for all properties sold.
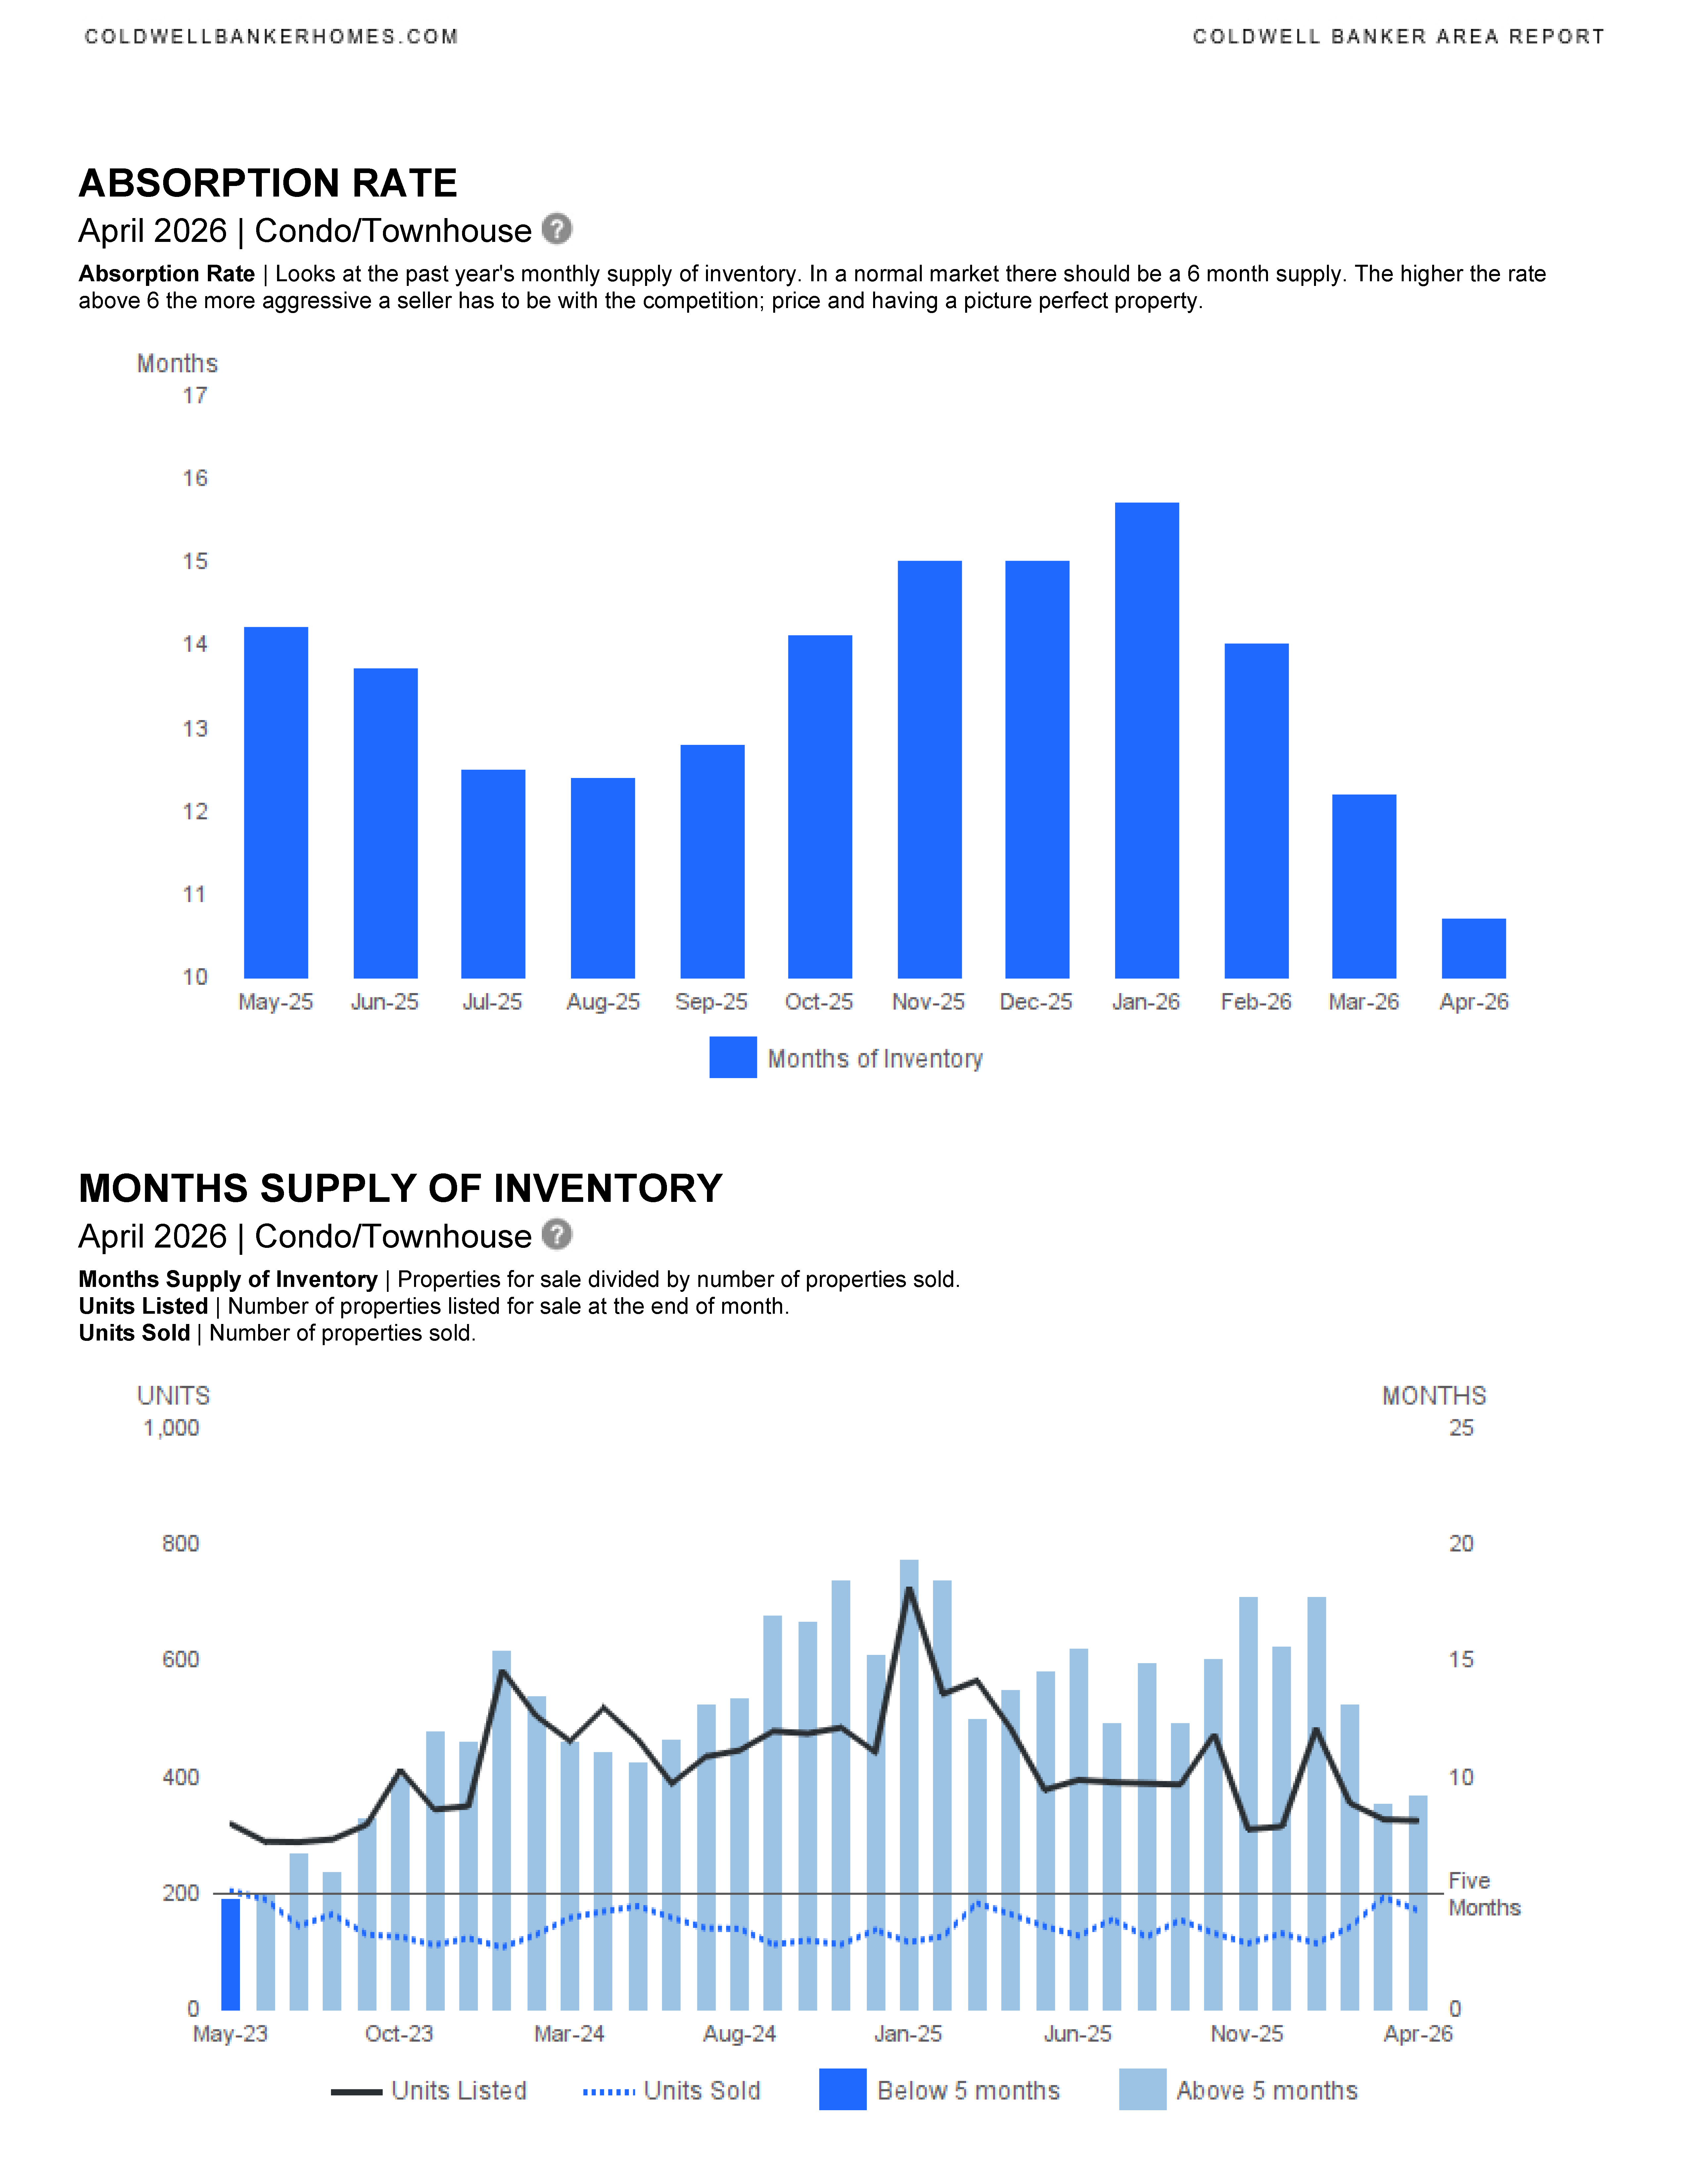
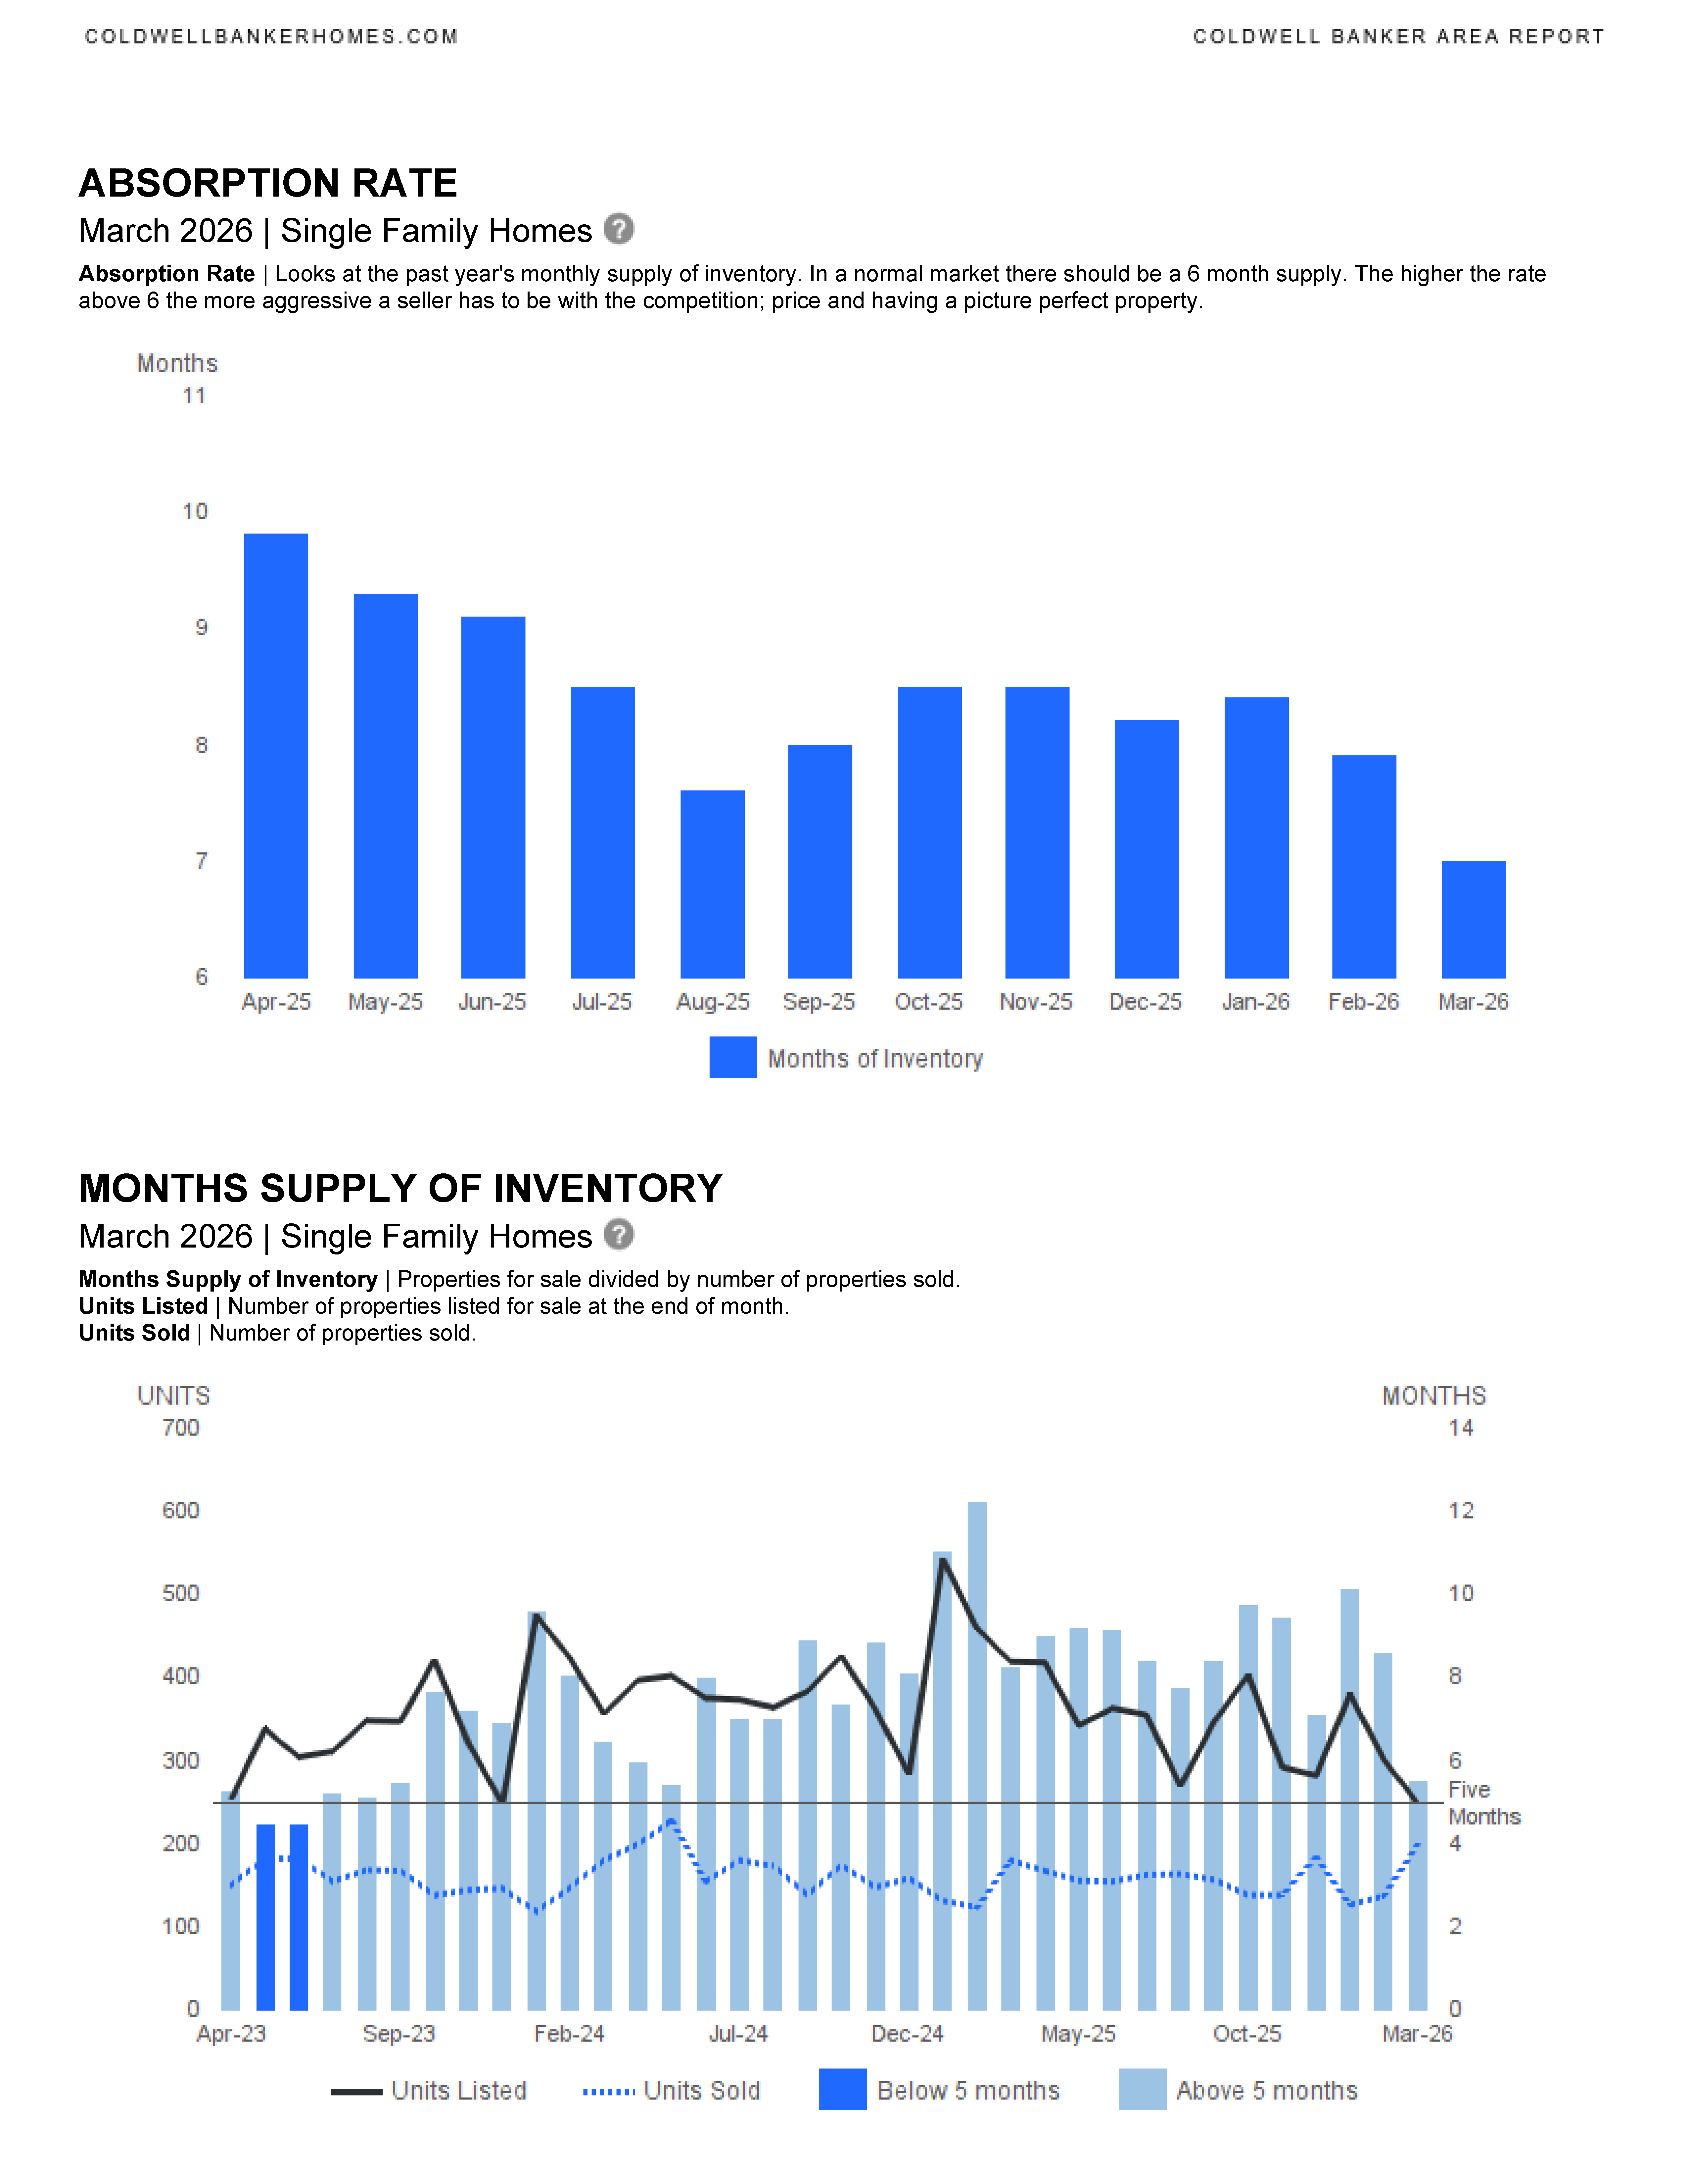
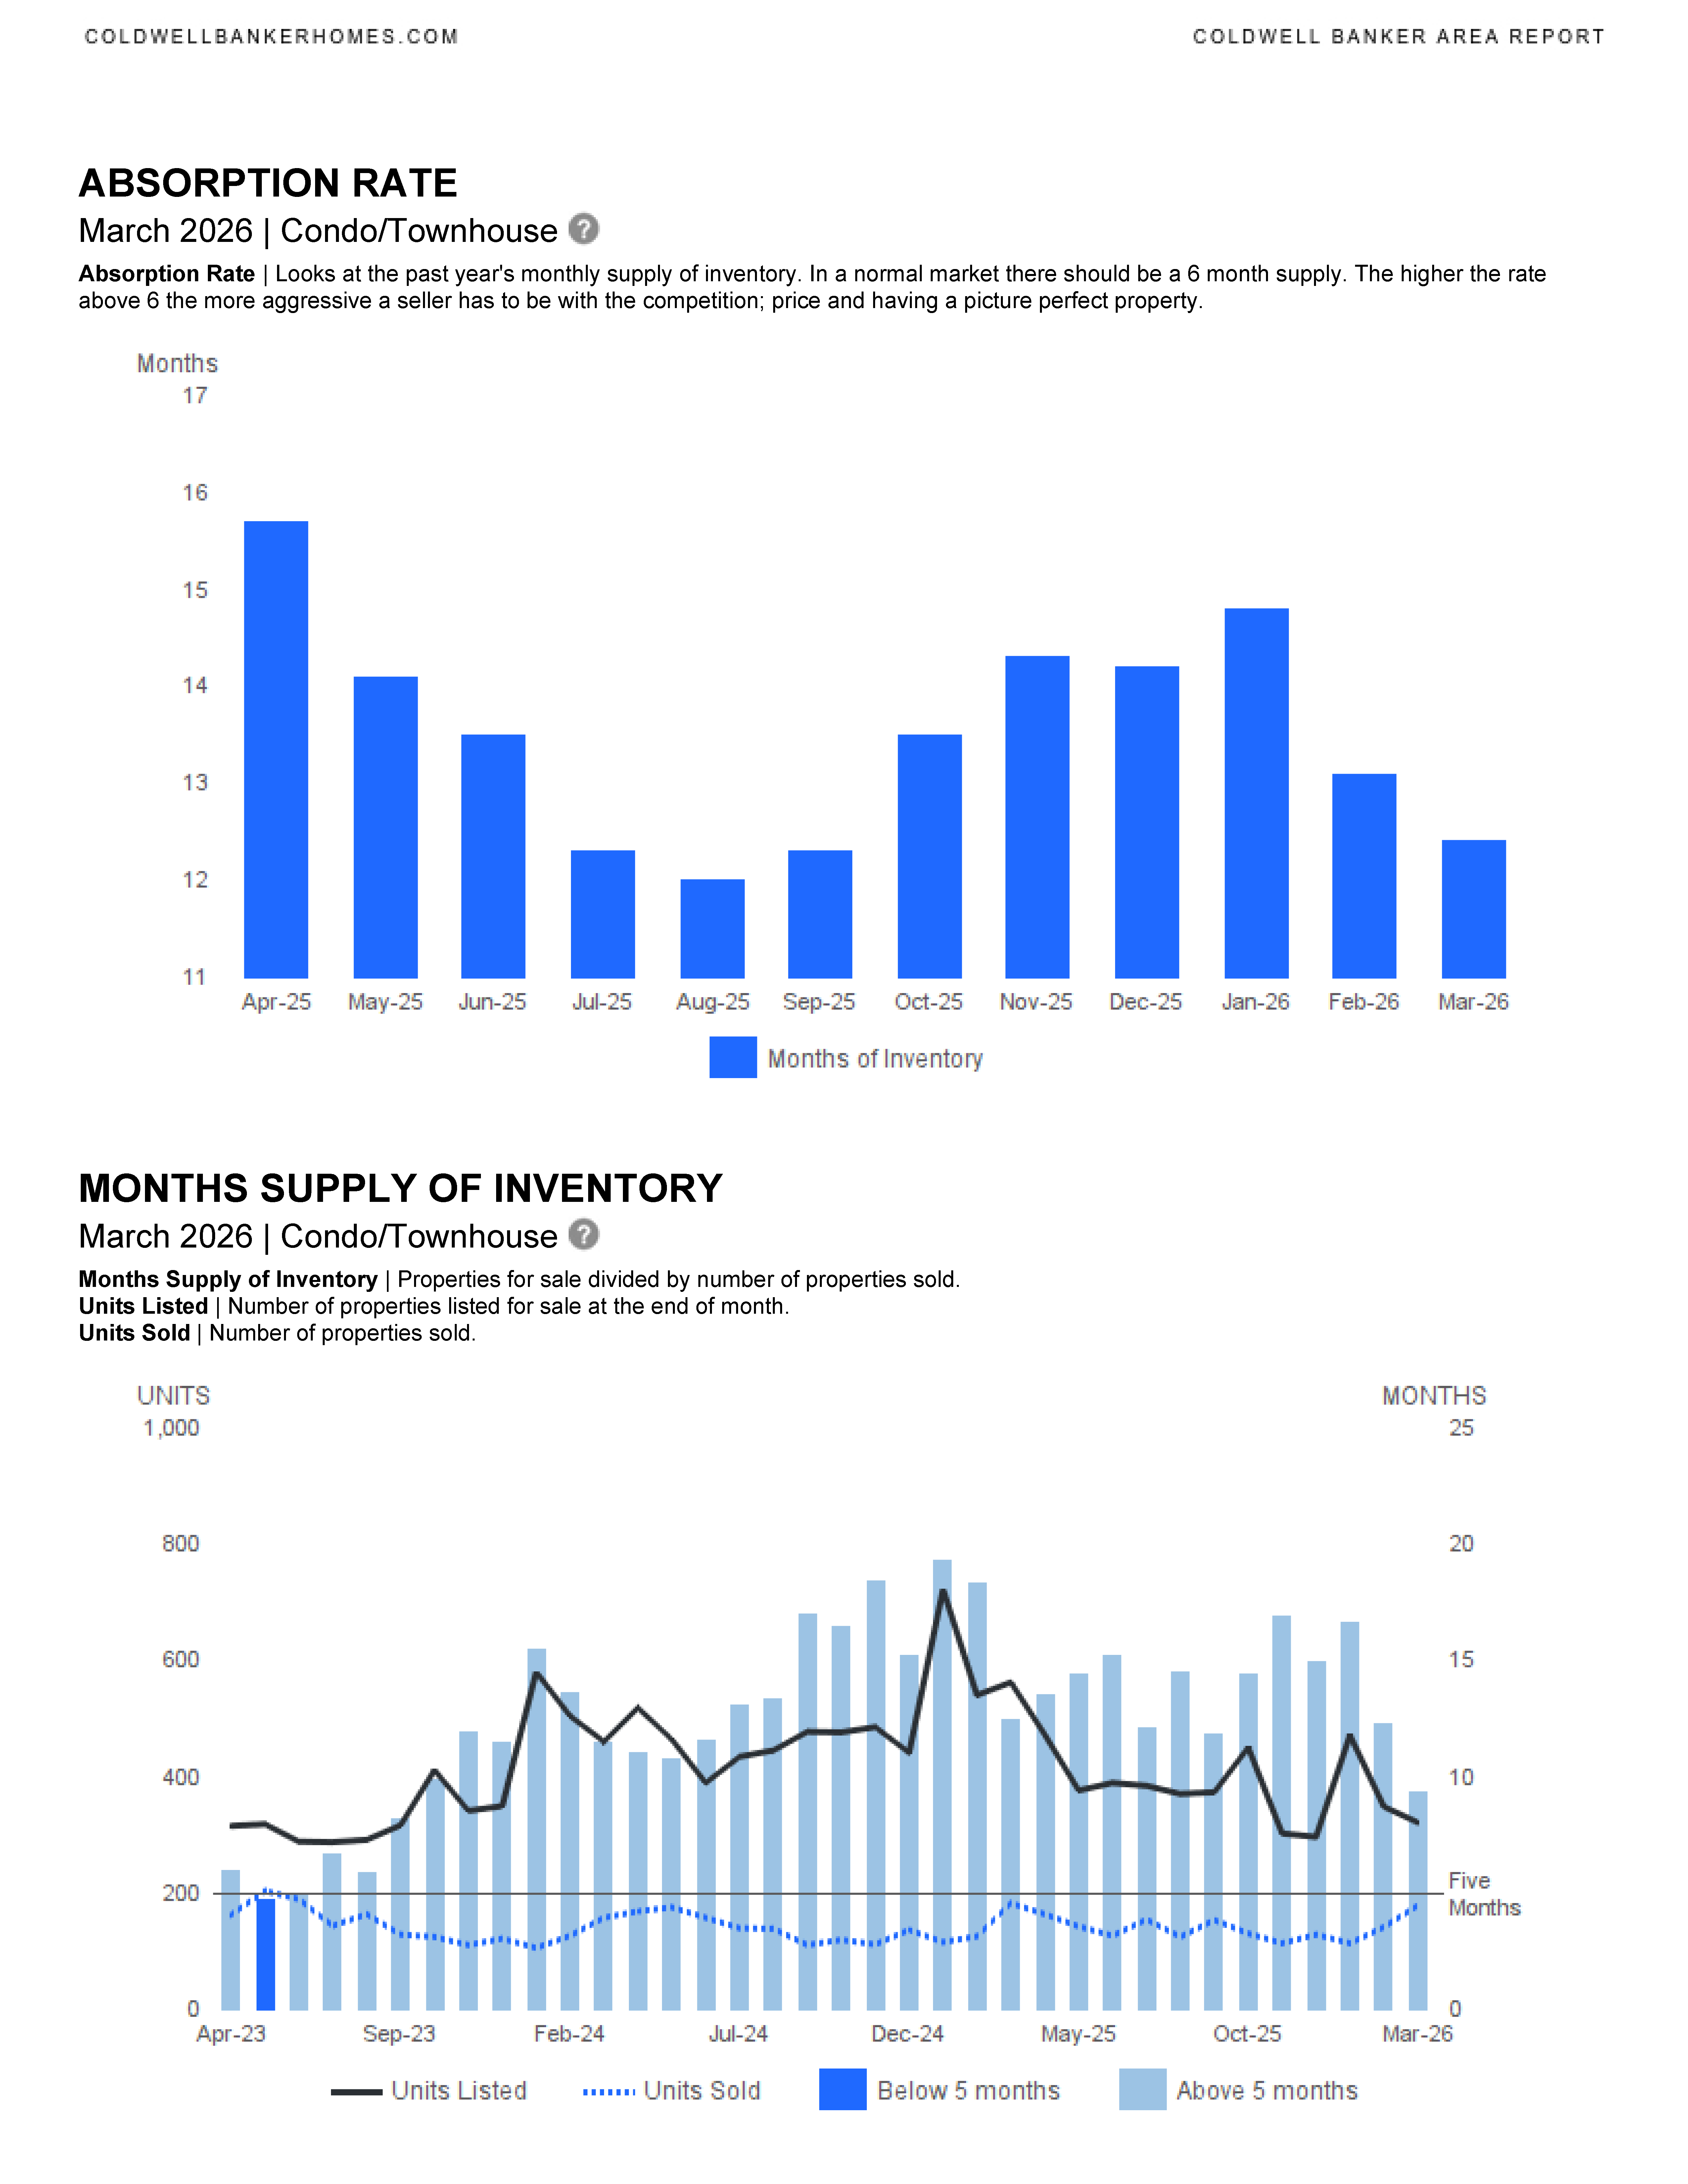
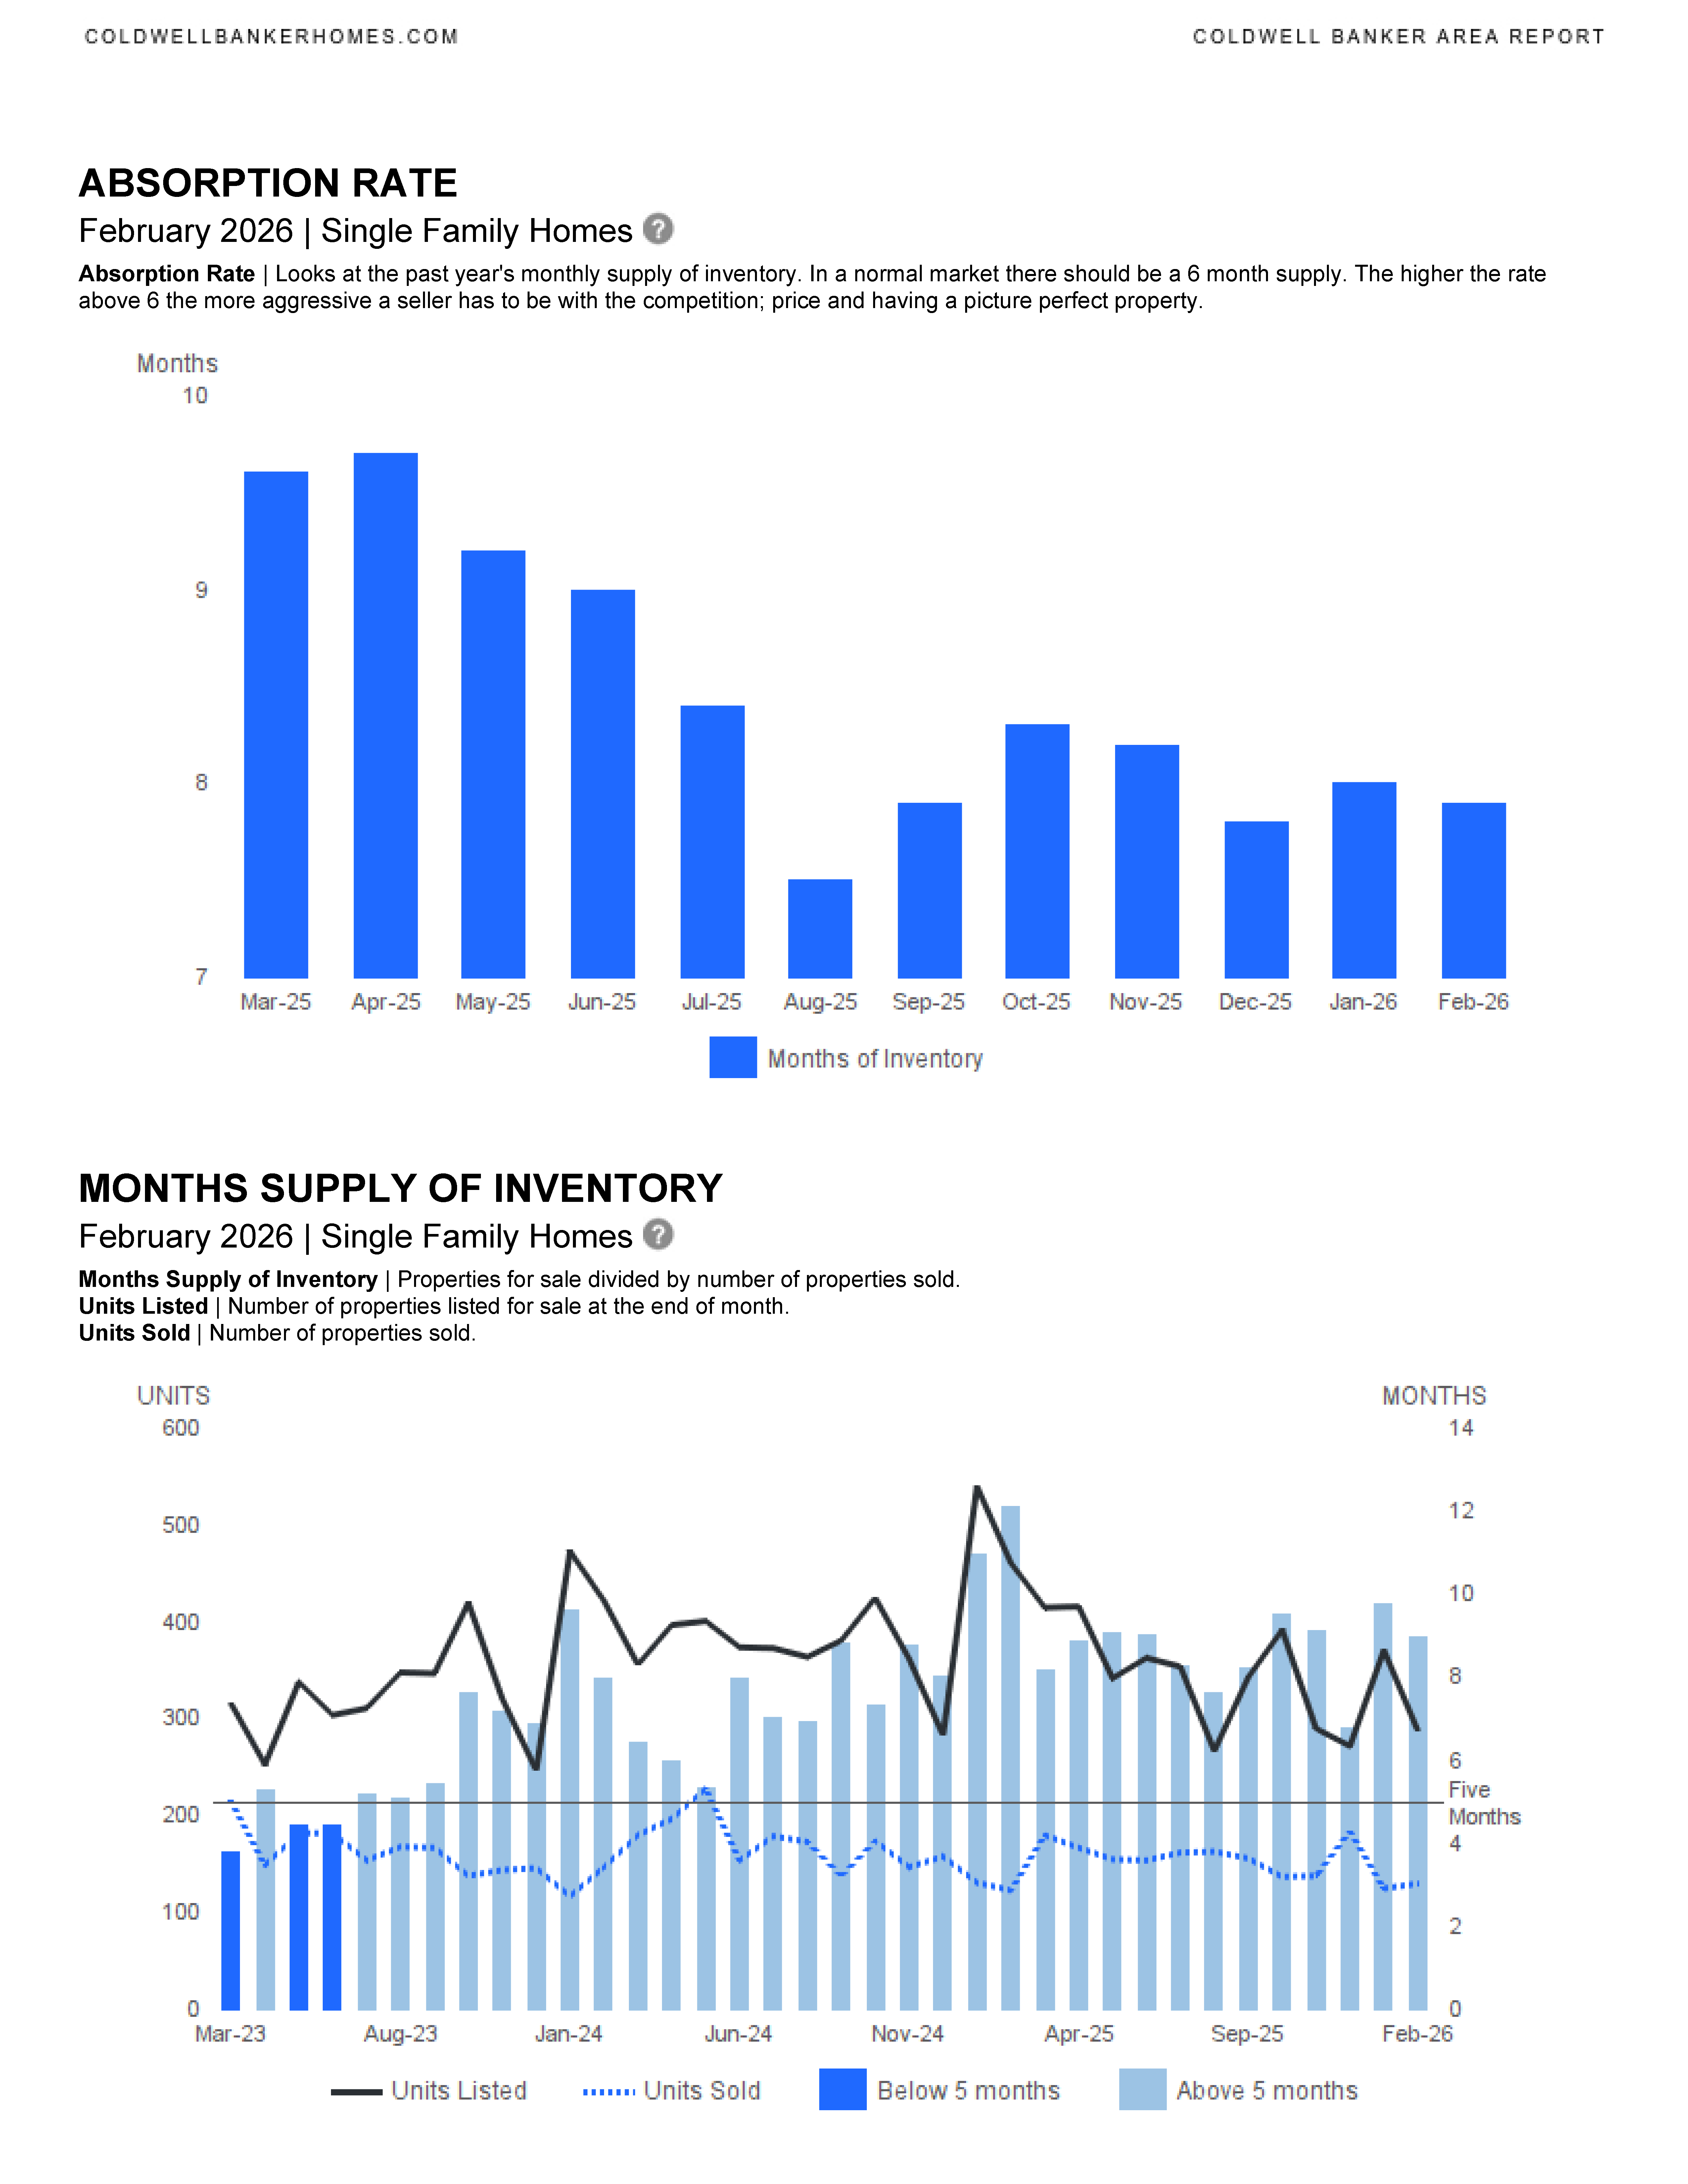
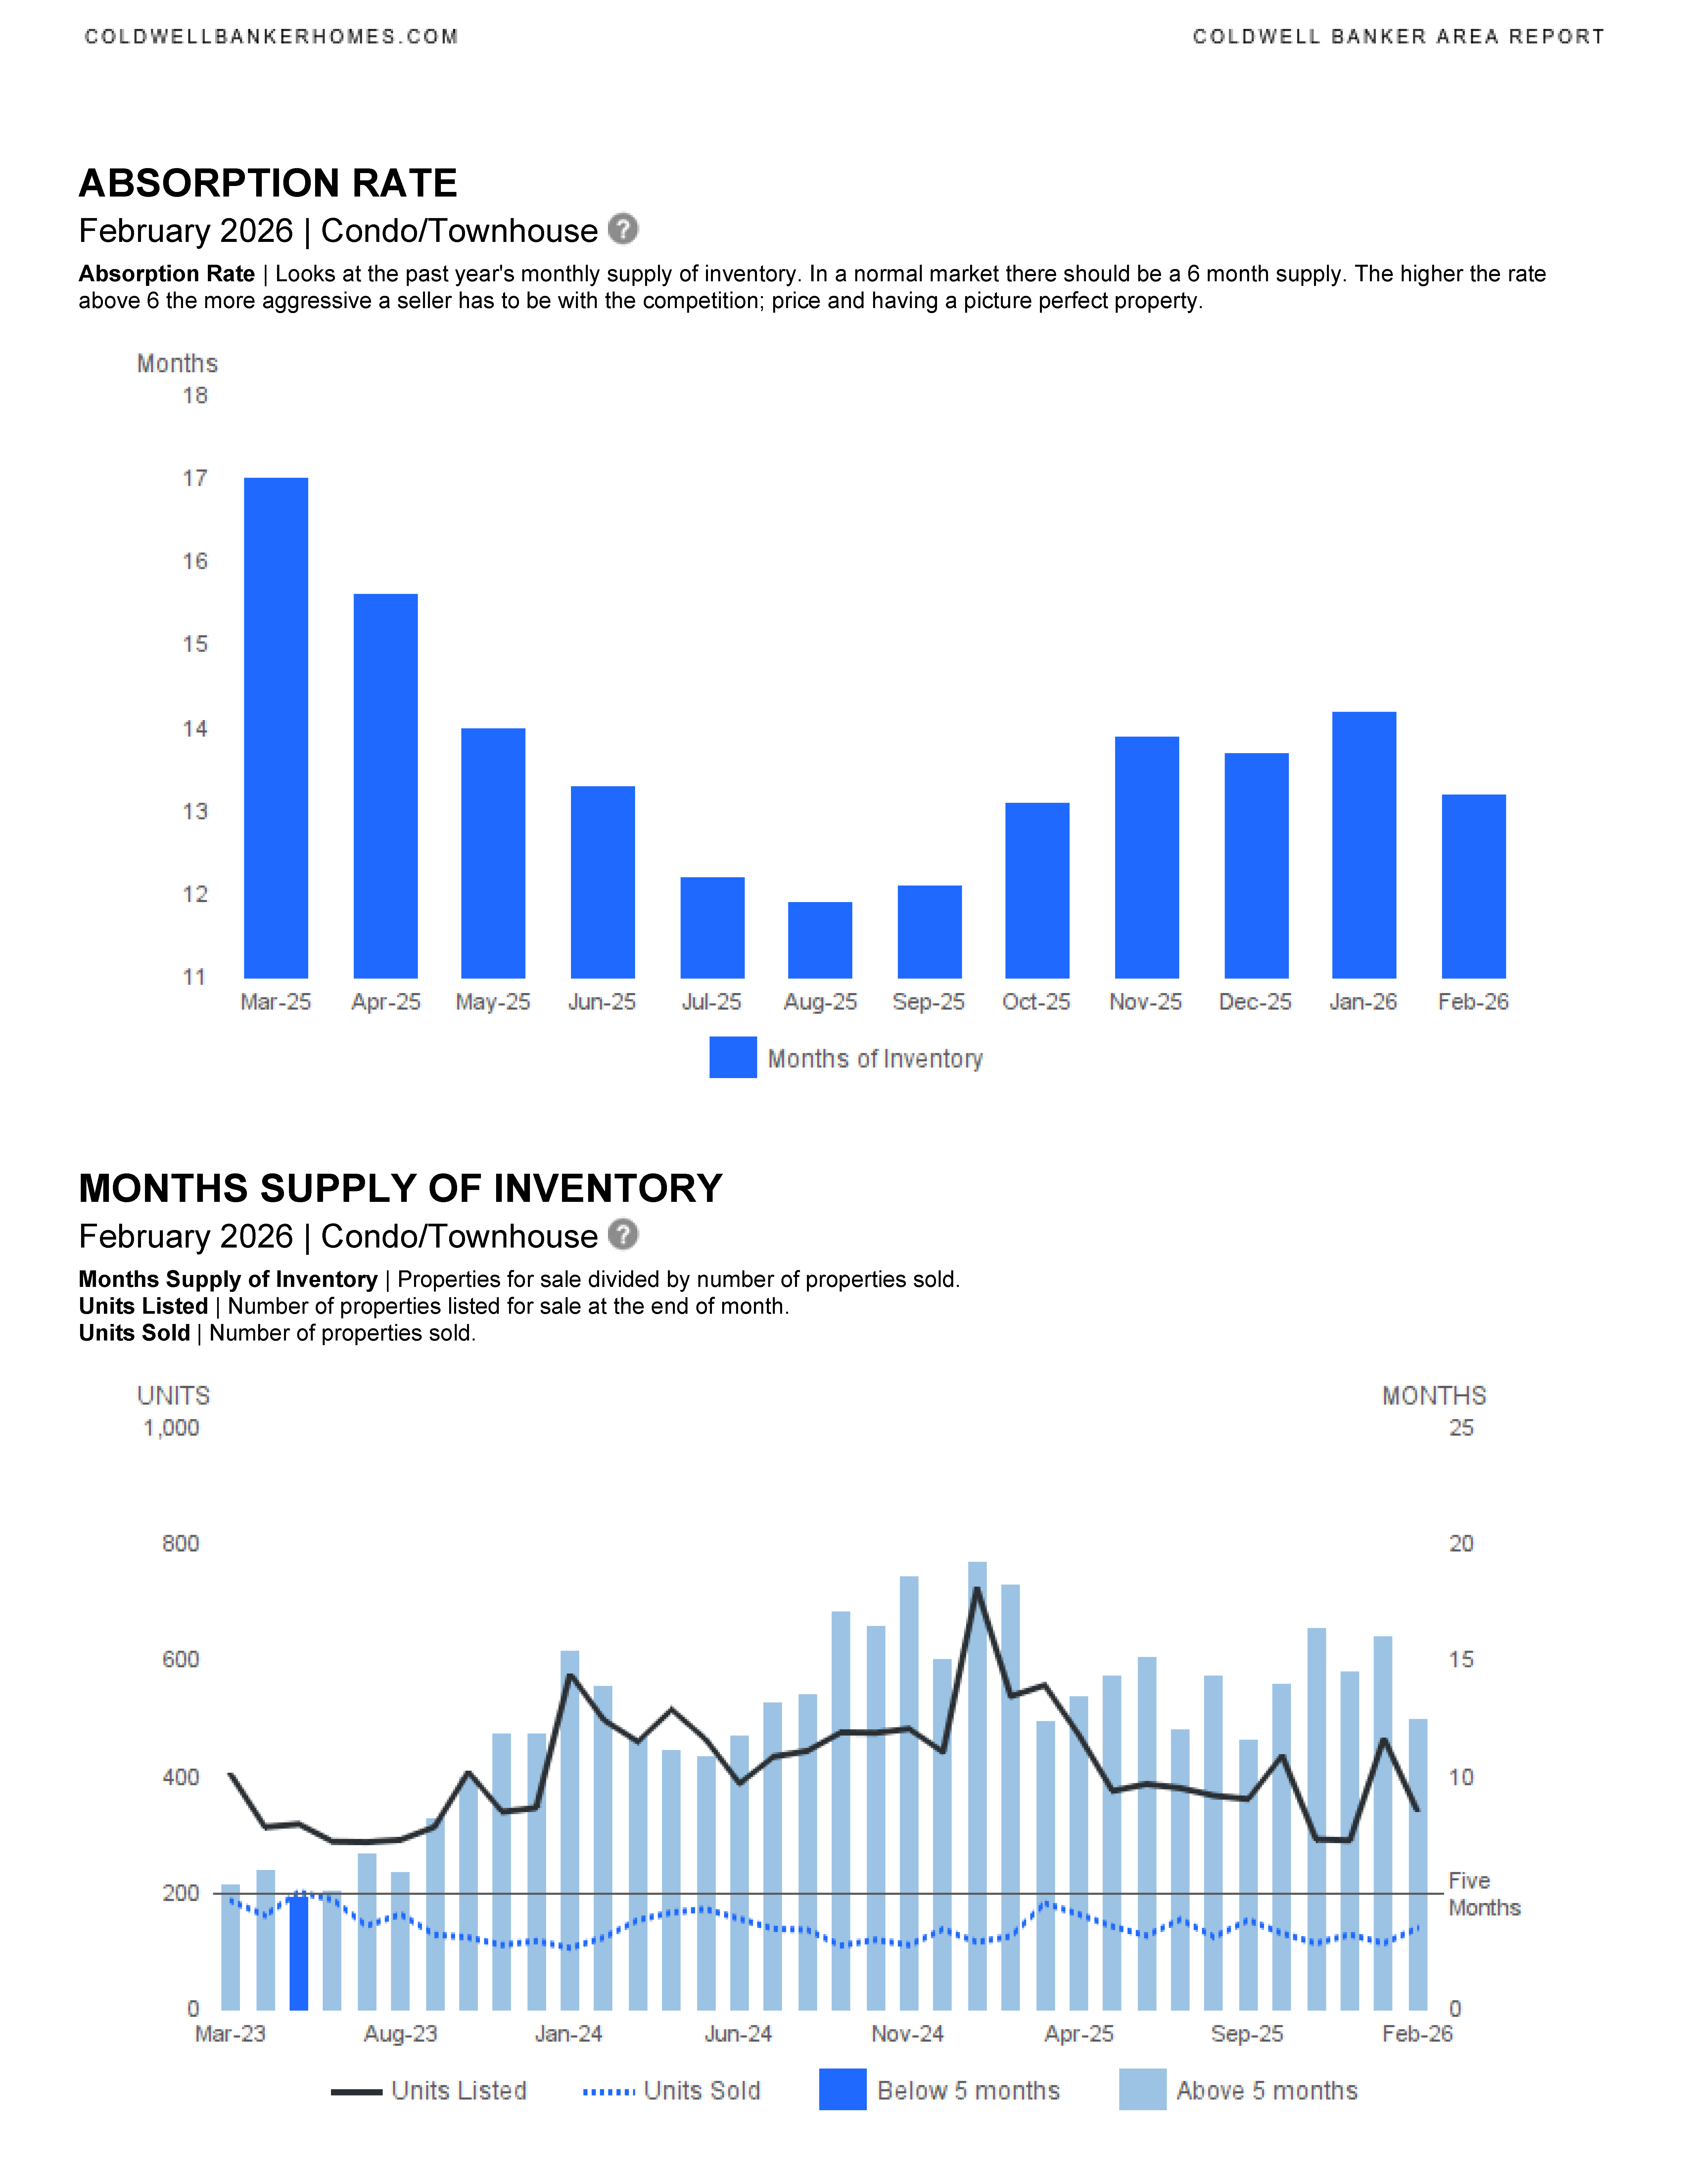
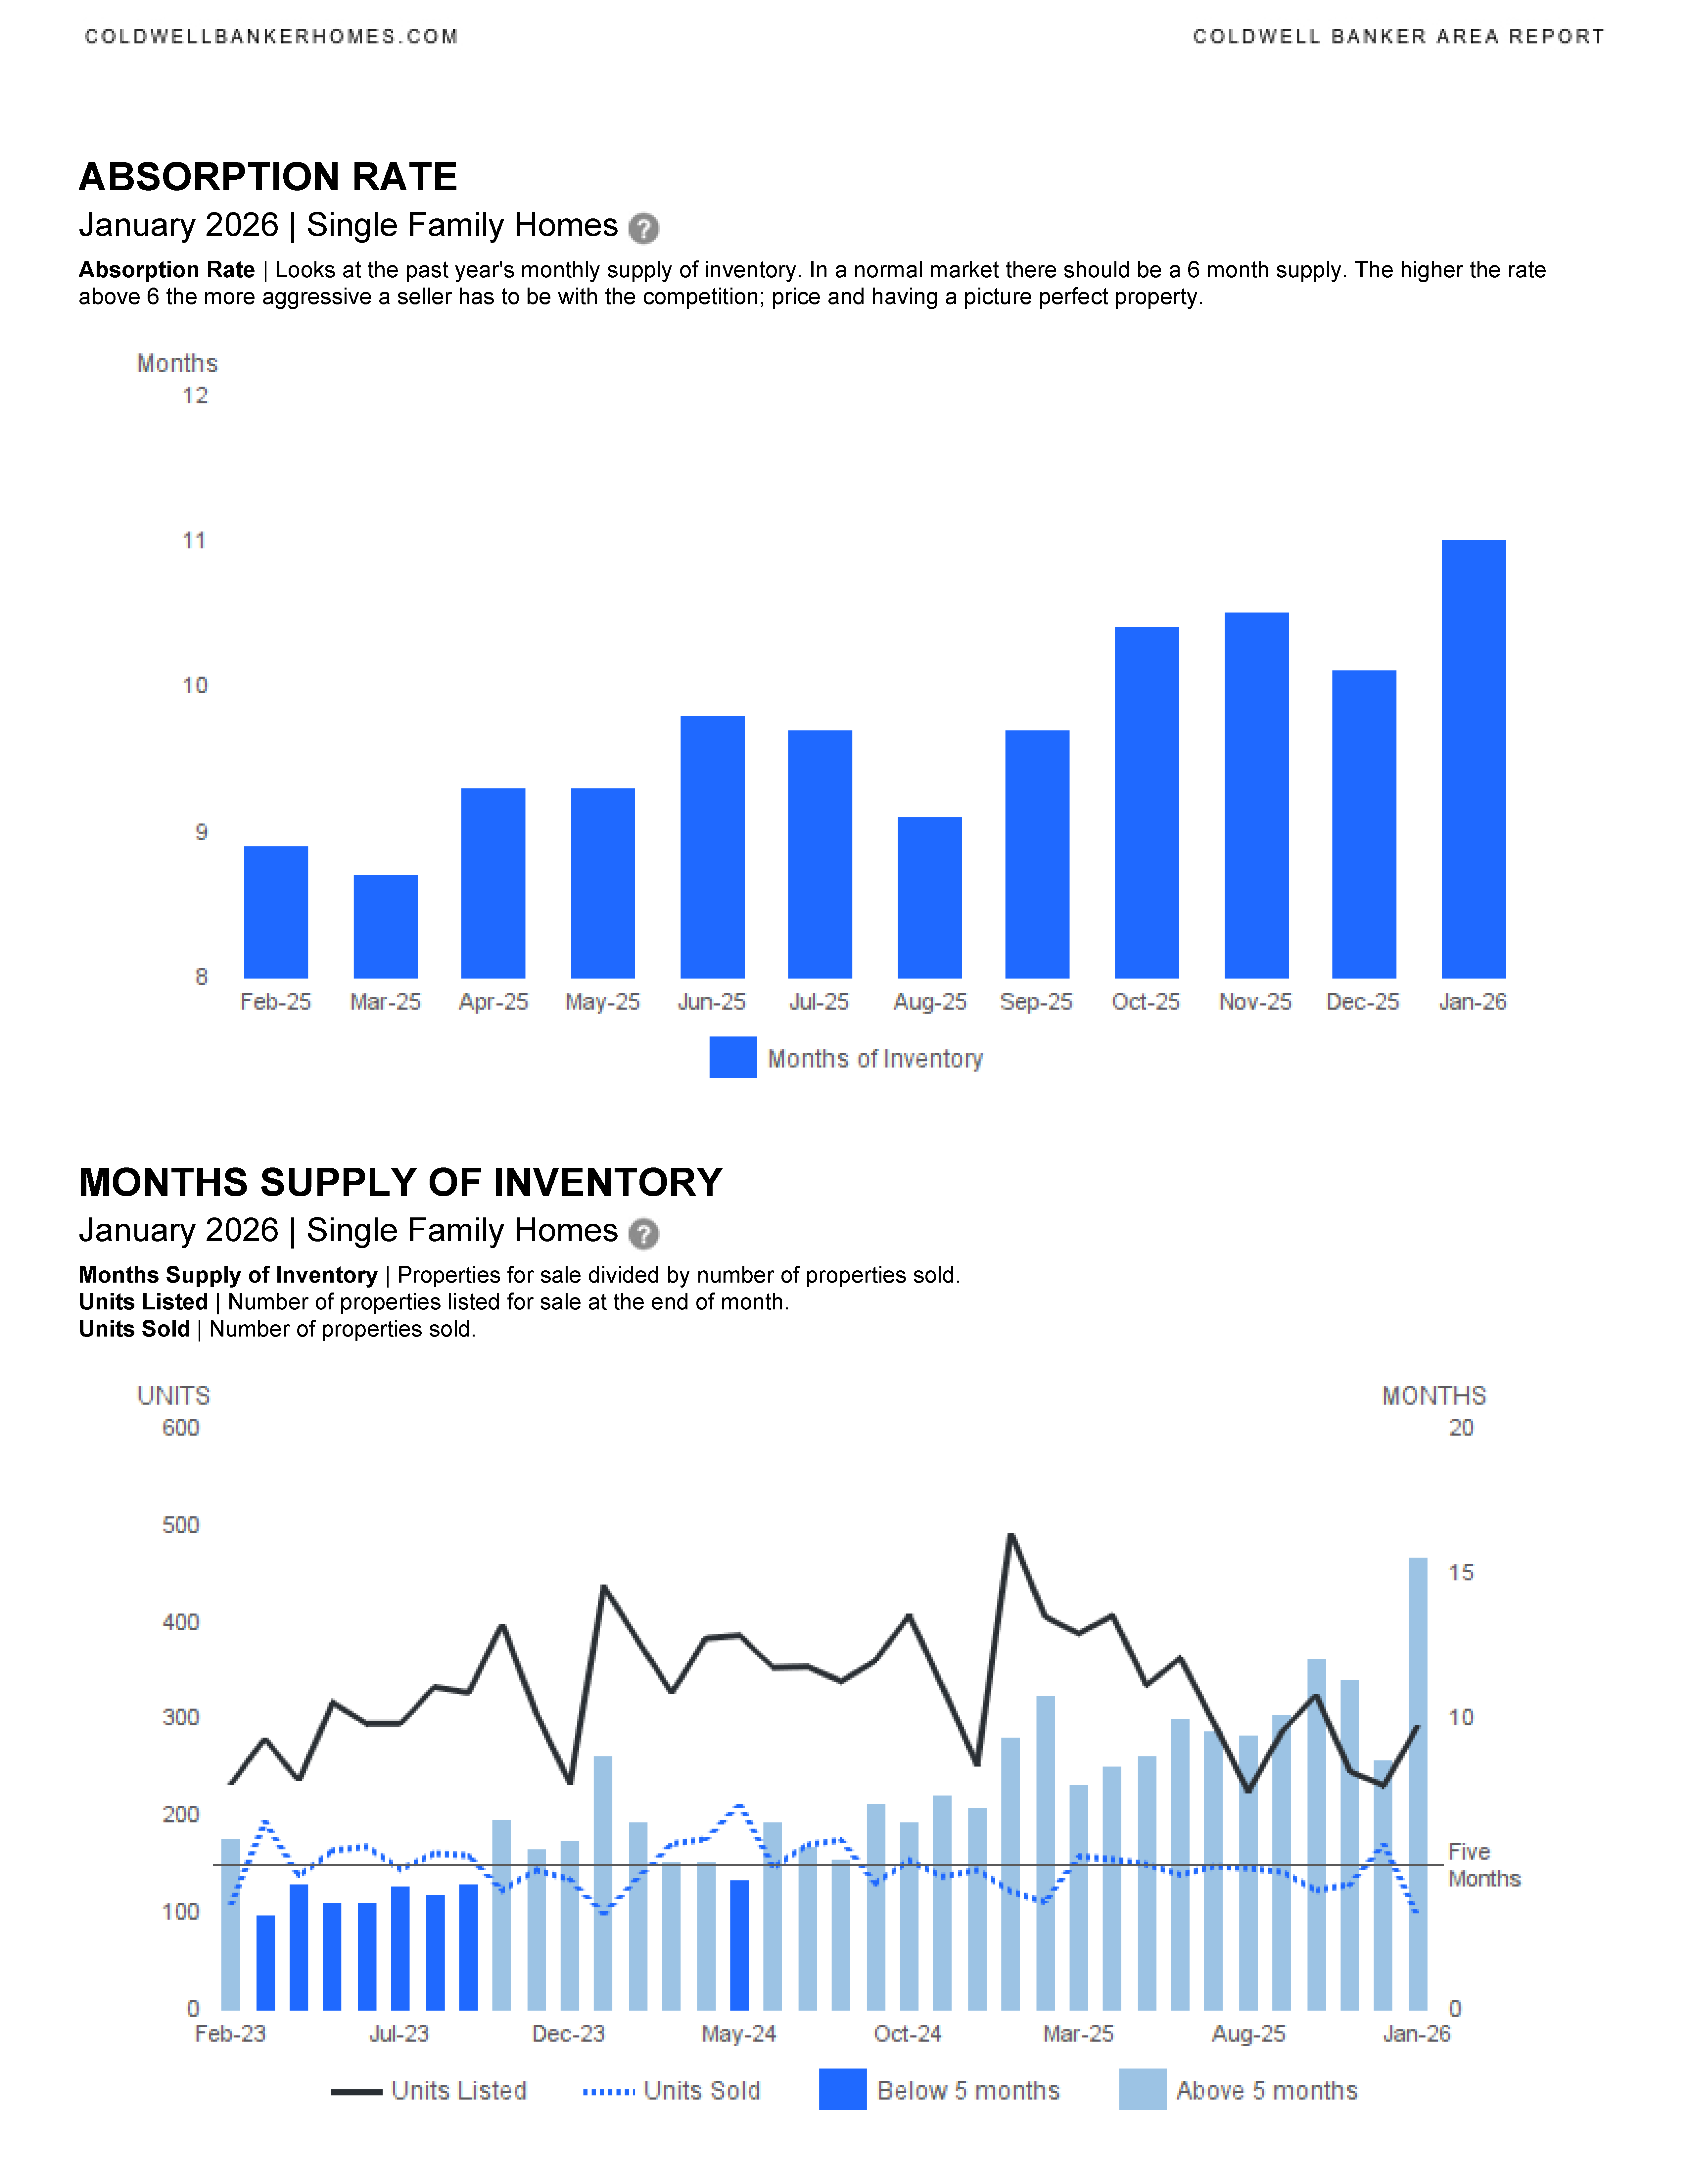
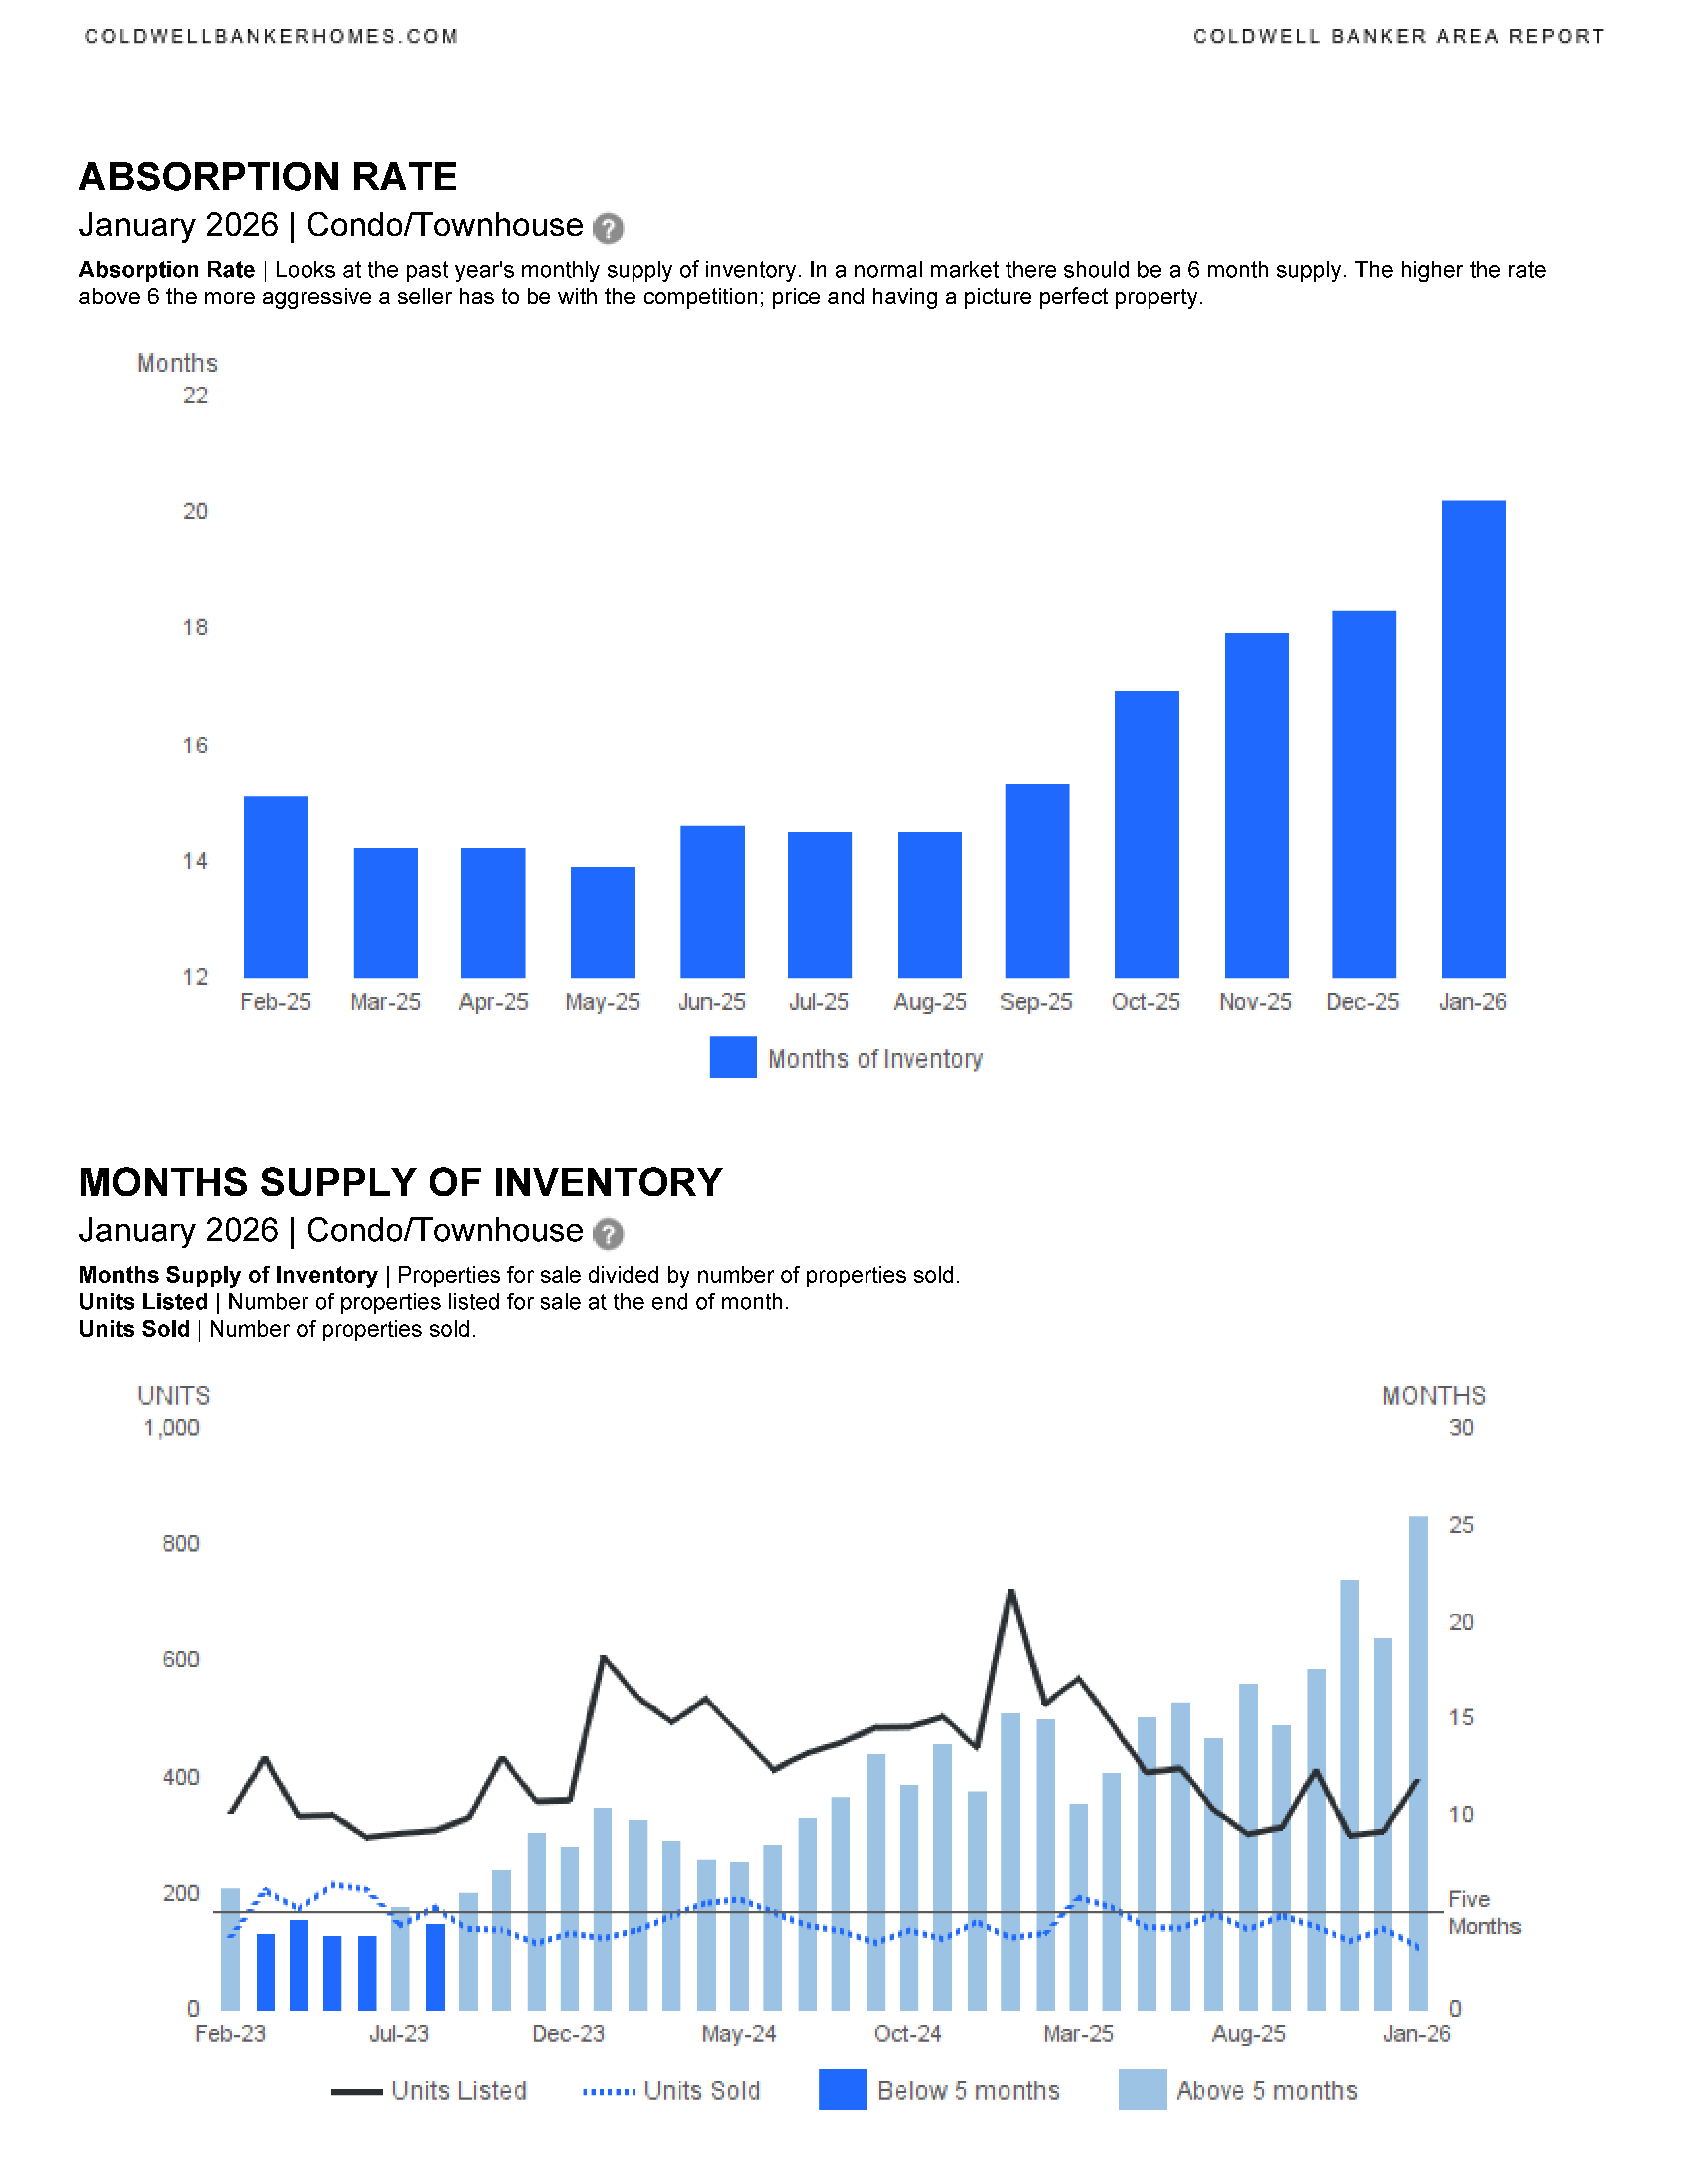
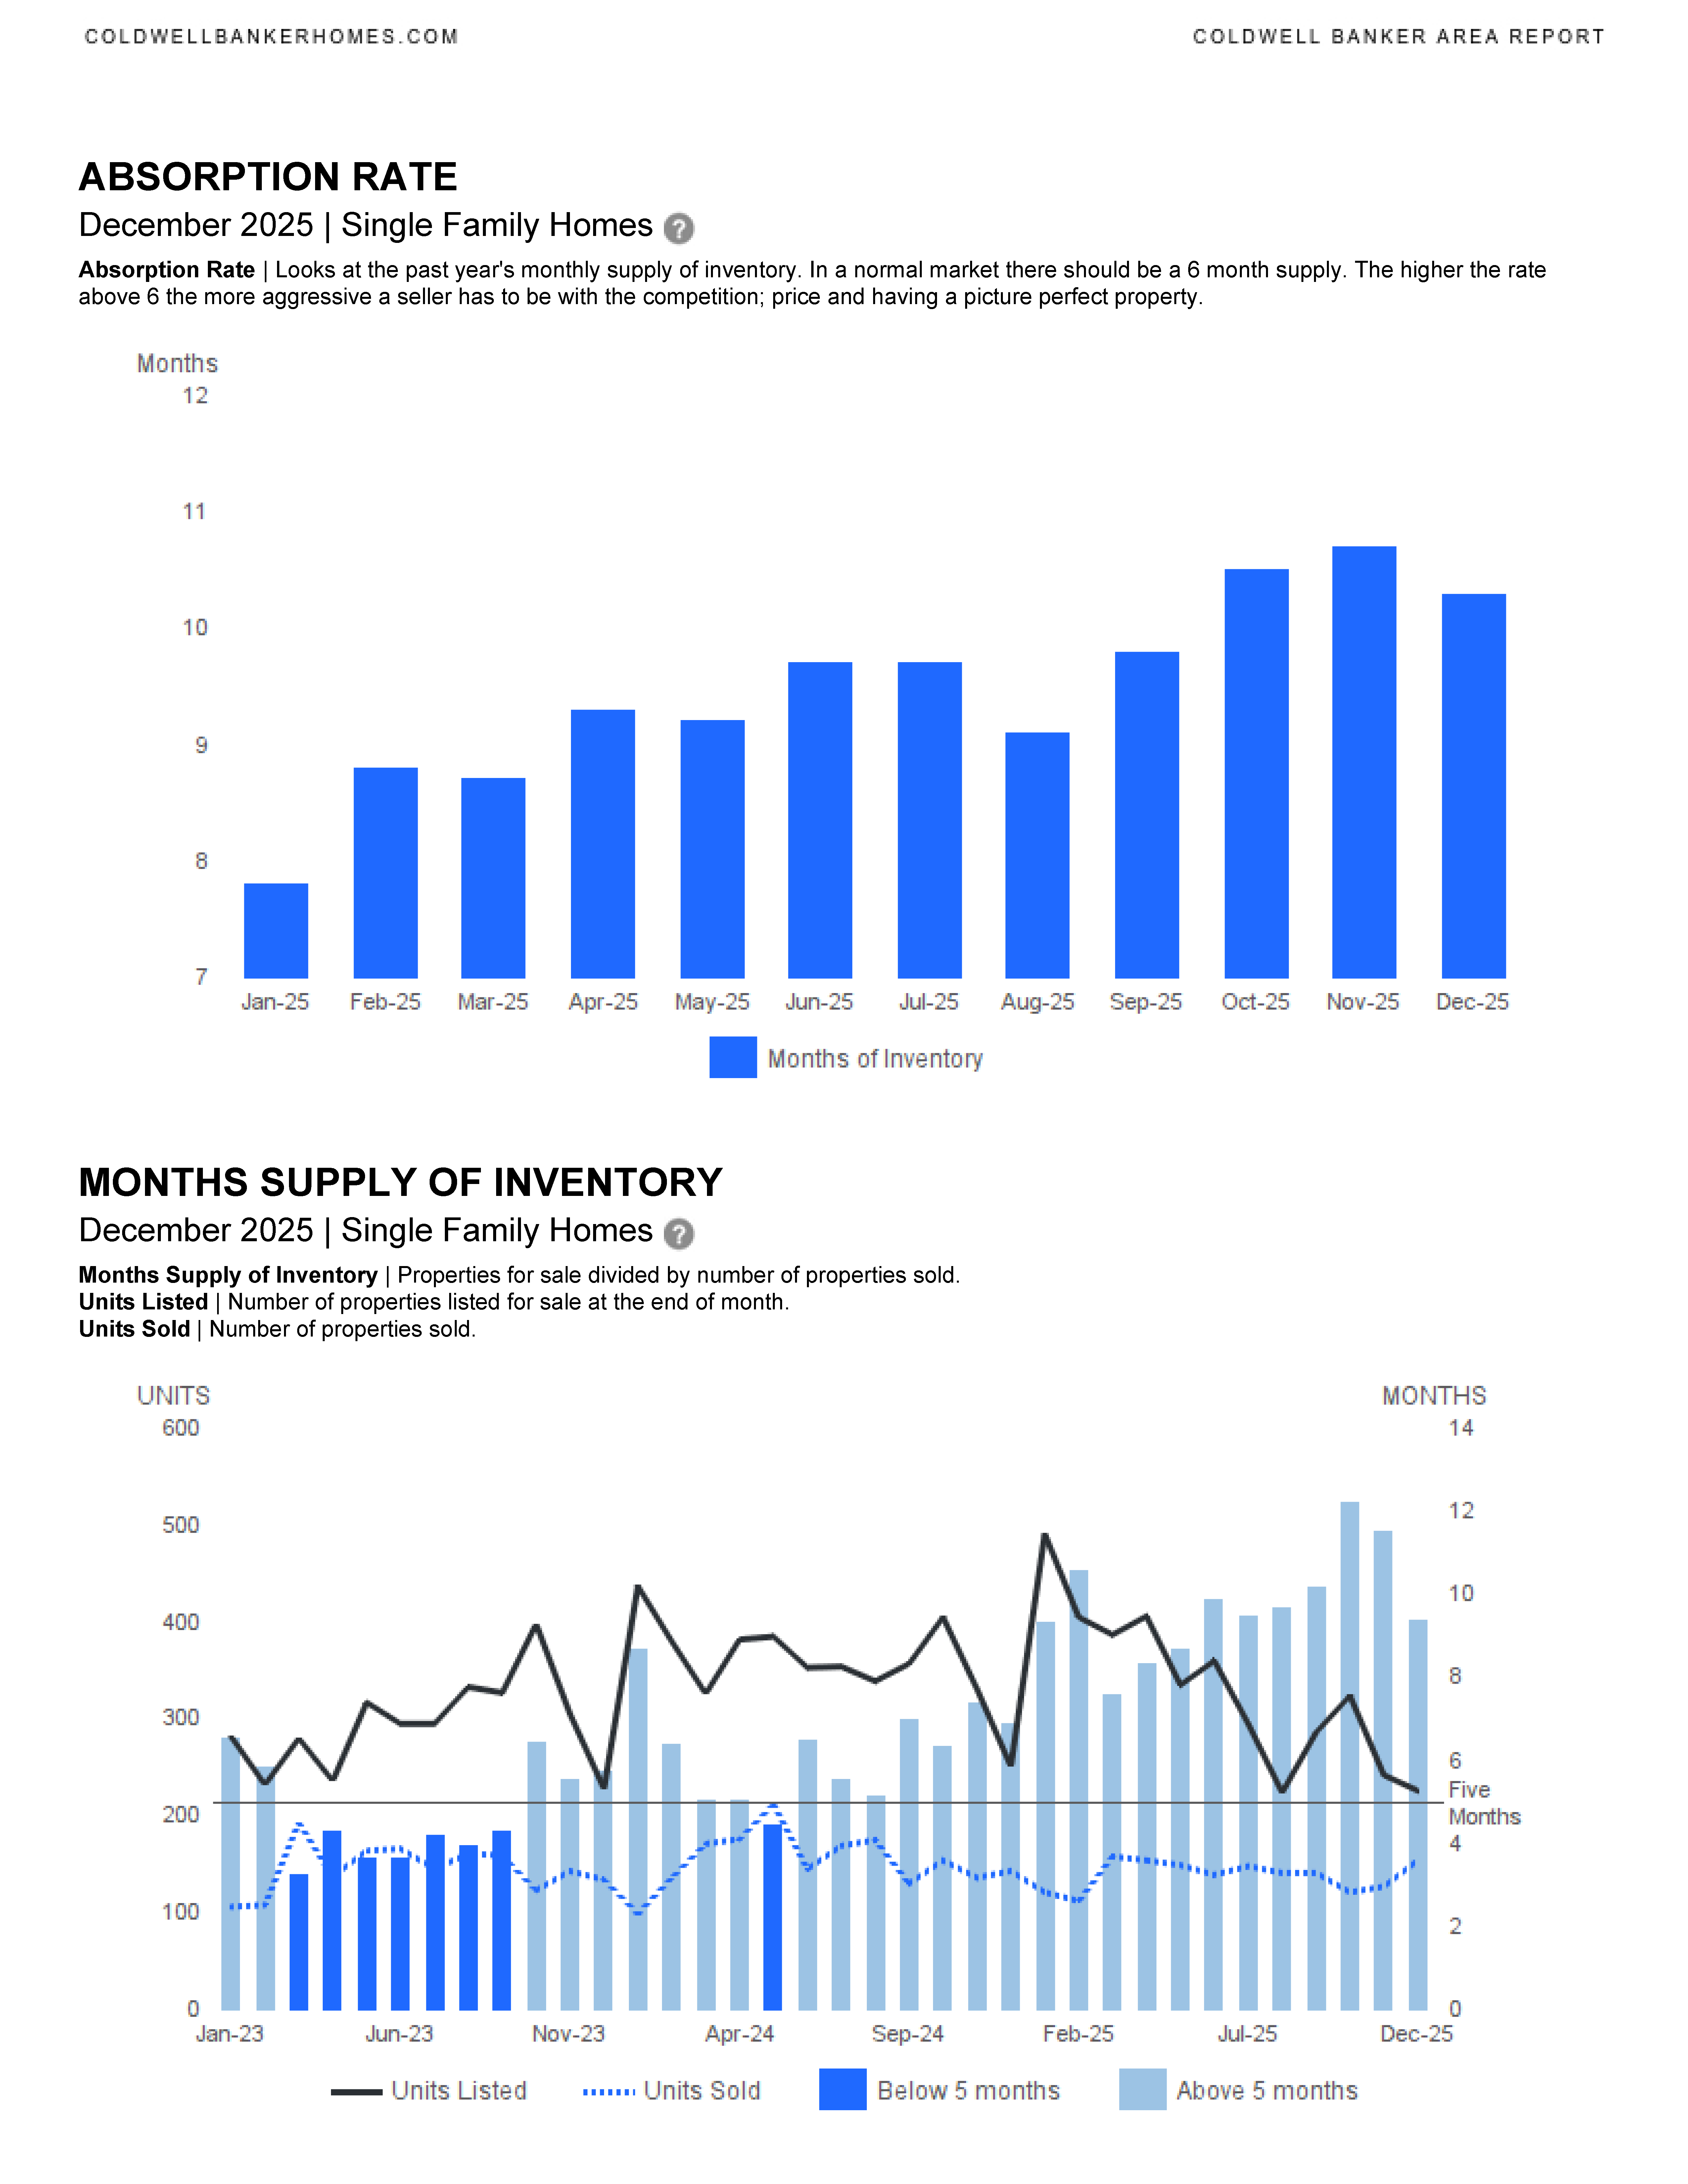
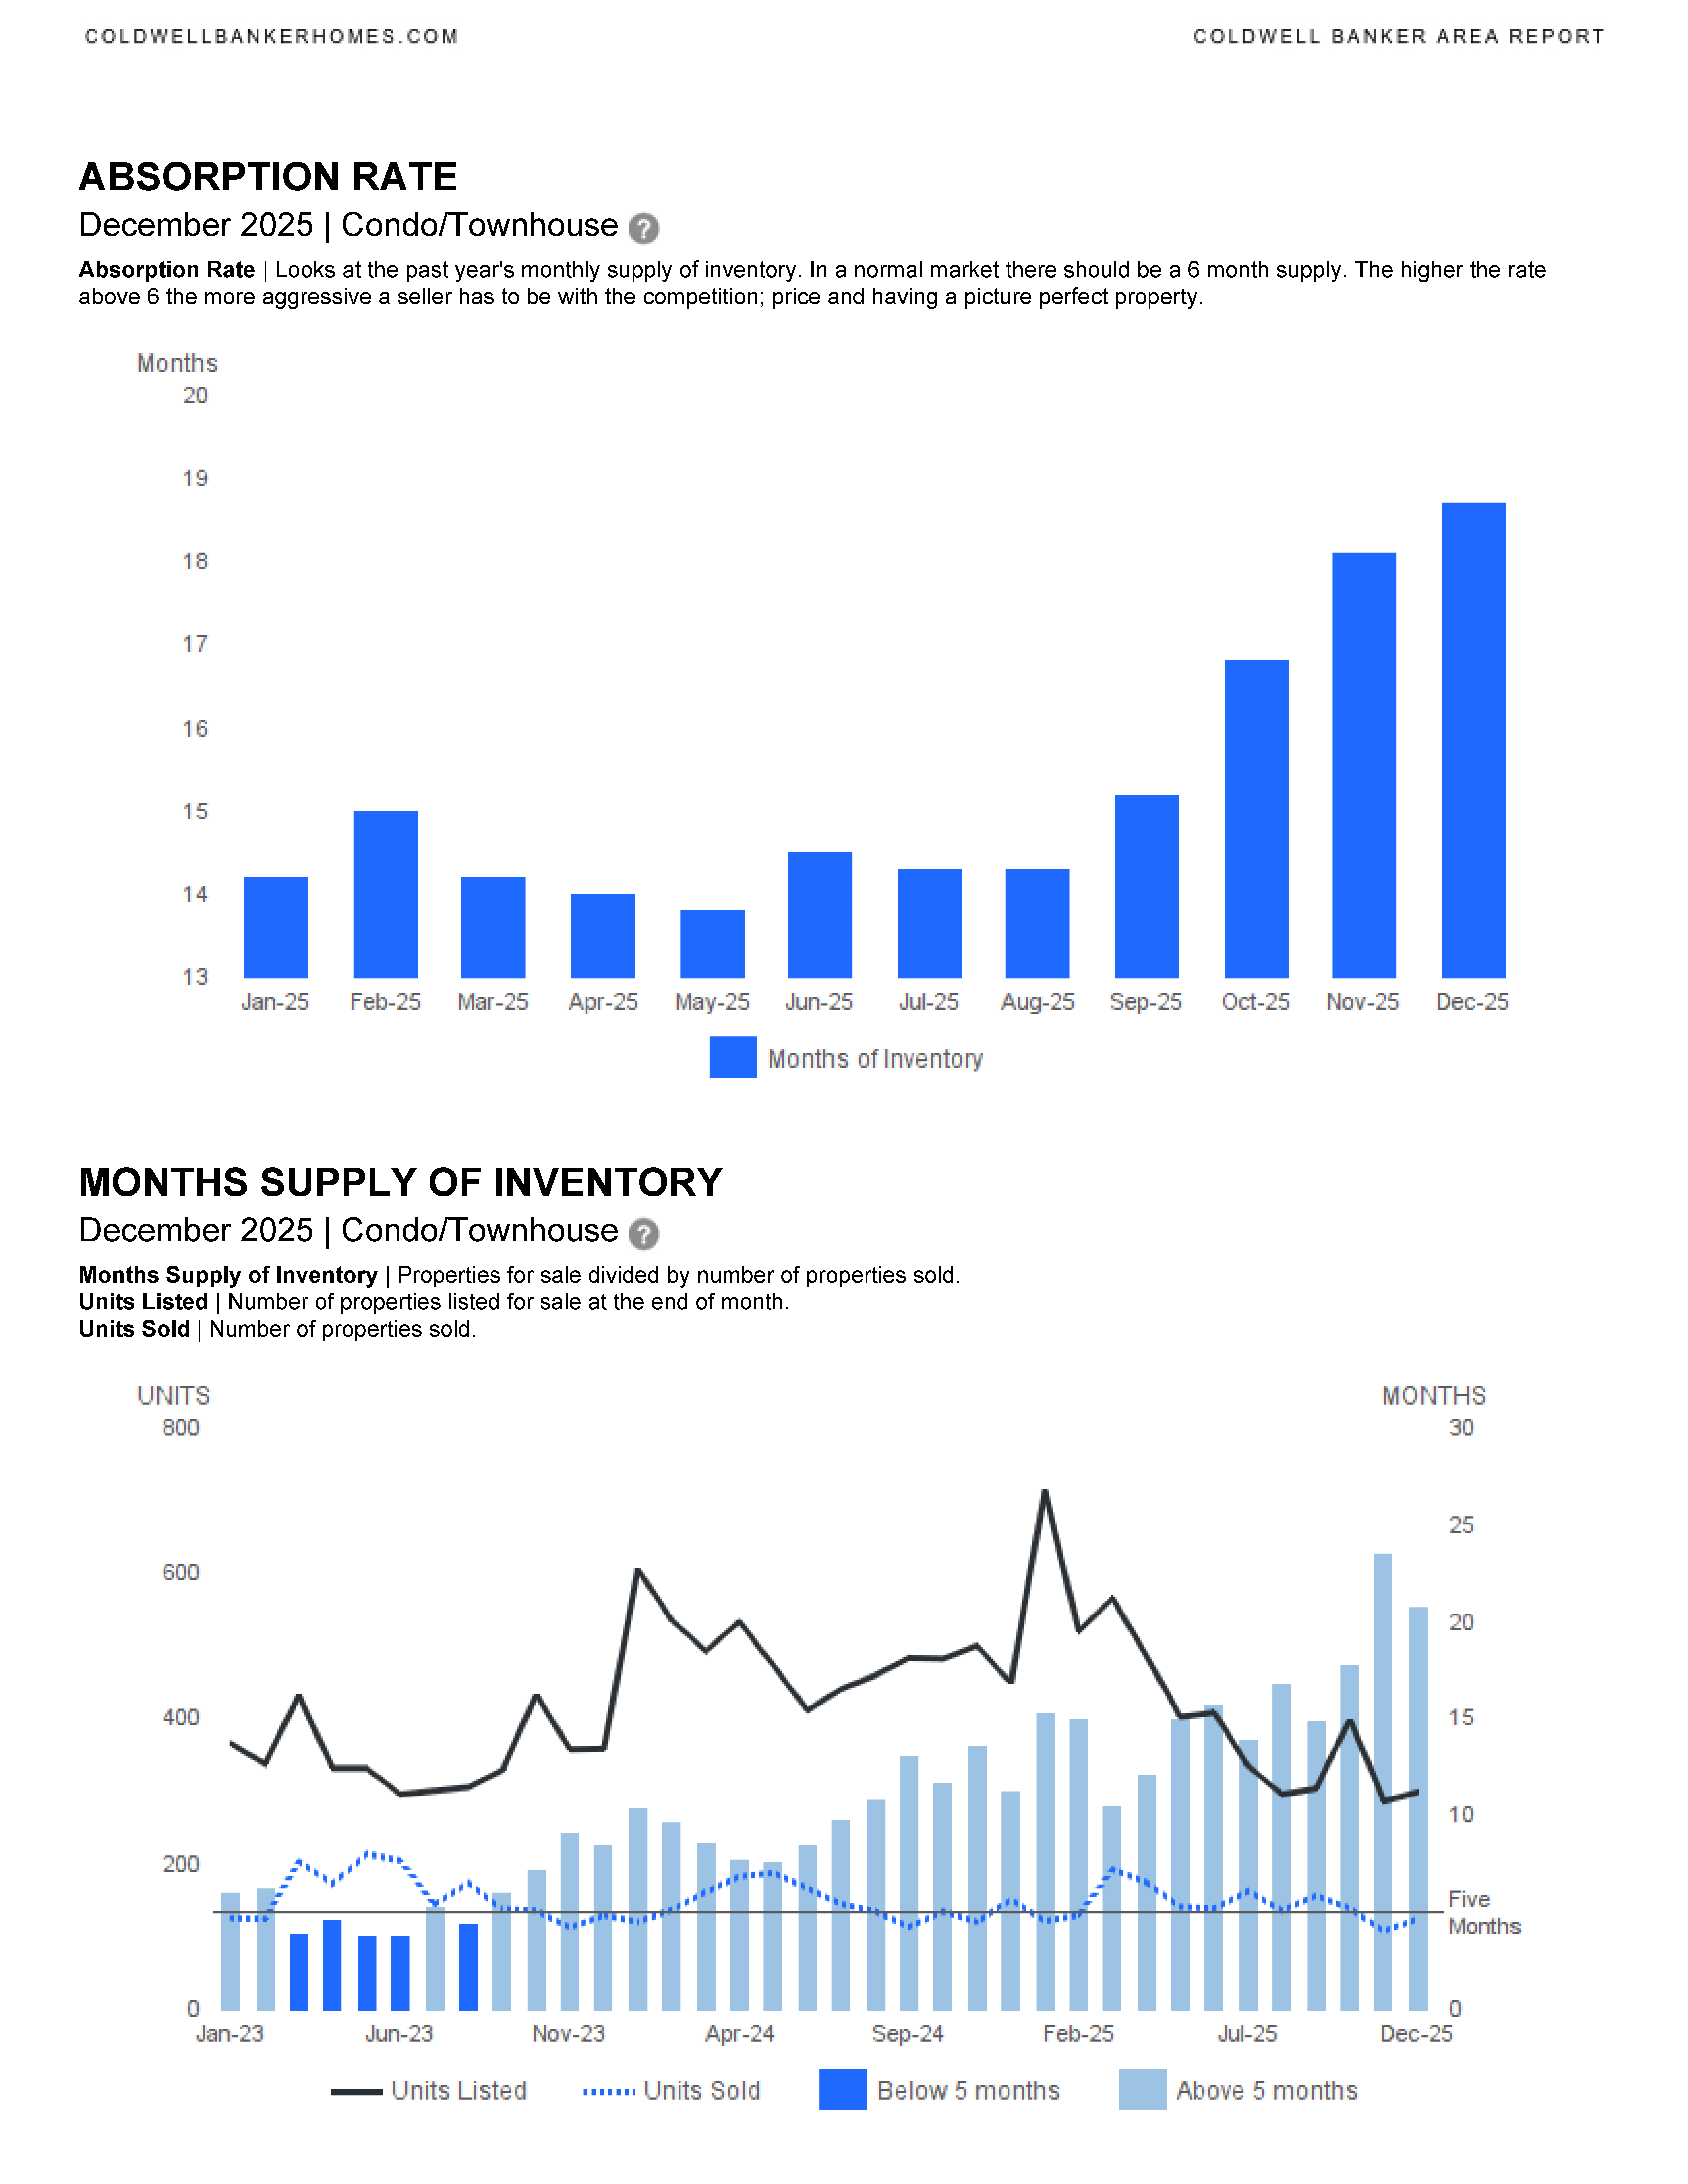
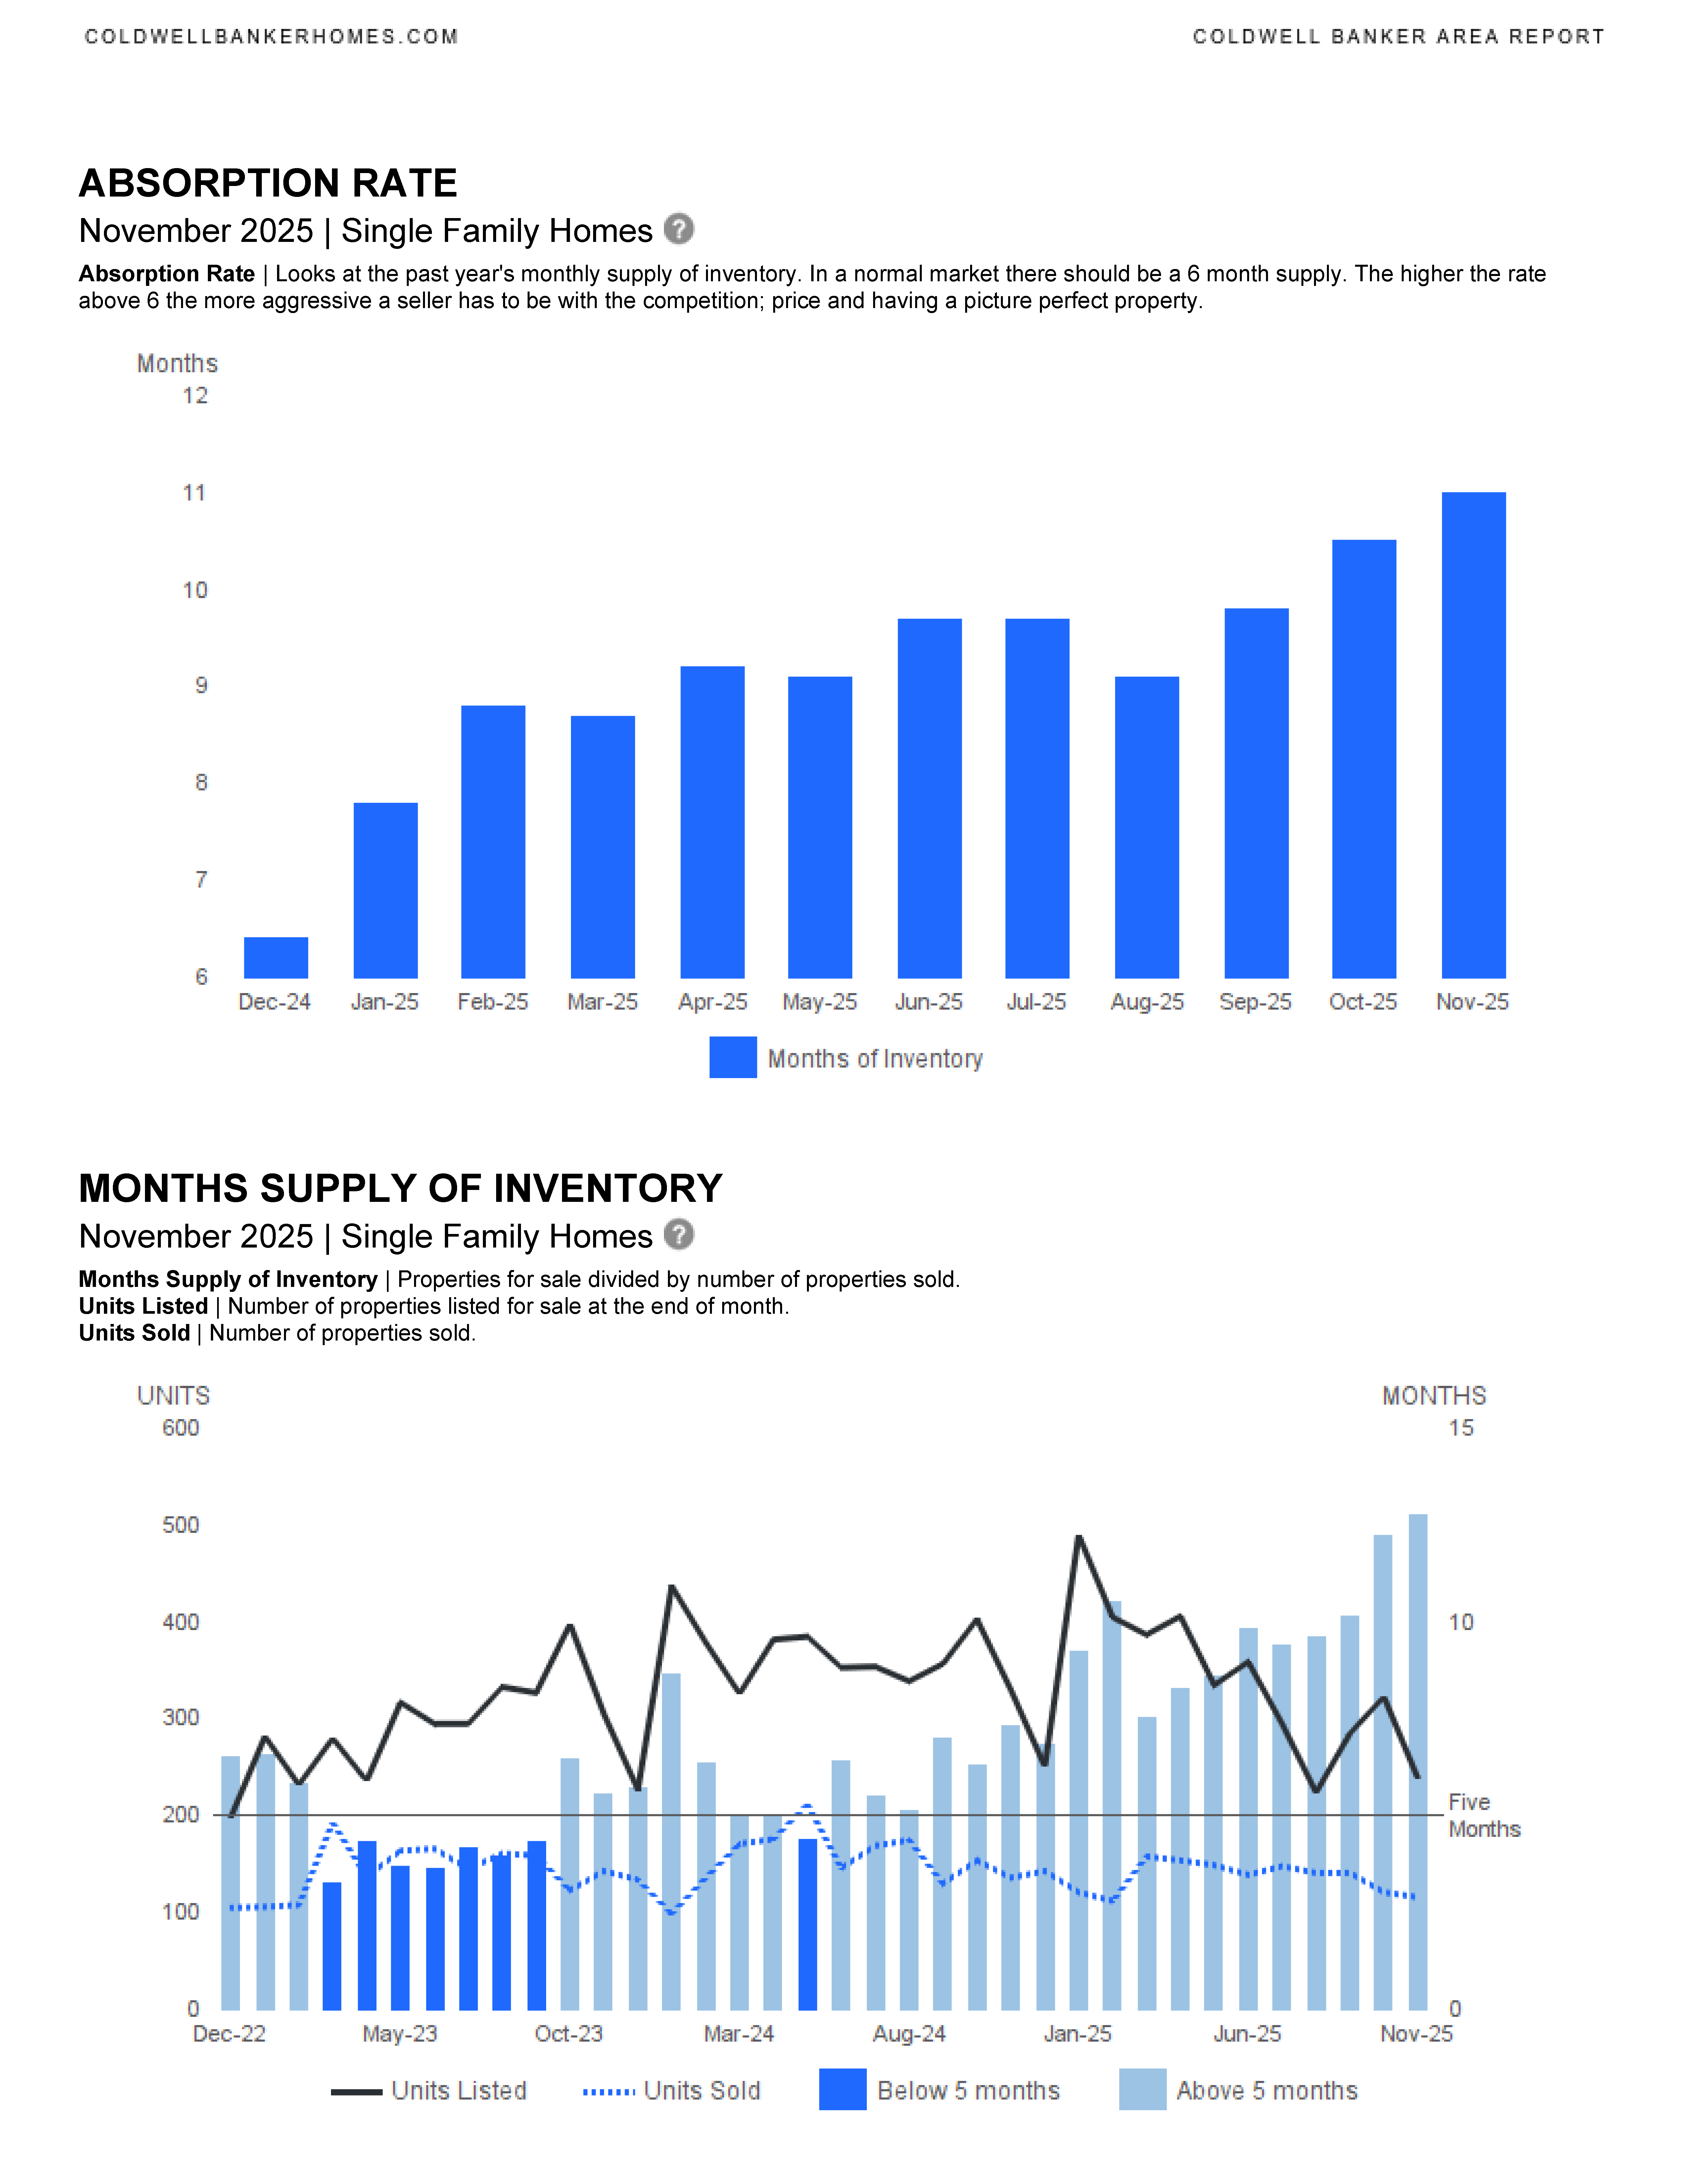
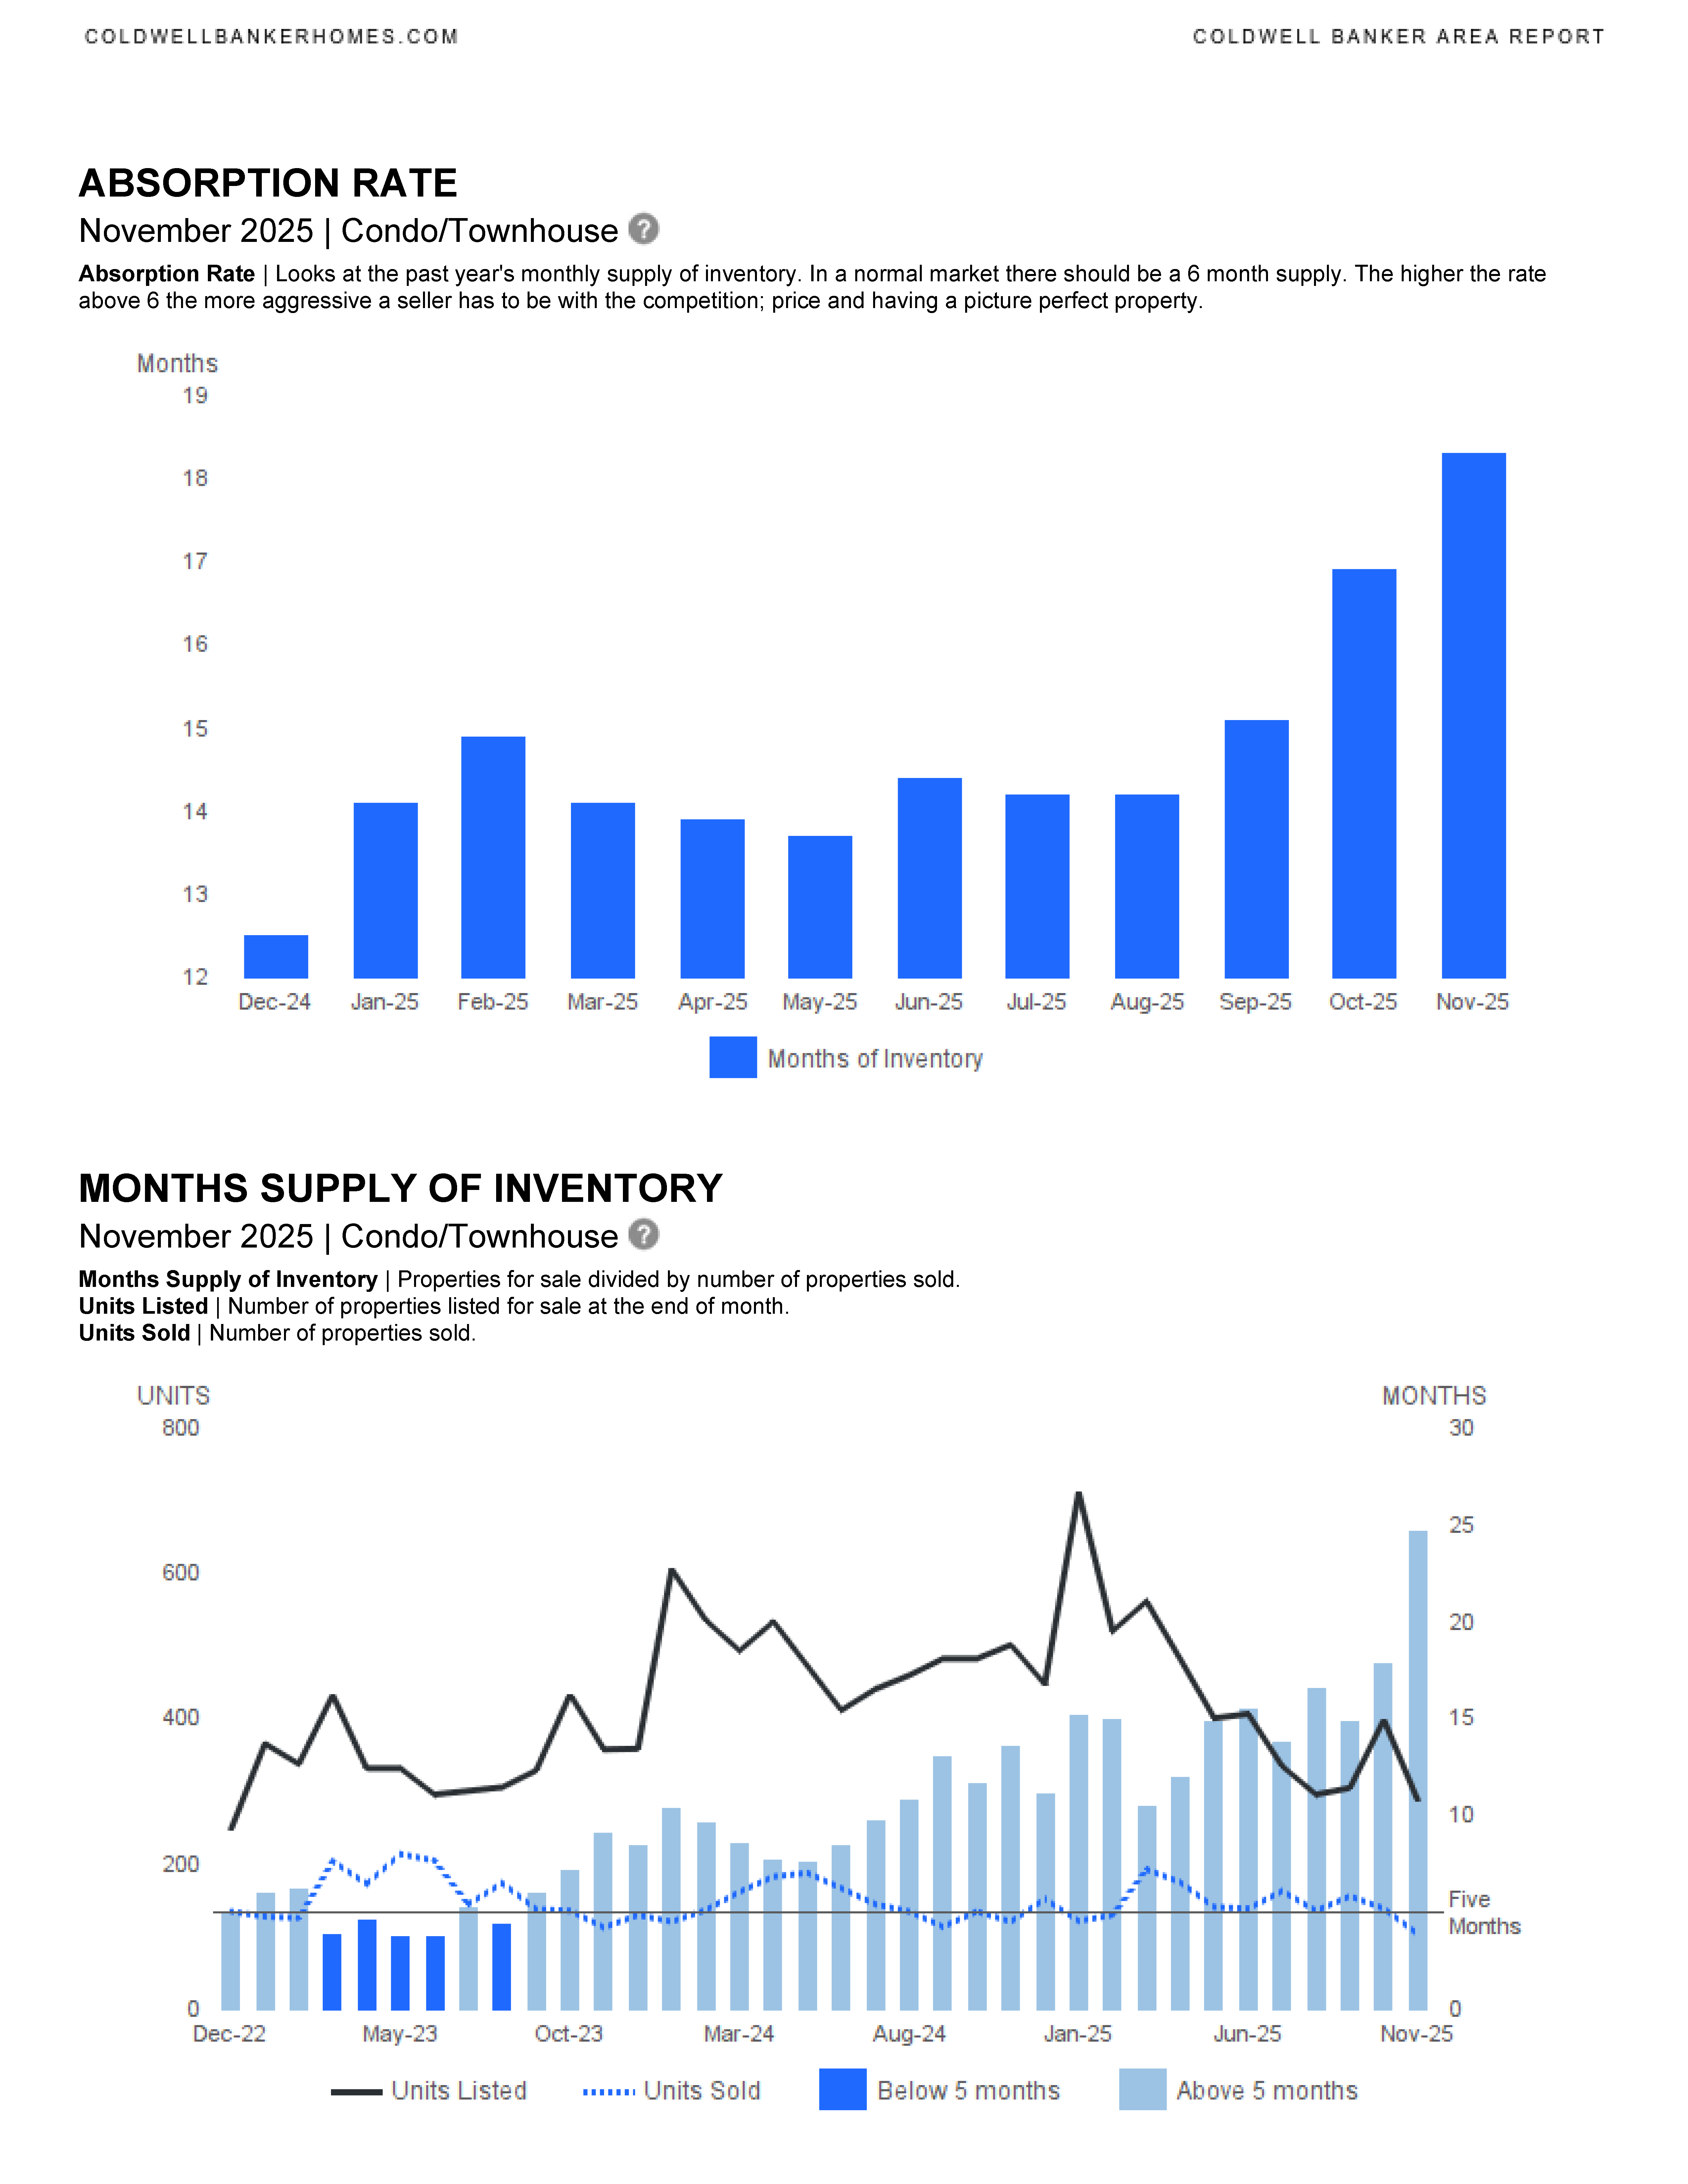
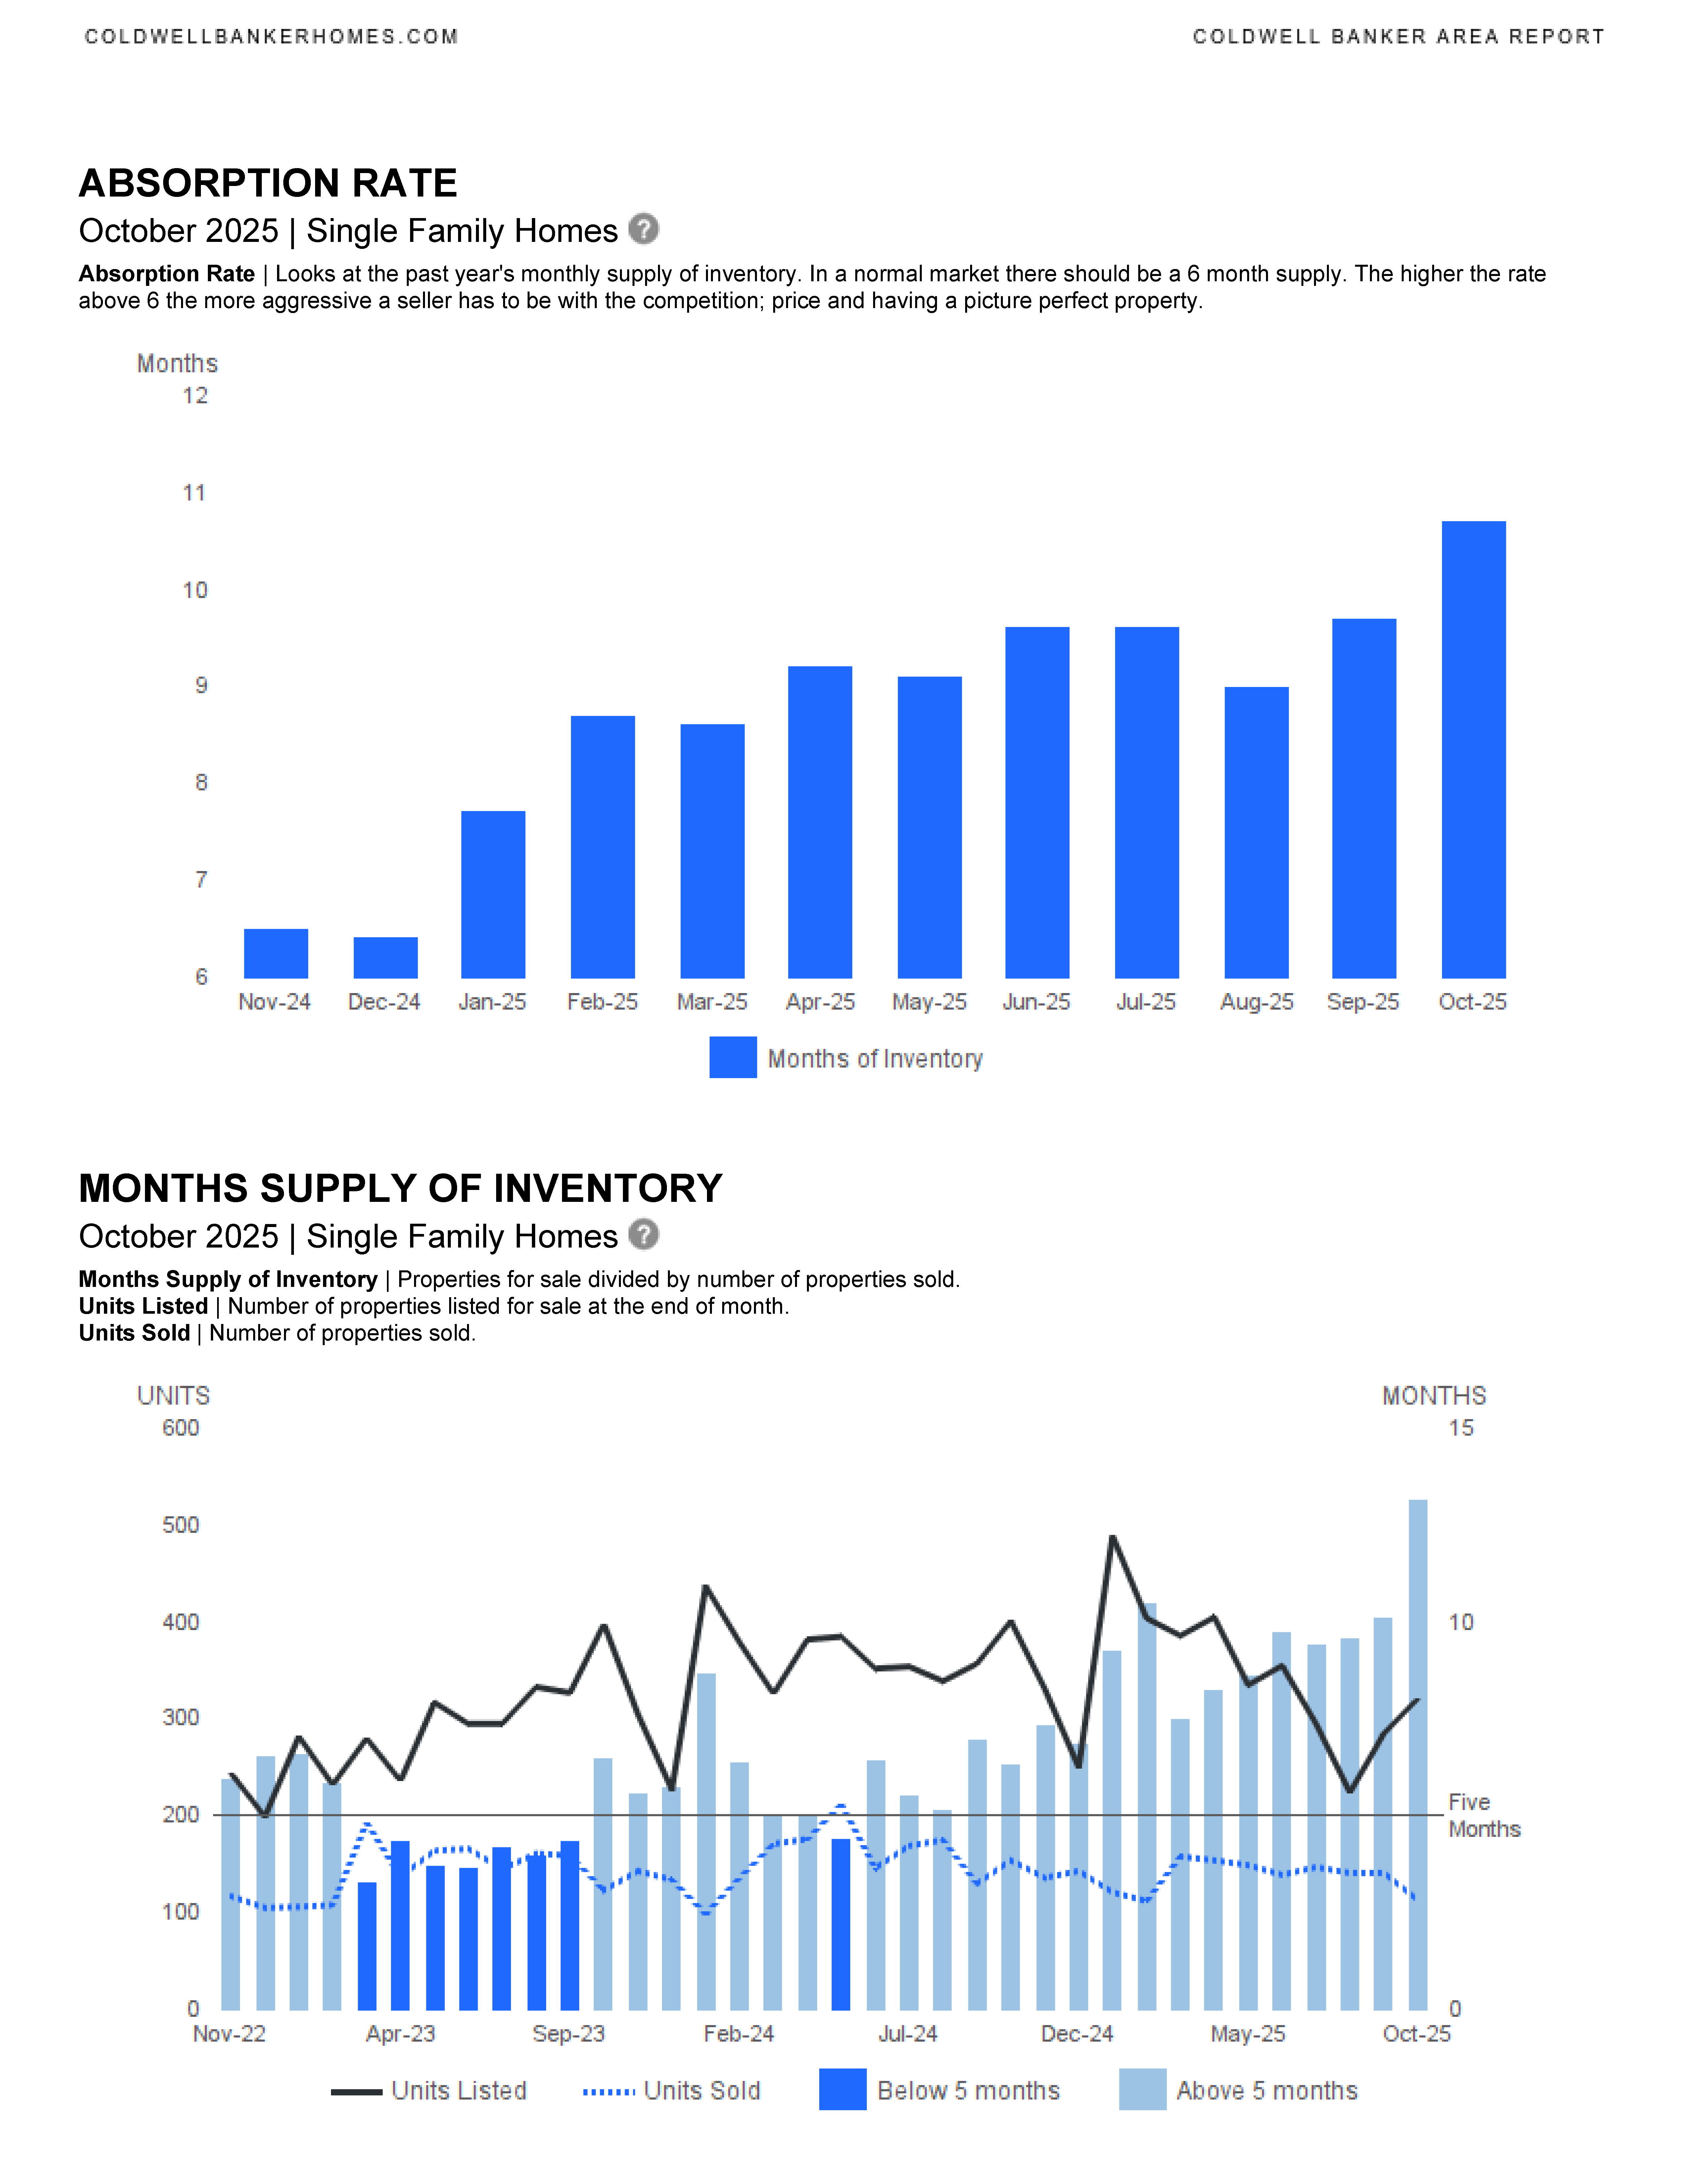
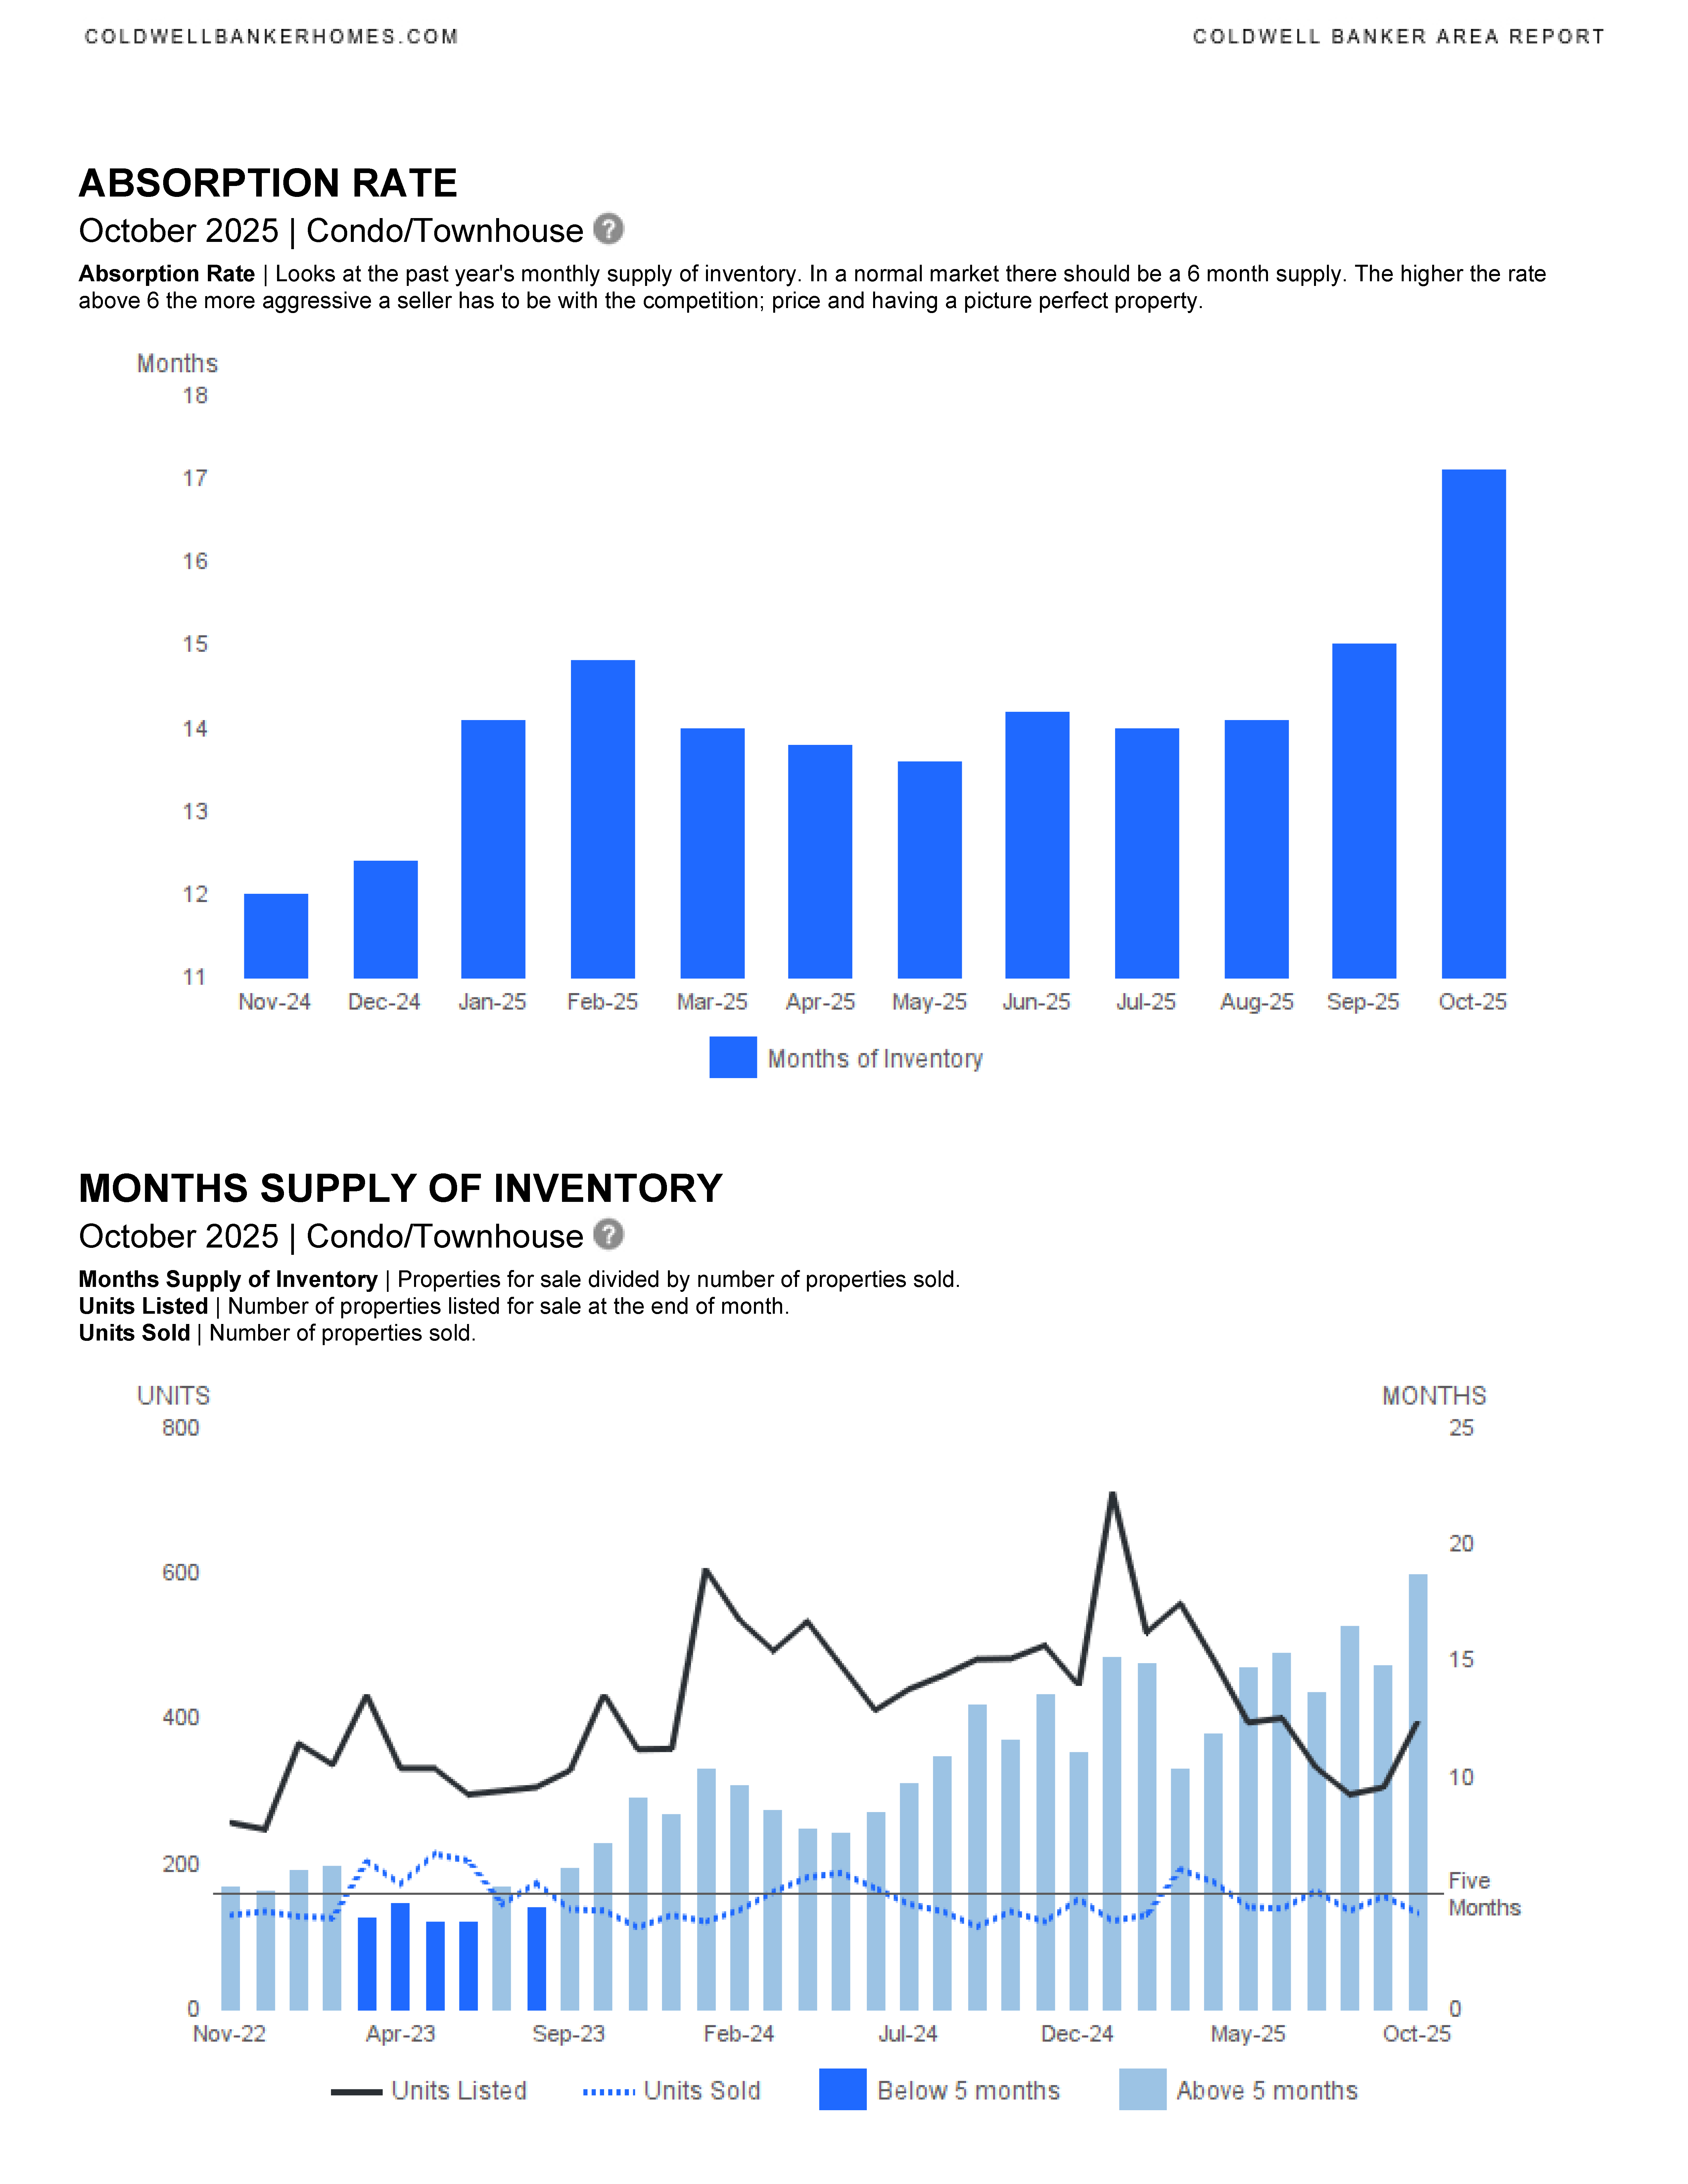
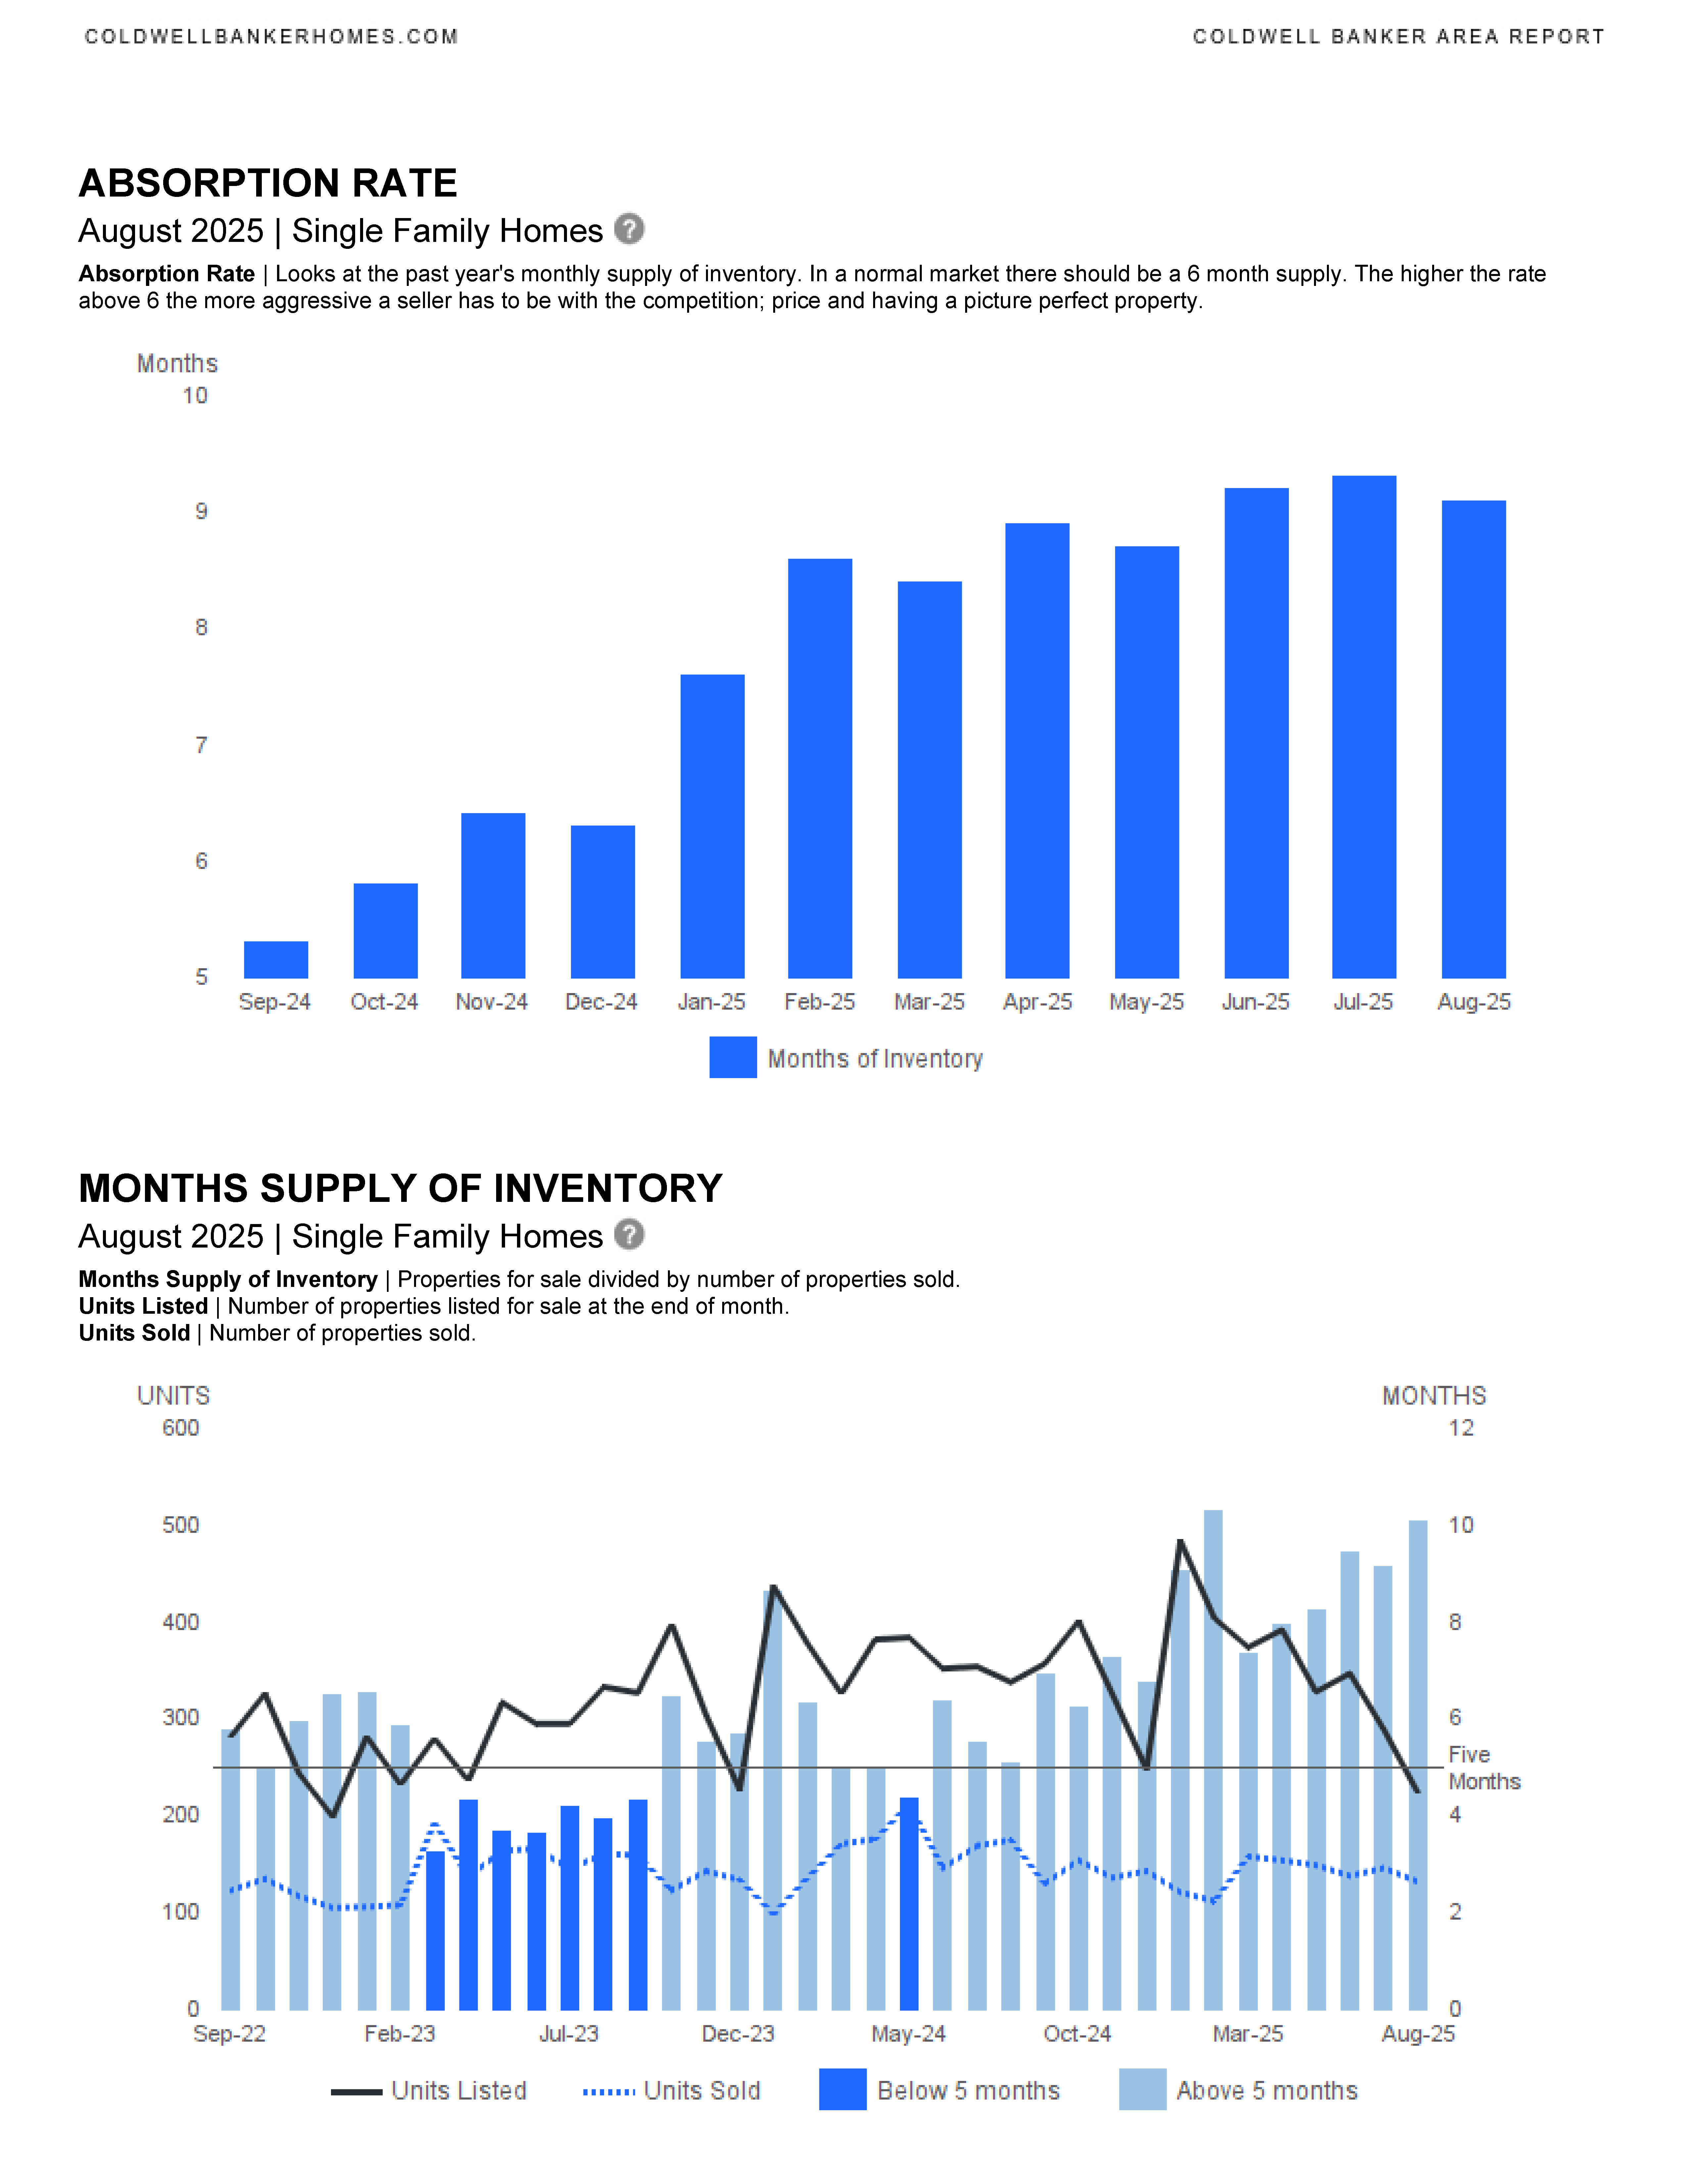
What does “Absorption Rate” mean?
Absorption Rate | Looks at the past year’s monthly supply of inventory. In a normal market there should be a 6 month supply. The higher the rate above 6 the more aggressive a seller has to be with the competition; price and having a picture perfect property.


In this housing market in SE Florida, you need to work with an experienced and knowledgeable real estate professional. Please contact me if you would like to be sent updated market reports for YOUR specific neighborhood, Fort Lauderdale, or another SE Florida city. We can discuss the market, current trends and how we can work together to accomplish your real estate goals. I am here to help.
CONTACT ANNETTE
Let’s start working together!
Annette Dammeyer, REALTOR®, ABR®, AHWD®
Coldwell Banker Realty
901 E Las Olas Blvd STE 101, Fort Lauderdale, FL 33301
808.747.3686
SL 3535792
Fort Lauderdale January 2026 Area Report
Fort Lauderdale January 2026 real estate statistics have been published.
Fort Lauderdale Area Reports
Single Family Homes
Condominium & Townhouses
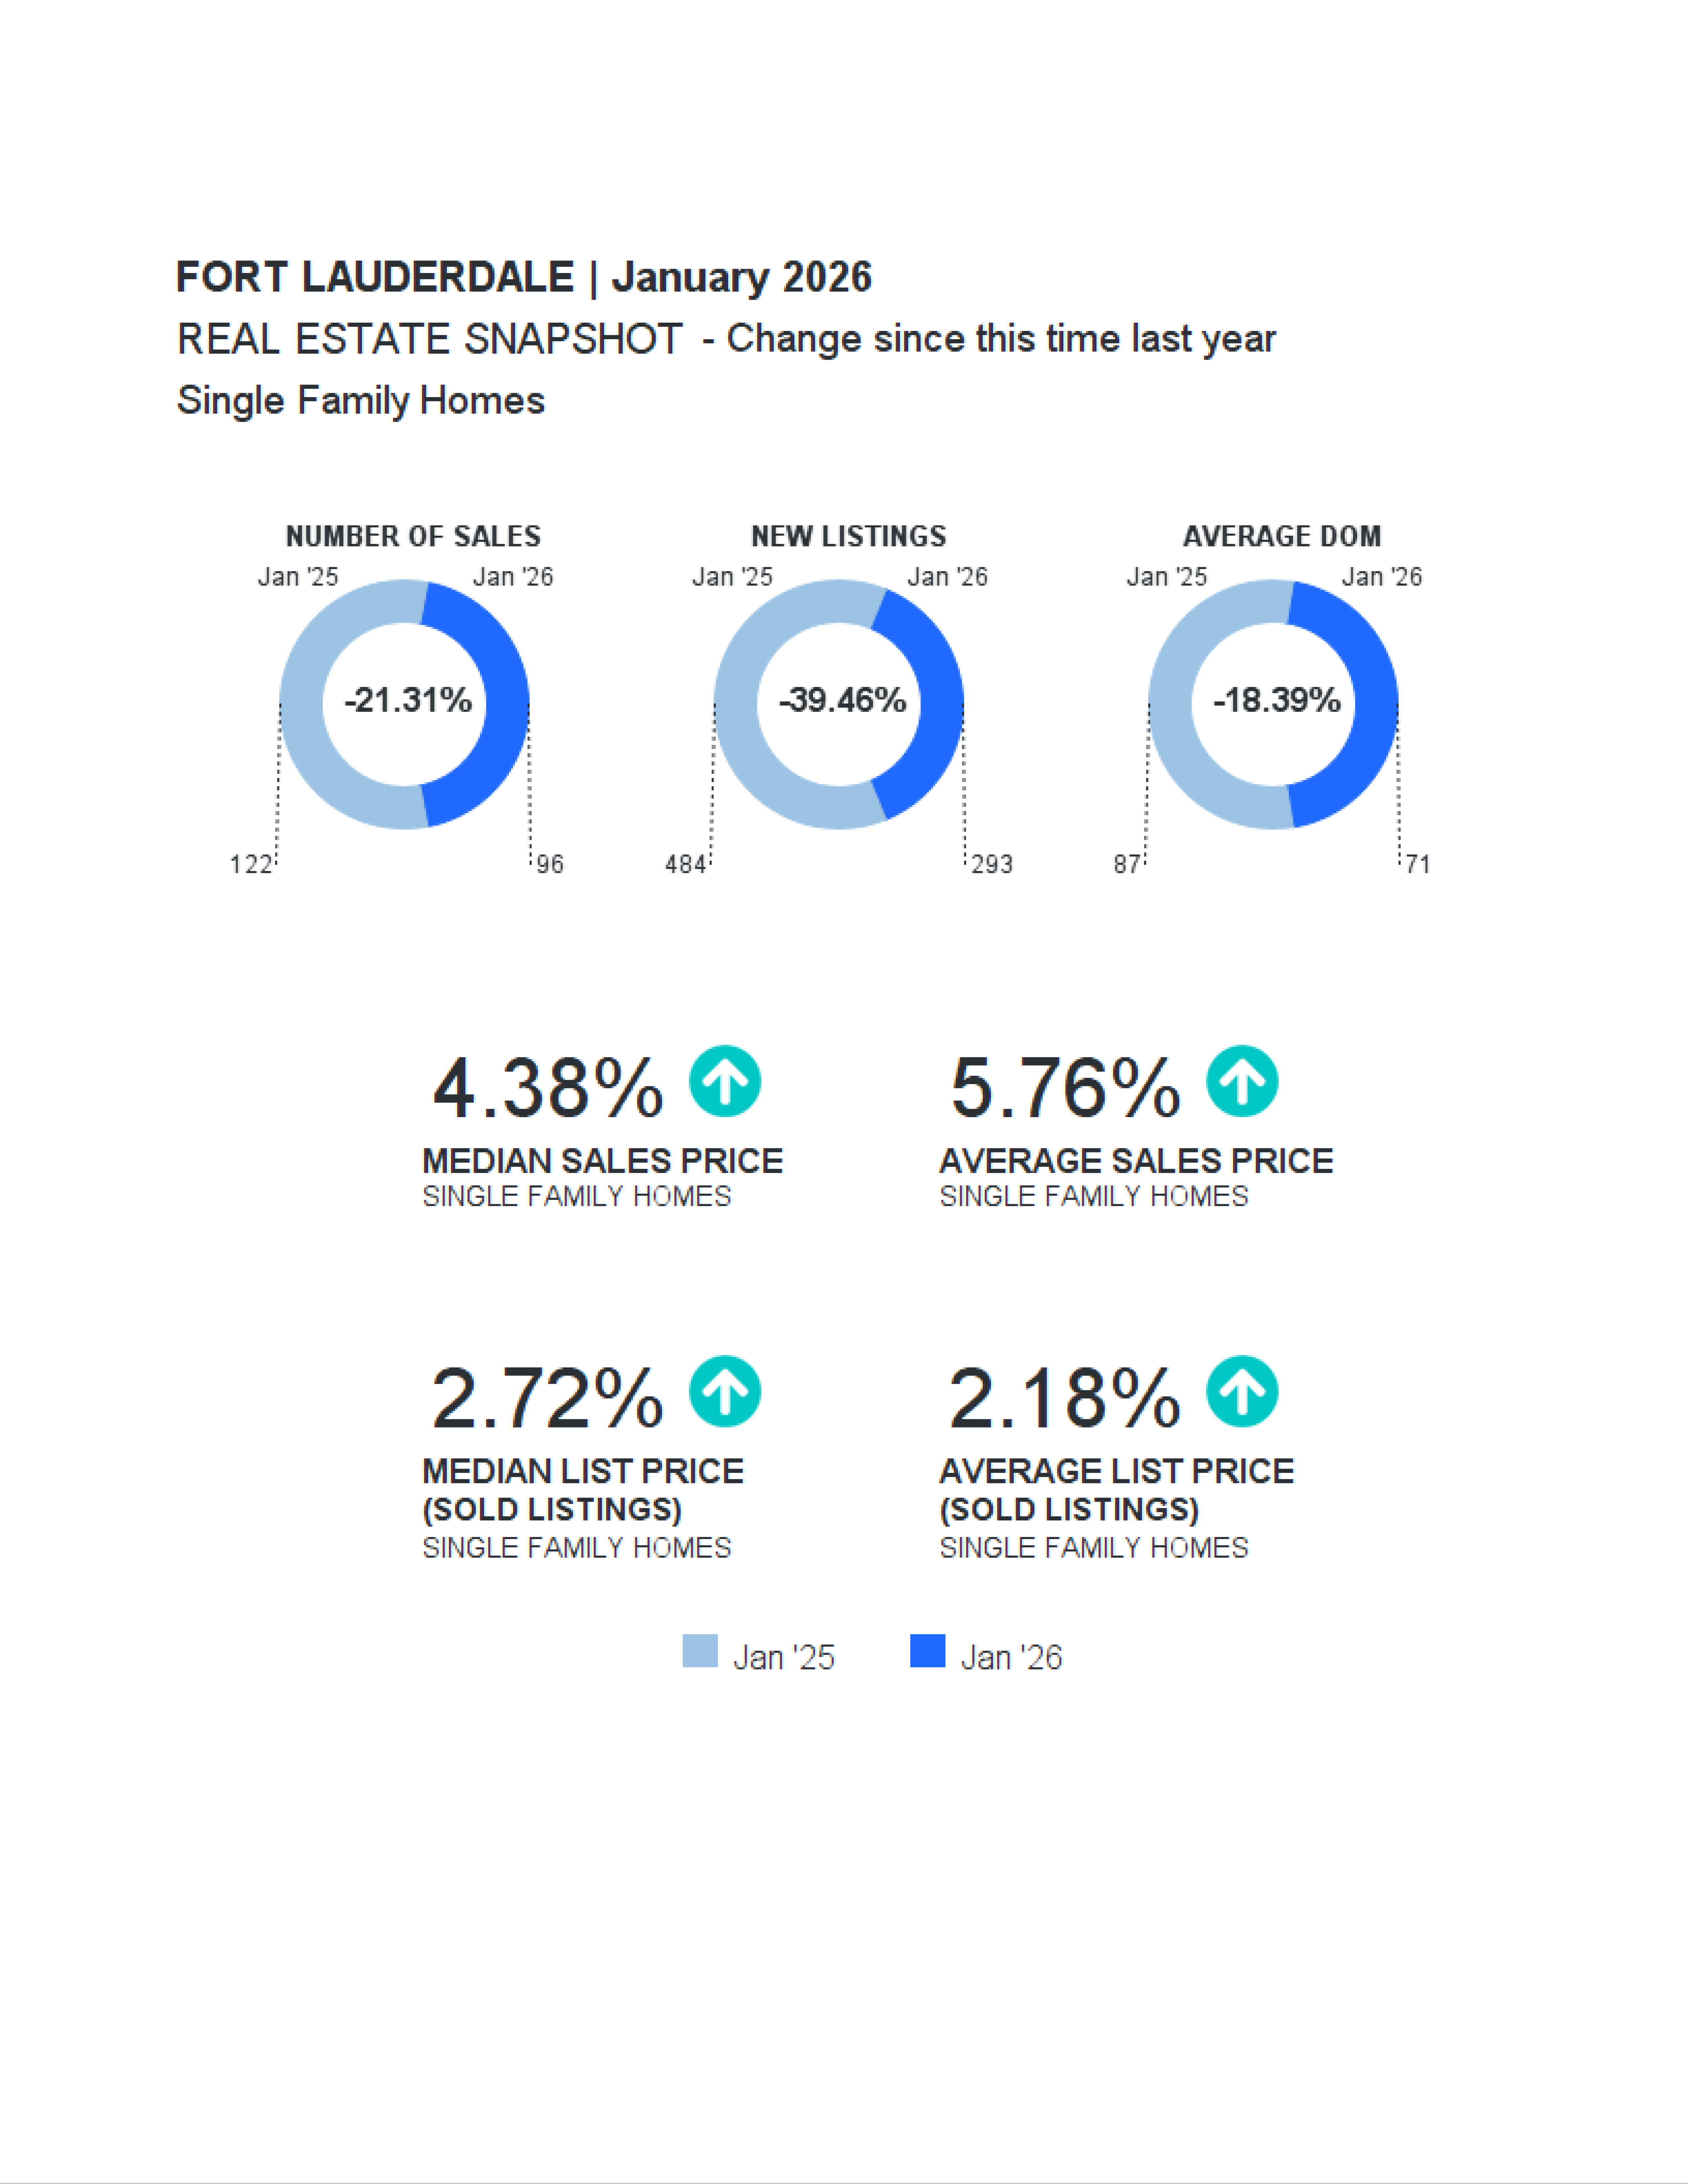
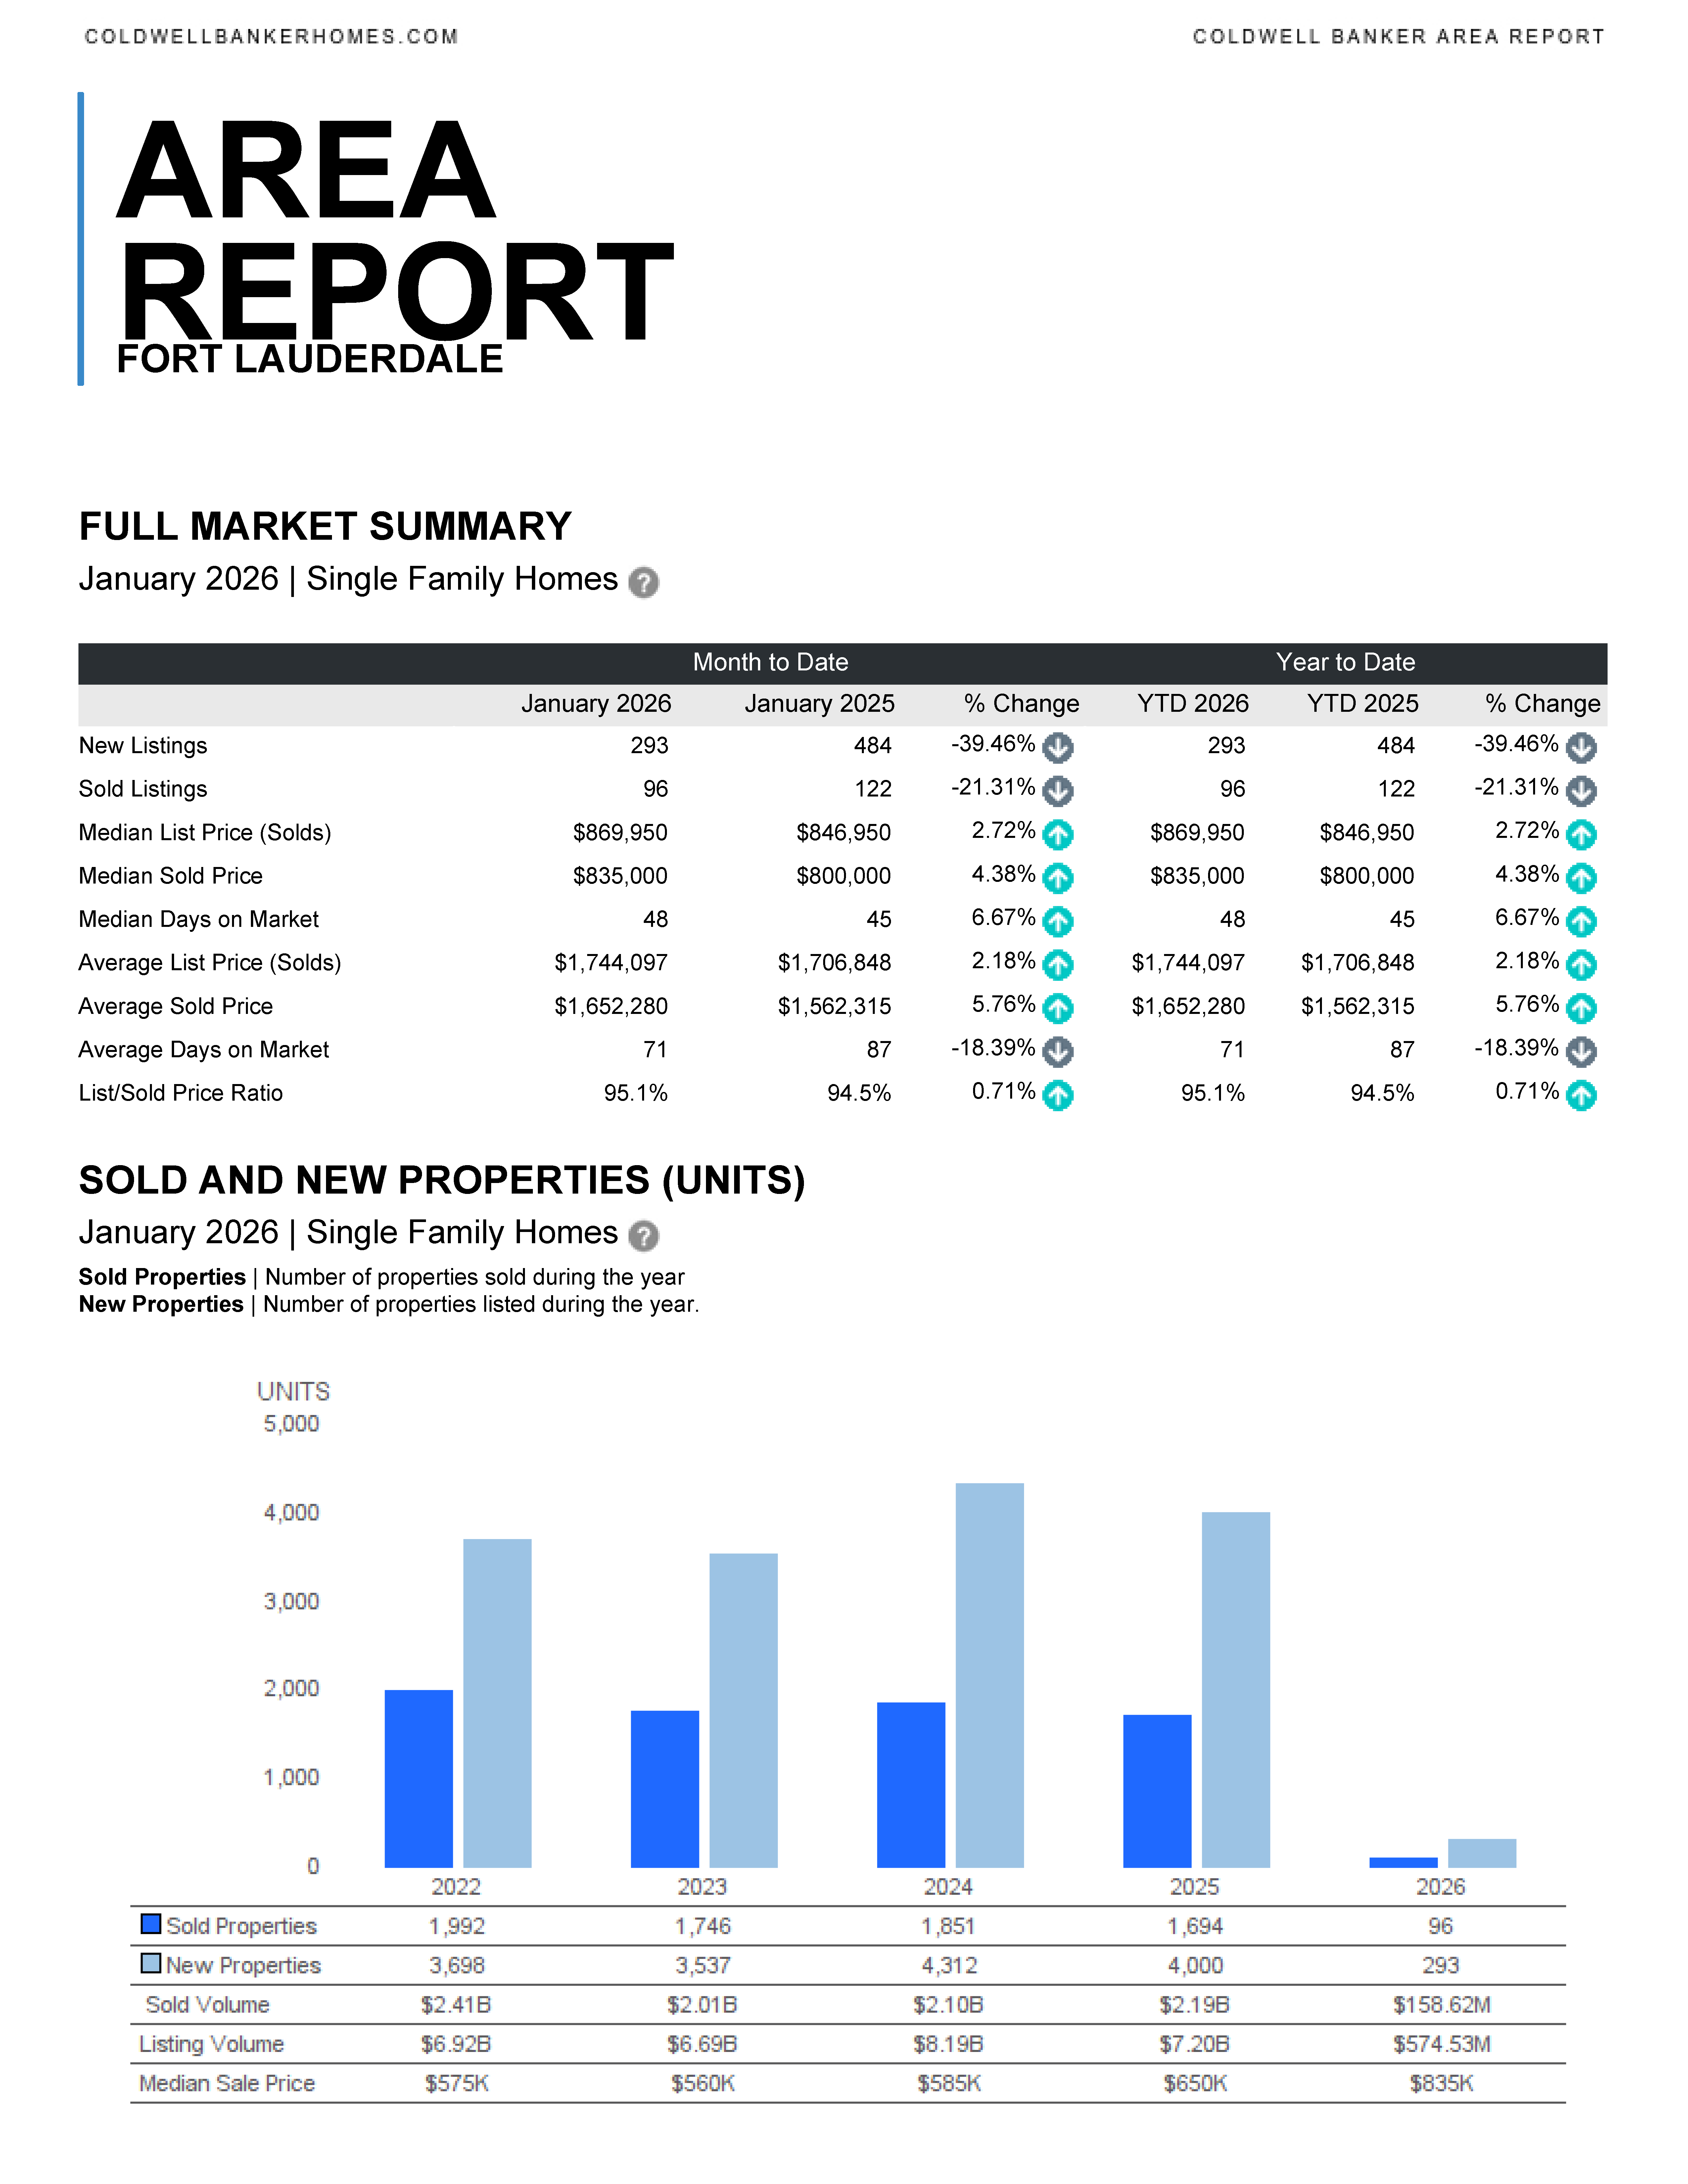
📊 Fort Lauderdale Market Snapshot — January 2026 Highlights
🏡 Single‑Family Homes
- Inventory is down sharply: New listings fell ~39% year over year, keeping supply tight.
- Prices continue to rise:
- Median sold price increased to $835,000 (+4.4% YoY).
- Average sold price climbed to $1.65M (+5.8% YoY).
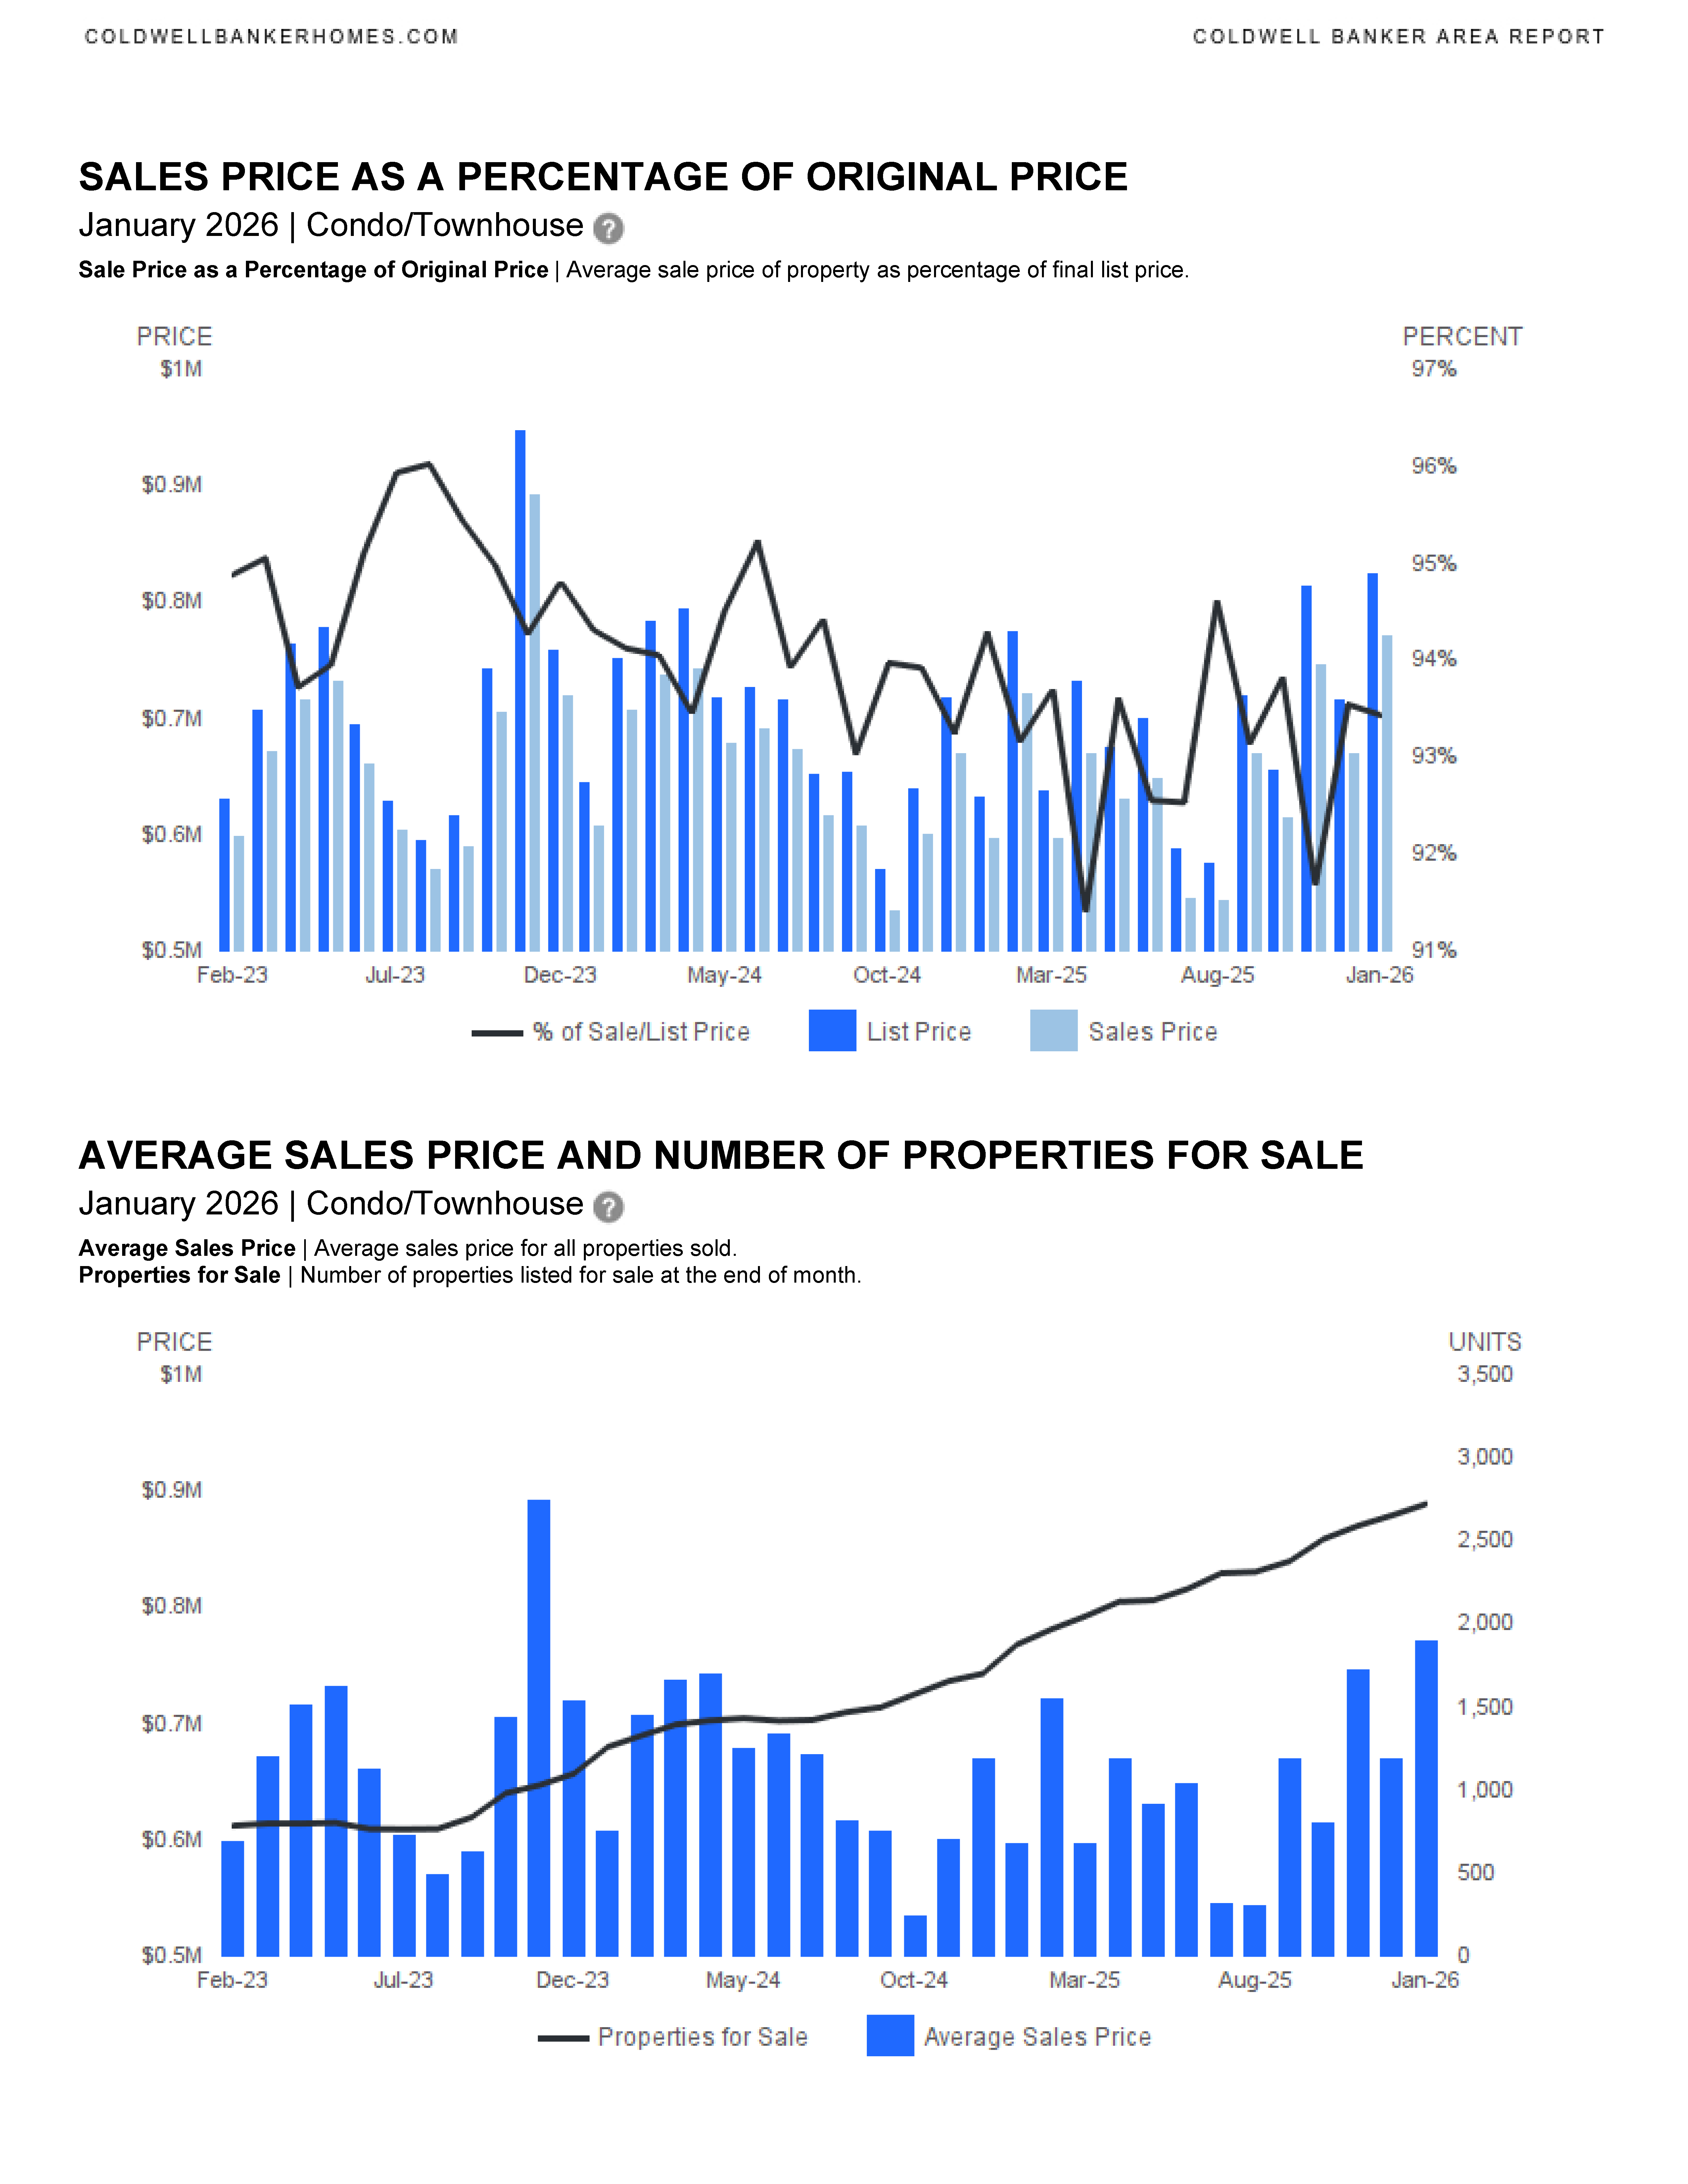
- Homes are selling close to list price: Sellers received about 95% of list price on average.
- Market pace is steady:
- Median days on market: 48 days
- Average days on market improved to 71 days (faster than last year).
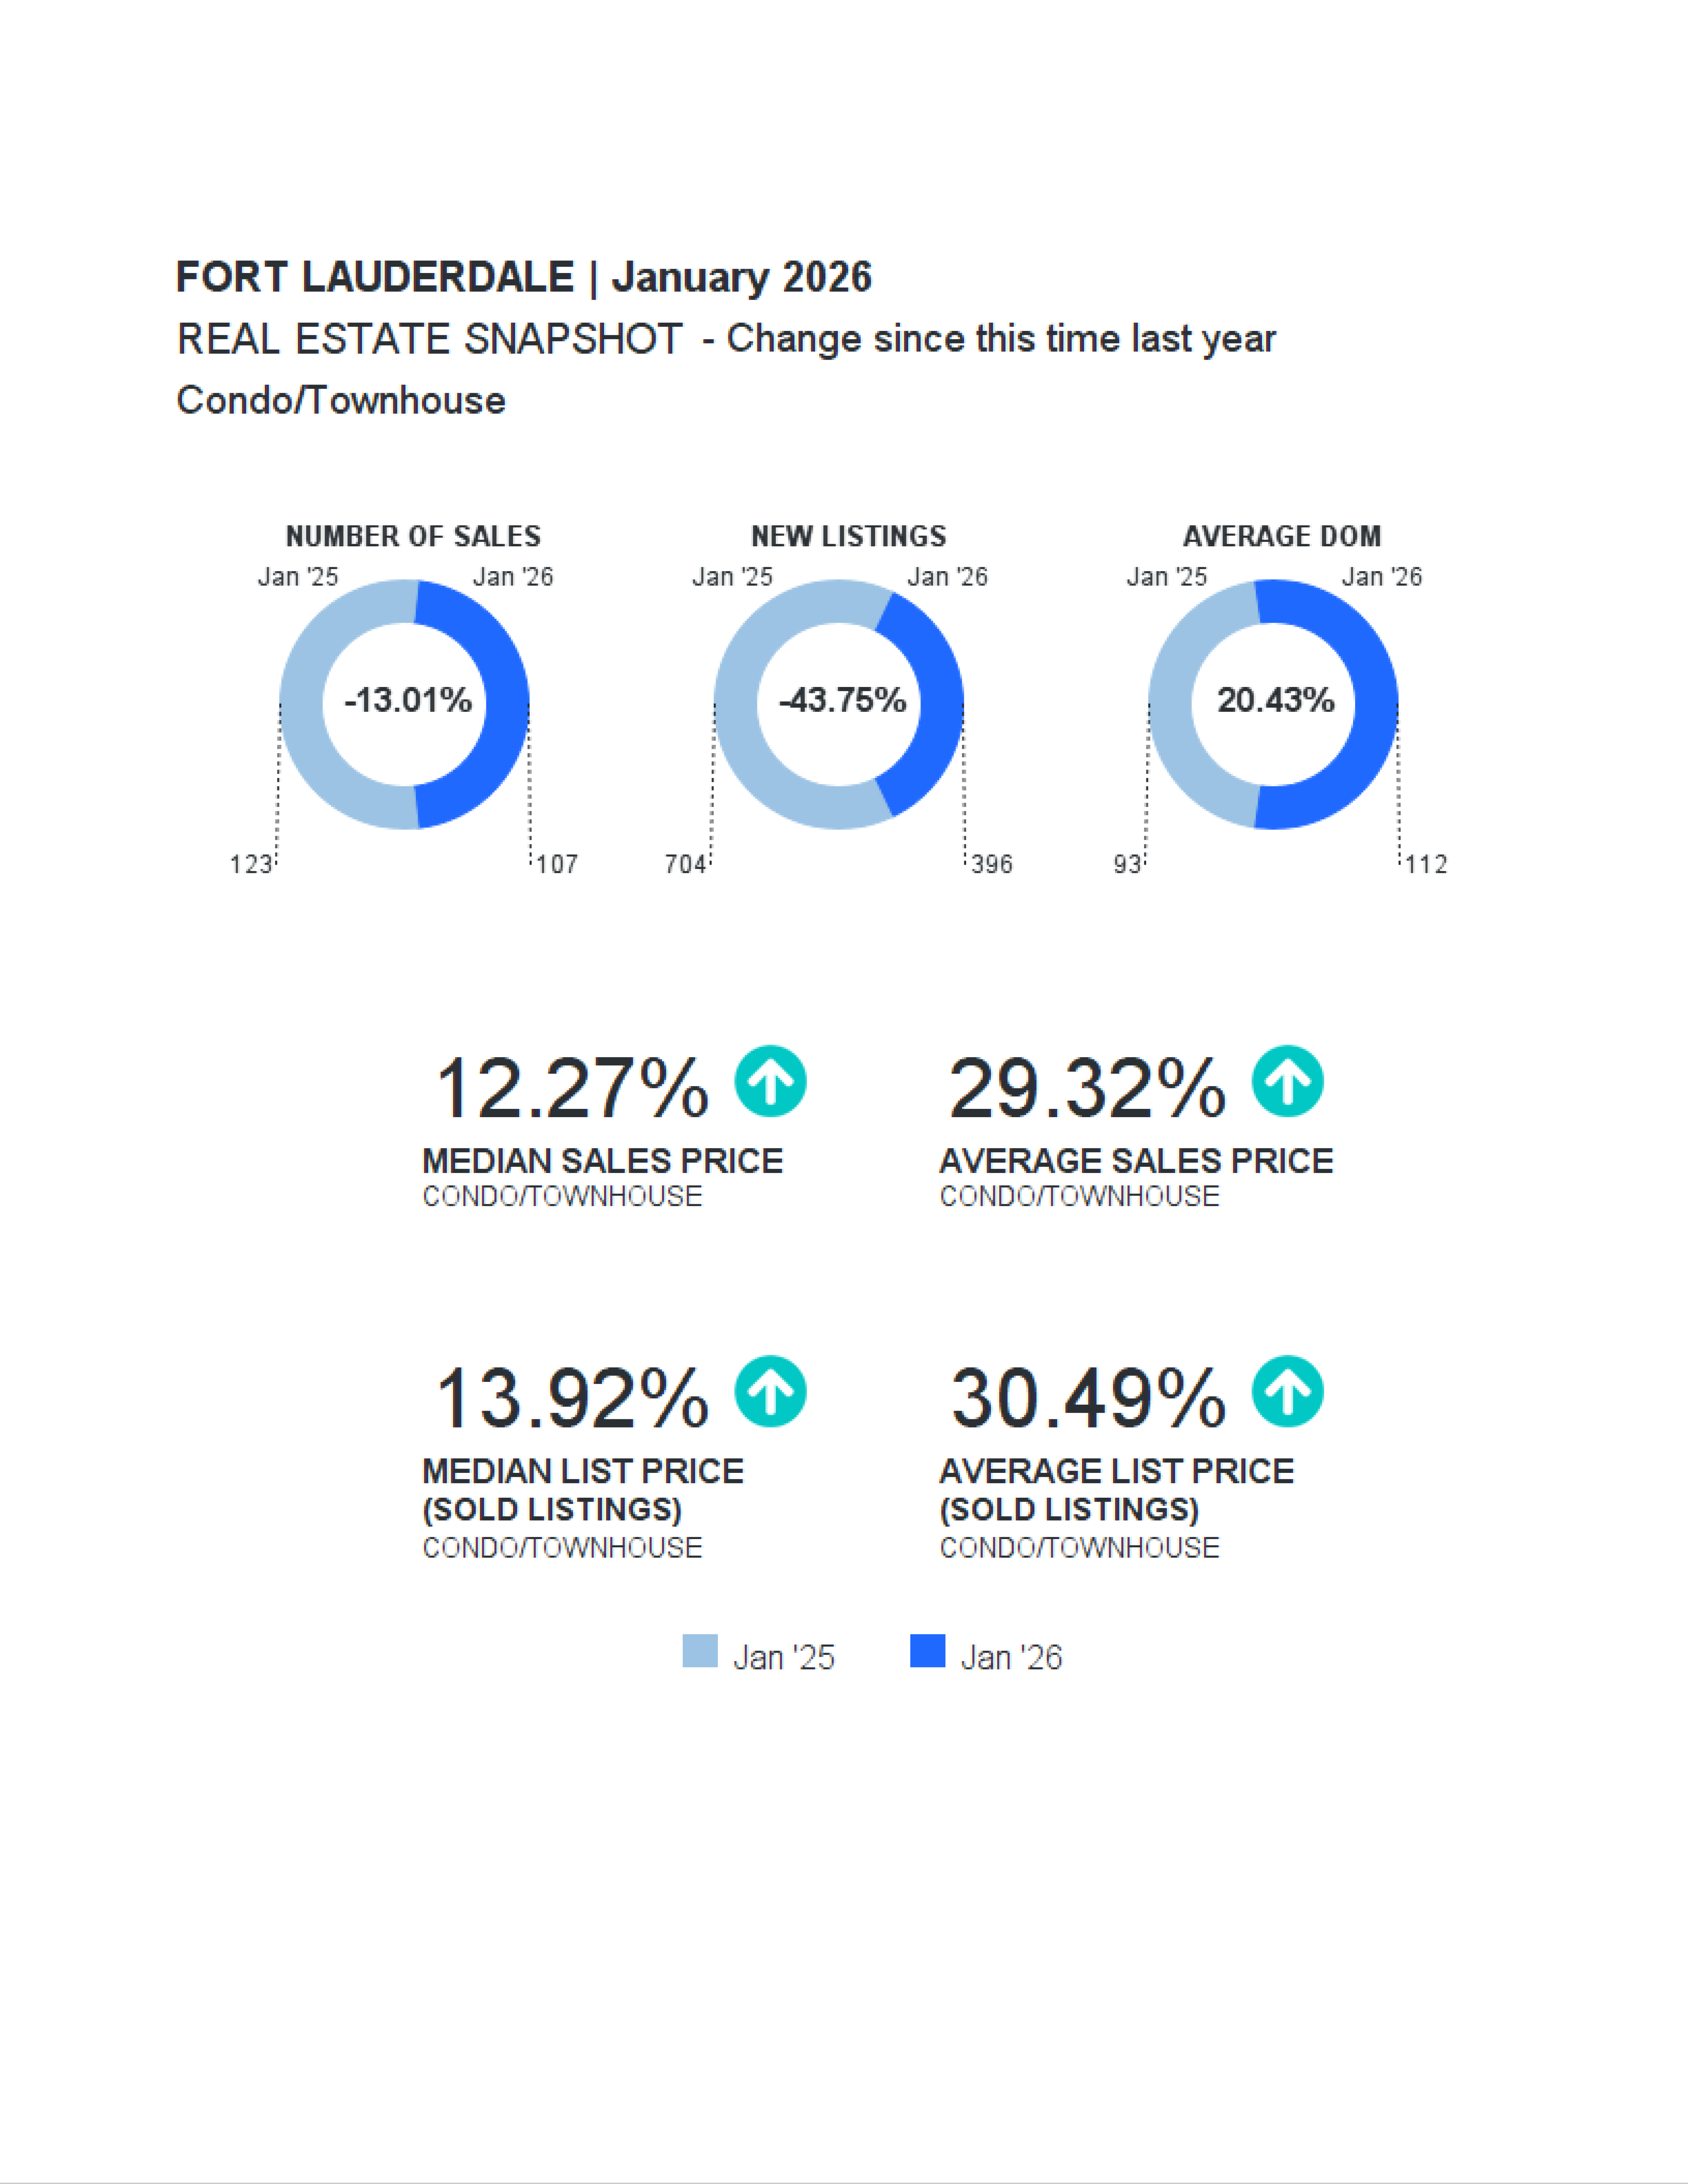
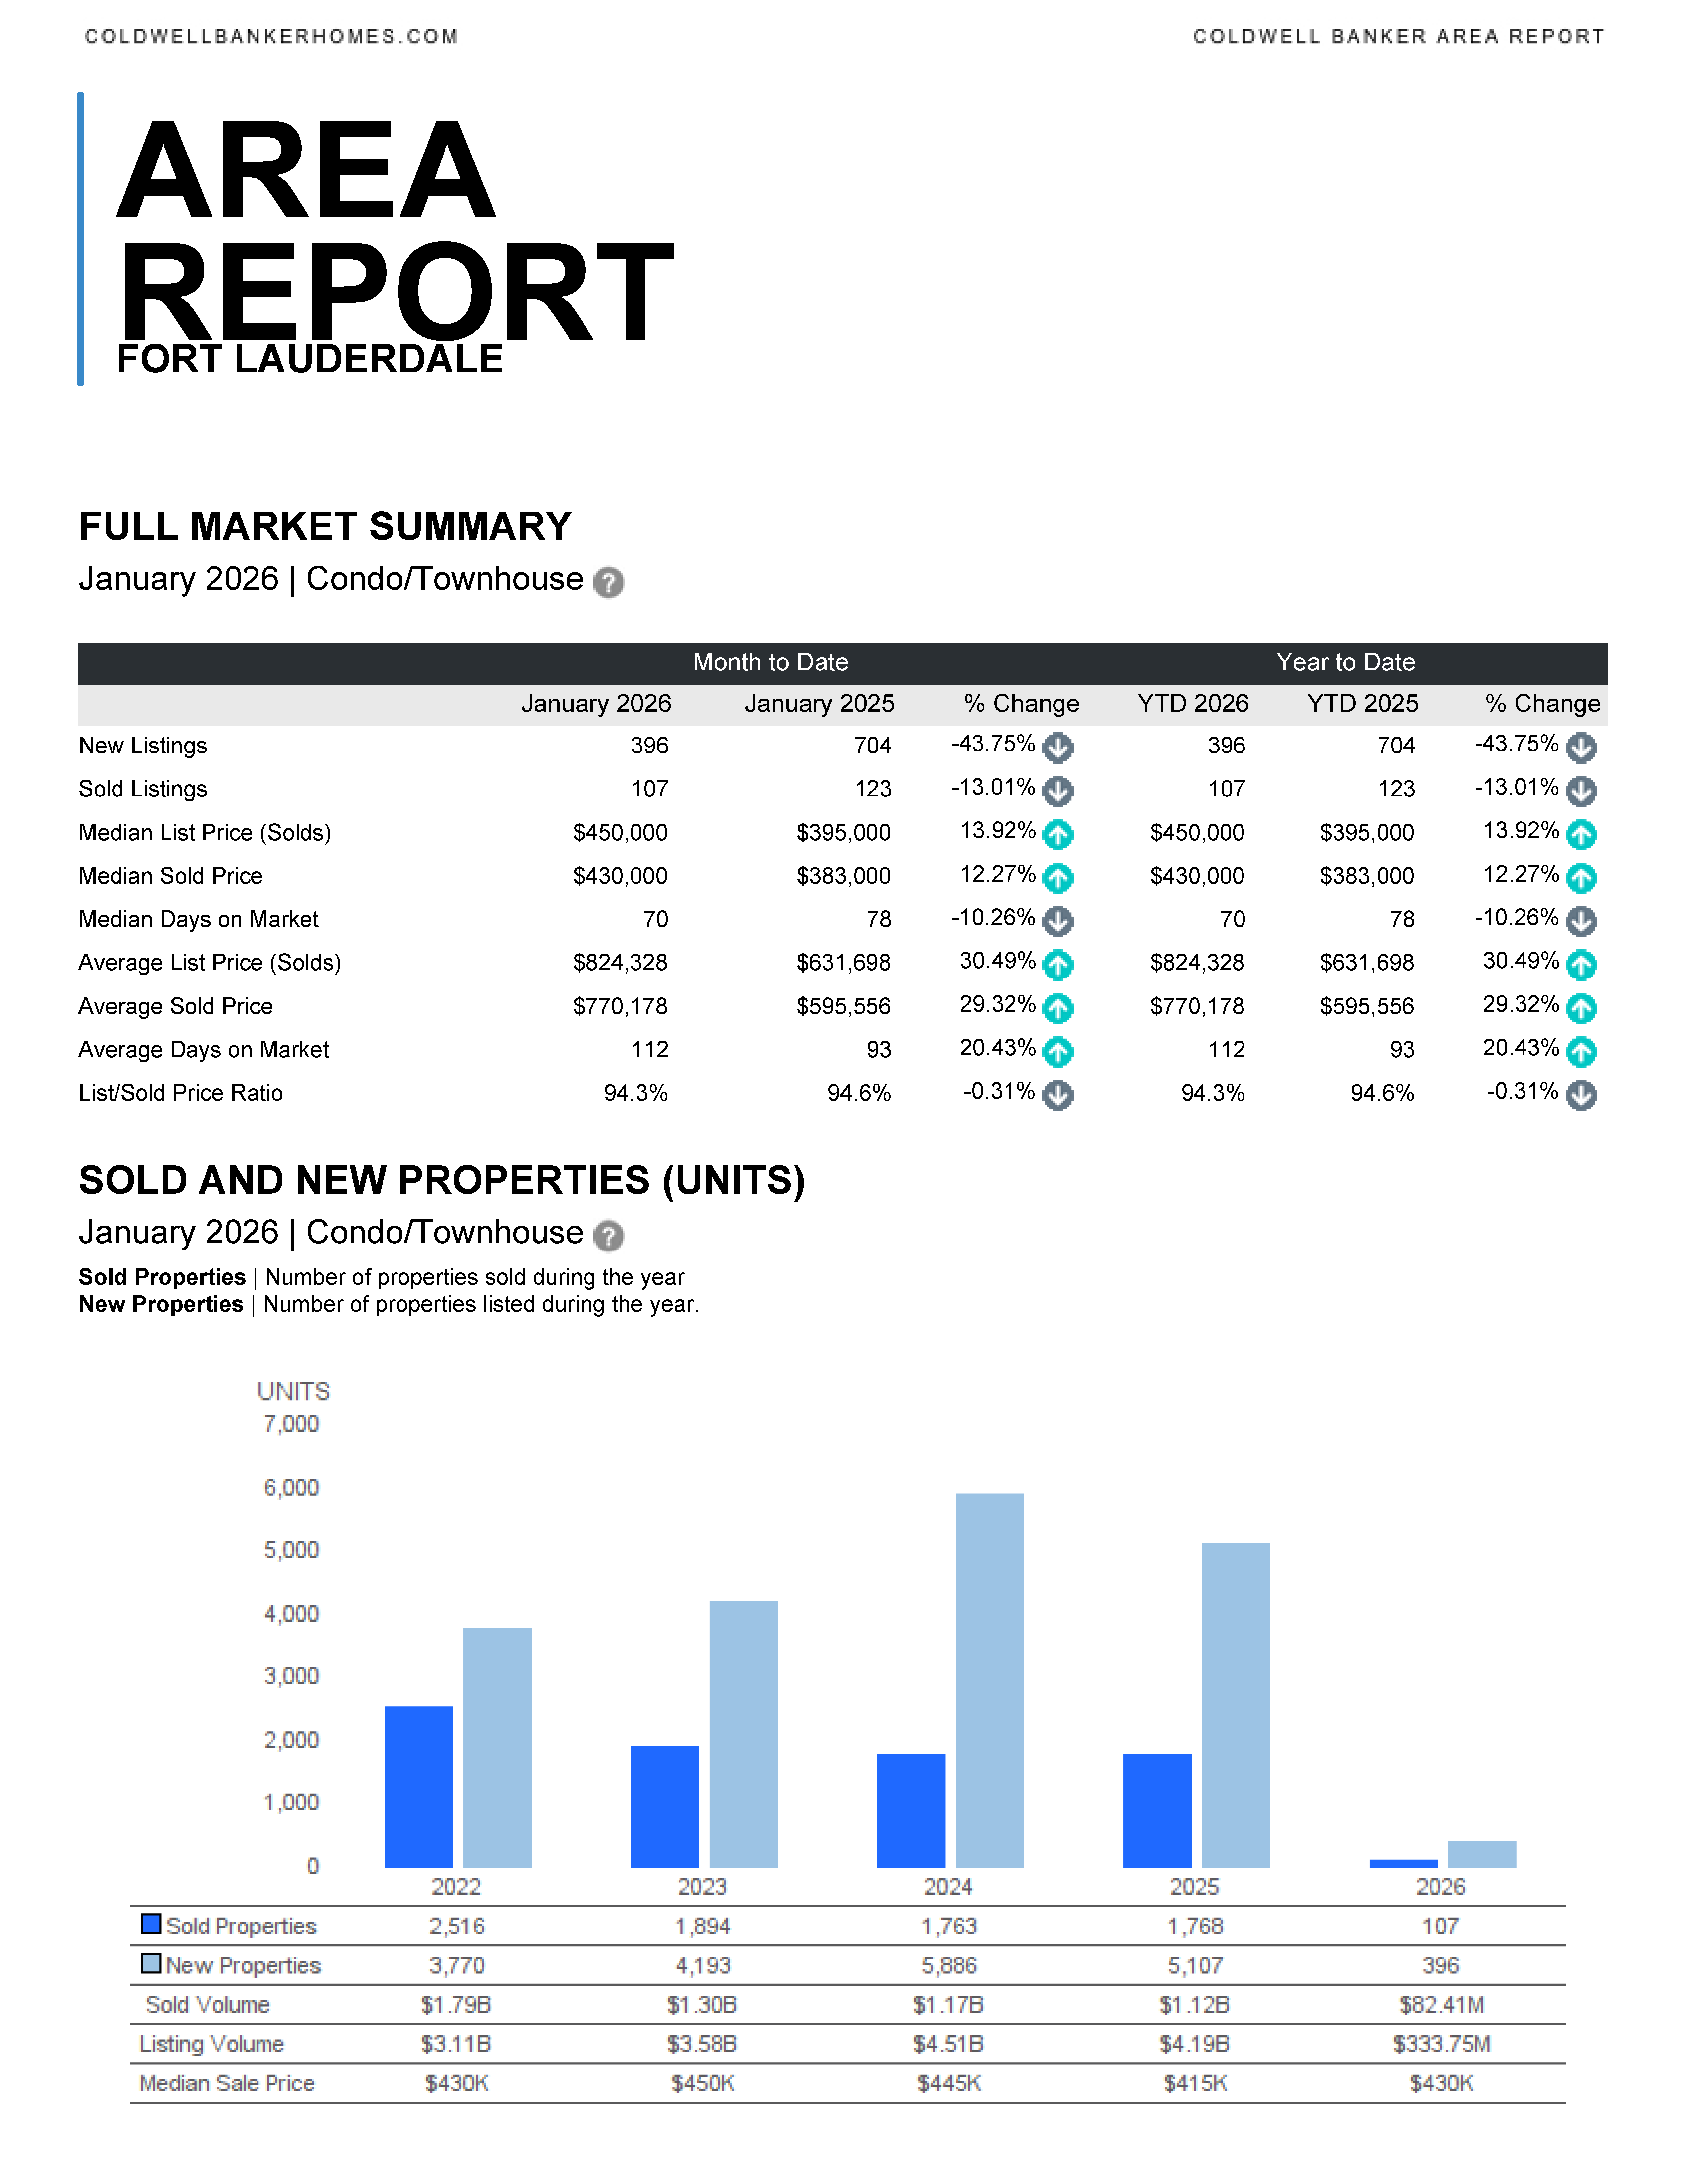
🏢 Condos & Townhomes
- Significant drop in new listings: Down ~44% year over year, tightening condo inventory.
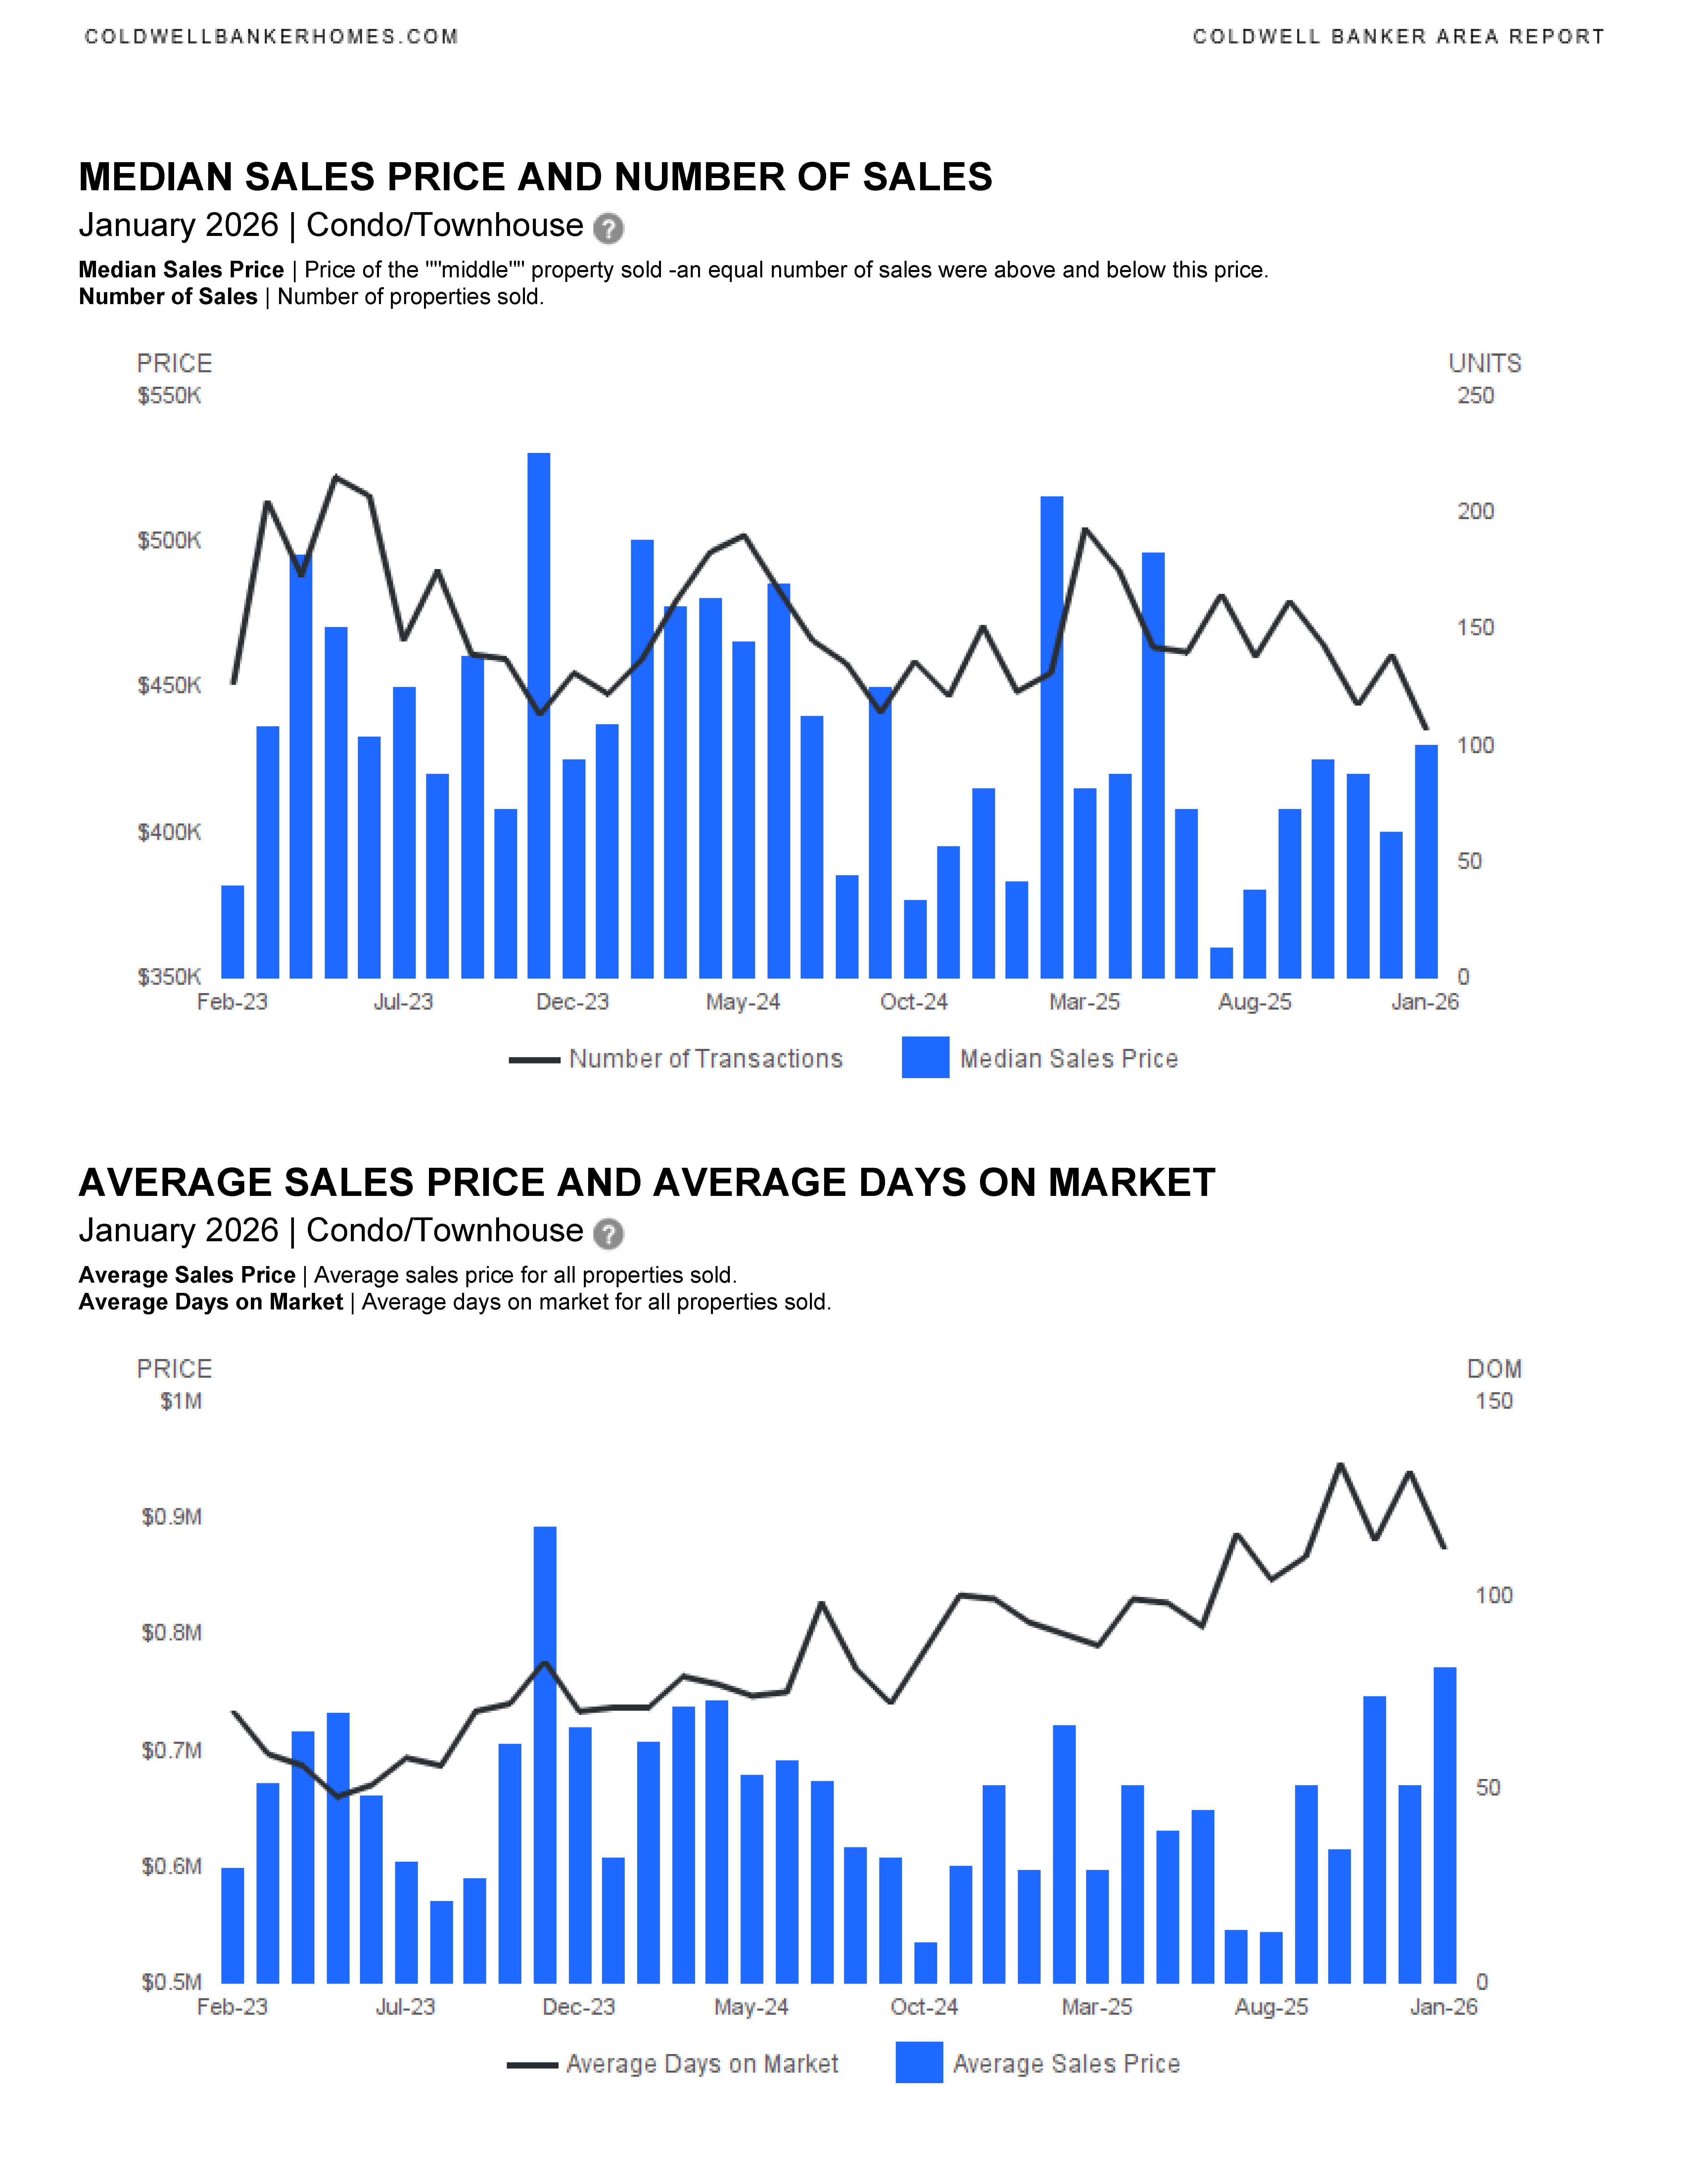
- Strong price growth:
- Median sold price rose to $430,000 (+12.3% YoY).
- Average sold price jumped to $770,178 (+29% YoY).
- Sales volume slightly lower, but pricing remains resilient.
- Longer selling timeline:
- Average days on market increased to 112 days, indicating buyers are taking more time.
🔑 Overall Takeaway
- Low inventory + rising prices continue to define the Fort Lauderdale market.
- Sellers still hold an advantage, but pricing and presentation matter more than ever.
- Buyers face fewer choices, especially in desirable areas, reinforcing the importance of strategy and timing.


In this housing market in SE Florida, you need to work with an experienced and knowledgeable real estate professional. Please contact me if you would like to be sent updated market reports for YOUR specific neighborhood, Fort Lauderdale, or another SE Florida city. We can discuss the market, current trends and how we can work together to accomplish your real estate goals. I am here to help.
CONTACT ANNETTE
Let’s start working together!
Annette Dammeyer, REALTOR®, ABR®, AHWD®
Coldwell Banker Realty
901 E Las Olas Blvd STE 101, Fort Lauderdale, FL 33301
808.747.3686
SL 3535792
Fort Lauderdale December 2025 Area Report
Fort Lauderdale December 2025 real estate statistics have been published.
Fort Lauderdale Area Reports
Single Family Homes
Condominium & Townhouses
Fort Lauderdale Real Estate Market Summary – December 2025
December 2025 | Single‑Family Homes & Condos/Townhomes
Overall Market Conditions
- The Fort Lauderdale market shows slower activity, higher prices, and longer selling times, especially for single‑family homes.
- Inventory remains elevated, meaning buyers have more choices and sellers face more competition.
Single‑Family Homes
Key Trends
- Prices are up sharply year‑over‑year
- Median Sold Price: $779,500 (+34% vs. Dec 2024)
- Year‑to‑Date Median Sold Price: $640,000 (+9.4%)
- Fewer homes are selling
- December sales: 154 homes (+7.7% vs. last year)
- Year‑to‑date sales: down nearly 10%
- Homes are taking longer to sell
- Median Days on Market: 48 days (up from 40)
- Average Days on Market (YTD): 84 days
- Sellers are close to asking price
- List‑to‑Sold Price Ratio: 95.3%
What It Means
- Strong pricing favors sellers, but longer market times mean homes must be priced competitively and show well.
- Buyers benefit from more negotiating power than in prior years.
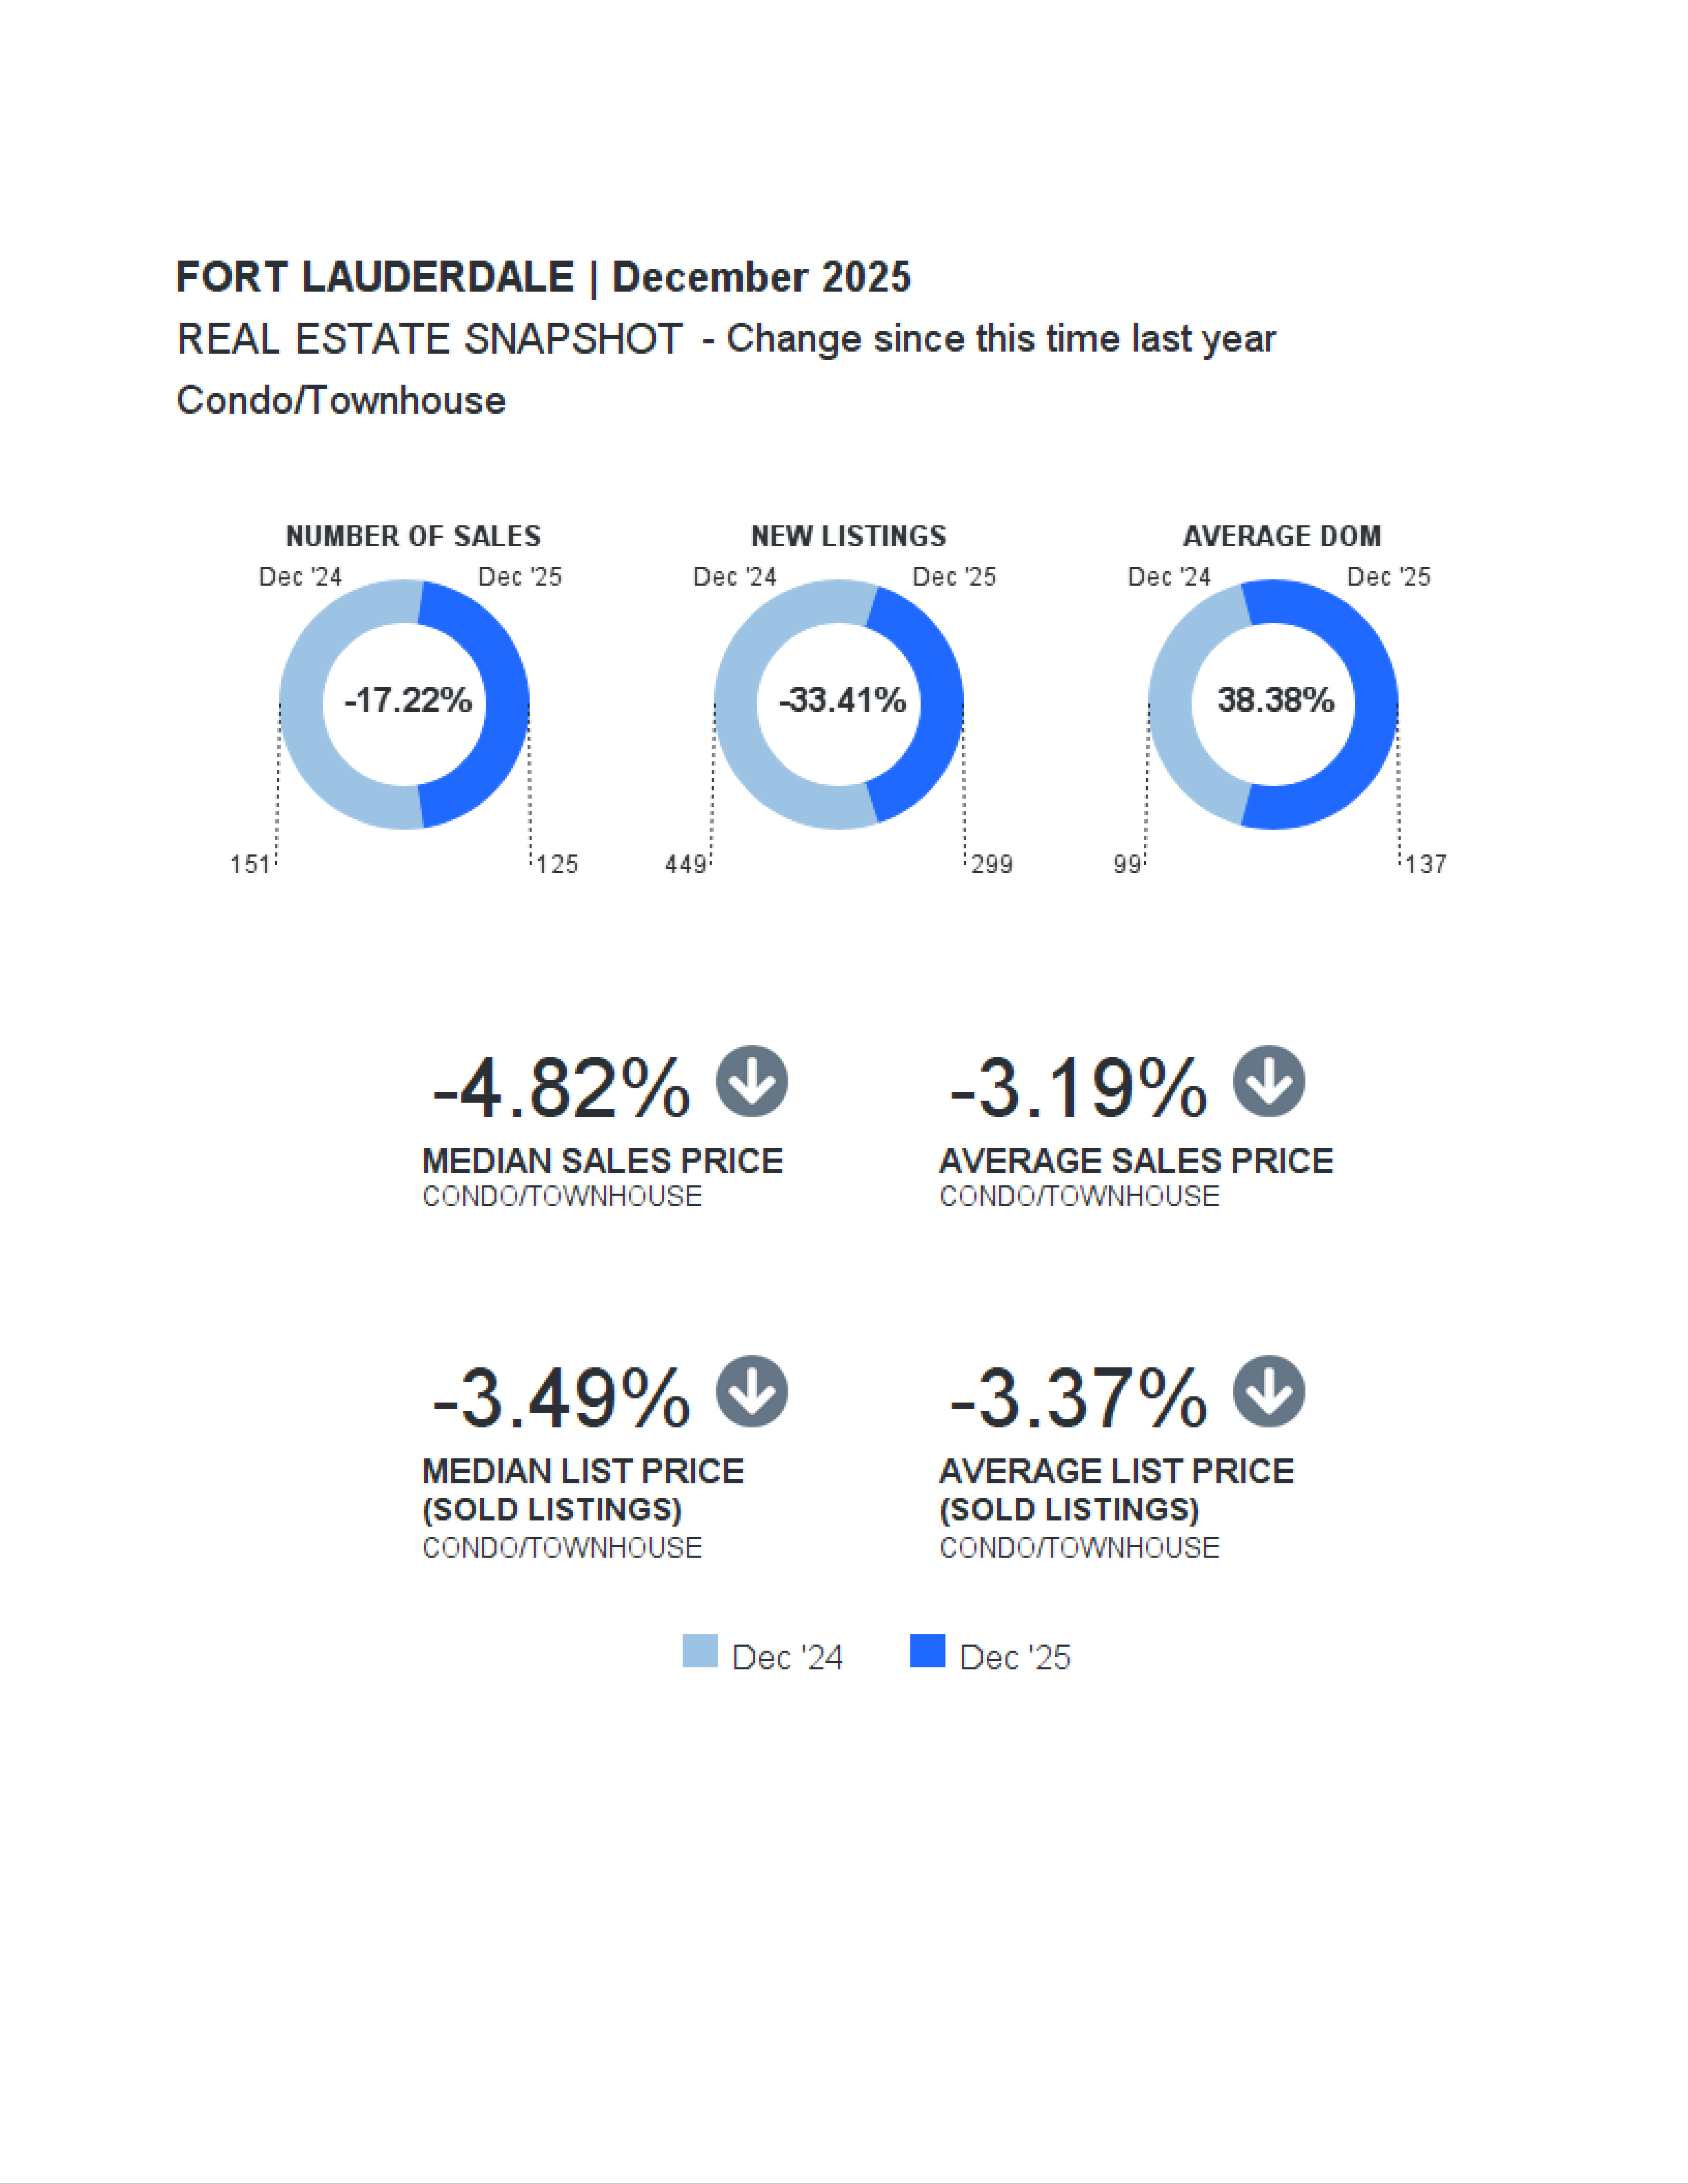
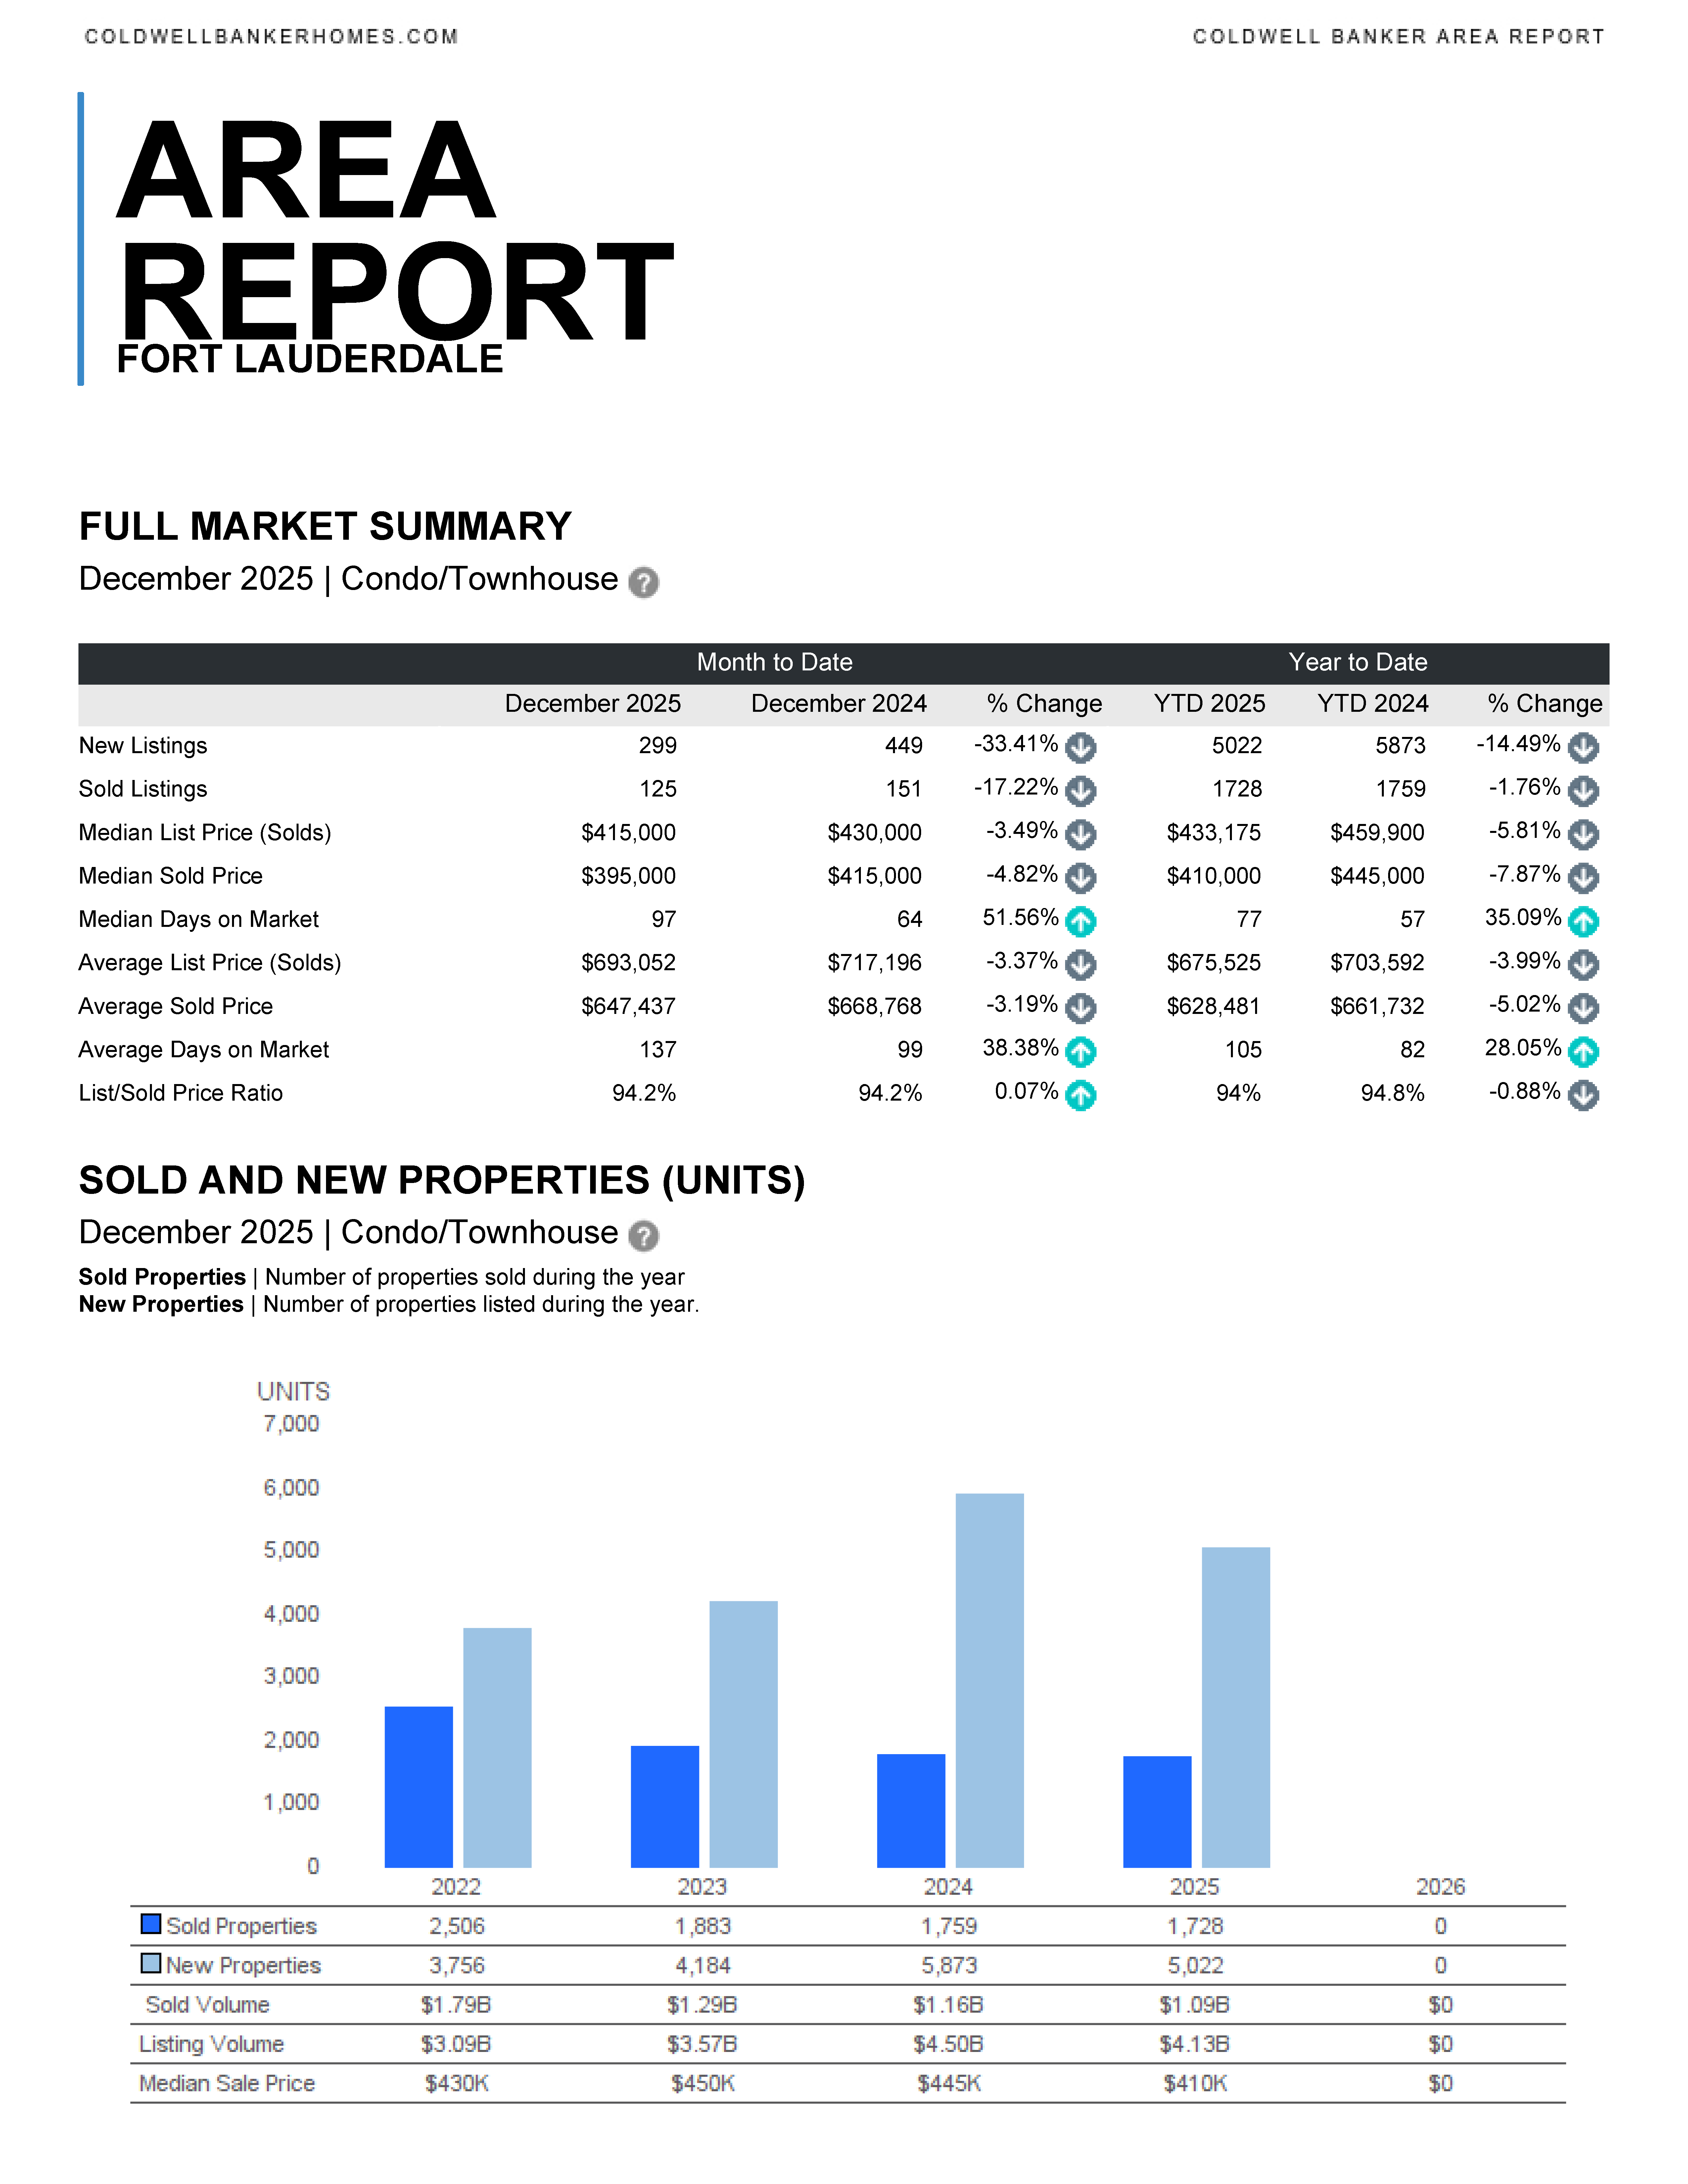
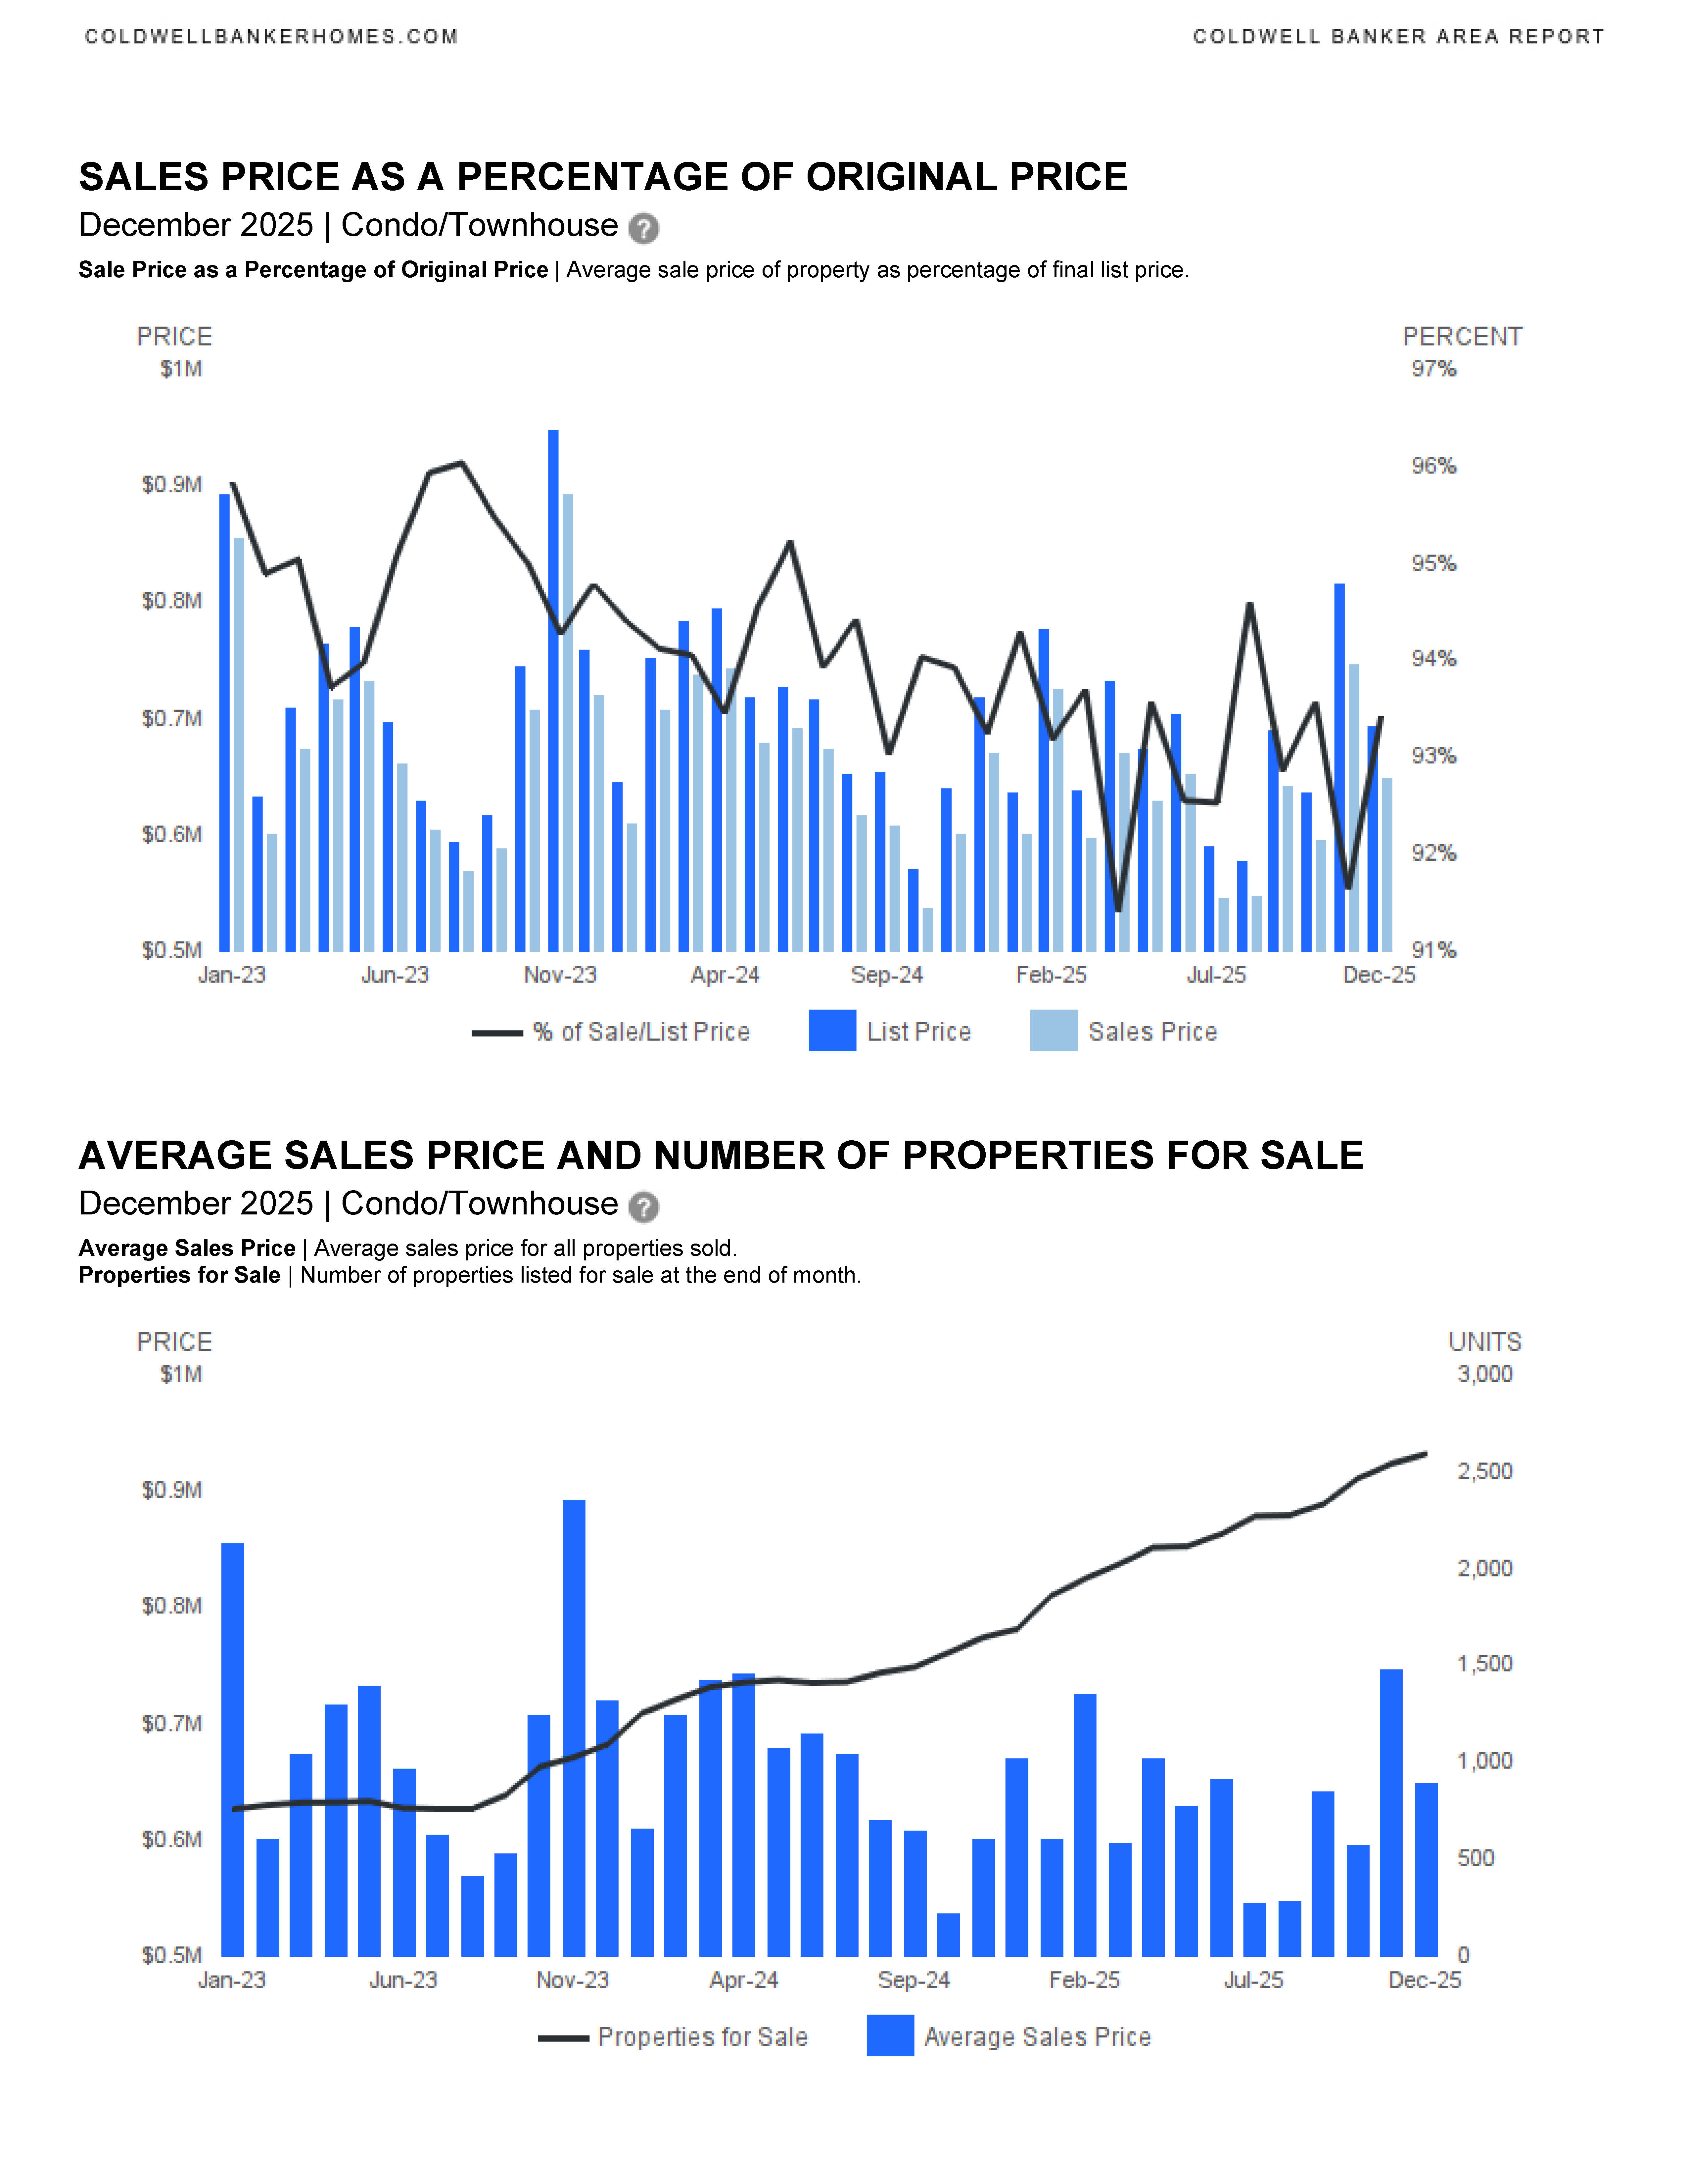
Condo & Townhome Market
Key Trends
- Prices are declining
- Median Sold Price: $395,000 (–4.8% YoY)
- YTD Median Sold Price: $410,000 (–7.9%)
- Sales activity has slowed
- December sales: down 17%
- Year‑to‑date sales: slightly lower than 2024
- Significantly longer selling times
- Median Days on Market: 97 days (up from 64)
- Average Days on Market: 137 days
- More discounts are occurring
- List‑to‑Sold Price Ratio: 94.2%
What It Means
- The condo market is clearly buyer‑favored.
- Pricing pressure and longer timelines suggest strategic pricing is critical for sellers.
- Buyers may find value opportunities, especially compared to single‑family homes.
Inventory & Supply
- The market continues to reflect higher months of supply, especially for condos.
- A “balanced” market is typically around 6 months of supply—current levels indicate increased competition among sellers in many segments.
Bottom Line
- Single‑family homes: Prices are strong, but the pace has slowed. Sellers must stay competitive; buyers have more leverage than in recent years.
- Condos/townhomes: Softer prices, longer selling times, and fewer sales point to a clear buyer’s market.
- Overall: Fort Lauderdale has moved away from the ultra‑competitive pandemic era and into a more normalized, negotiation‑friendly market.


We are in a new housing market in SE Florida. This is the time to work with an experienced and knowledgeable real estate professional. Please contact me if you would like to be sent updated market reports for YOUR specific neighborhood, Fort Lauderdale, or another SE Florida city. We can discuss the market, current trends and how we can work together to accomplish your real estate goals. I am here to help.
CONTACT ANNETTE
Let’s start working together!
Annette Dammeyer, REALTOR®, ABR®, AHWD®
Coldwell Banker Realty
901 E Las Olas Blvd STE 101, Fort Lauderdale, FL 33301
808.747.3686
SL 3535792
Fort Lauderdale November 2025 Area Report
Fort Lauderdale November 2025 real estate statistics have been published.
Fort Lauderdale Area Reports
Single Family Homes
Condominium & Townhouses
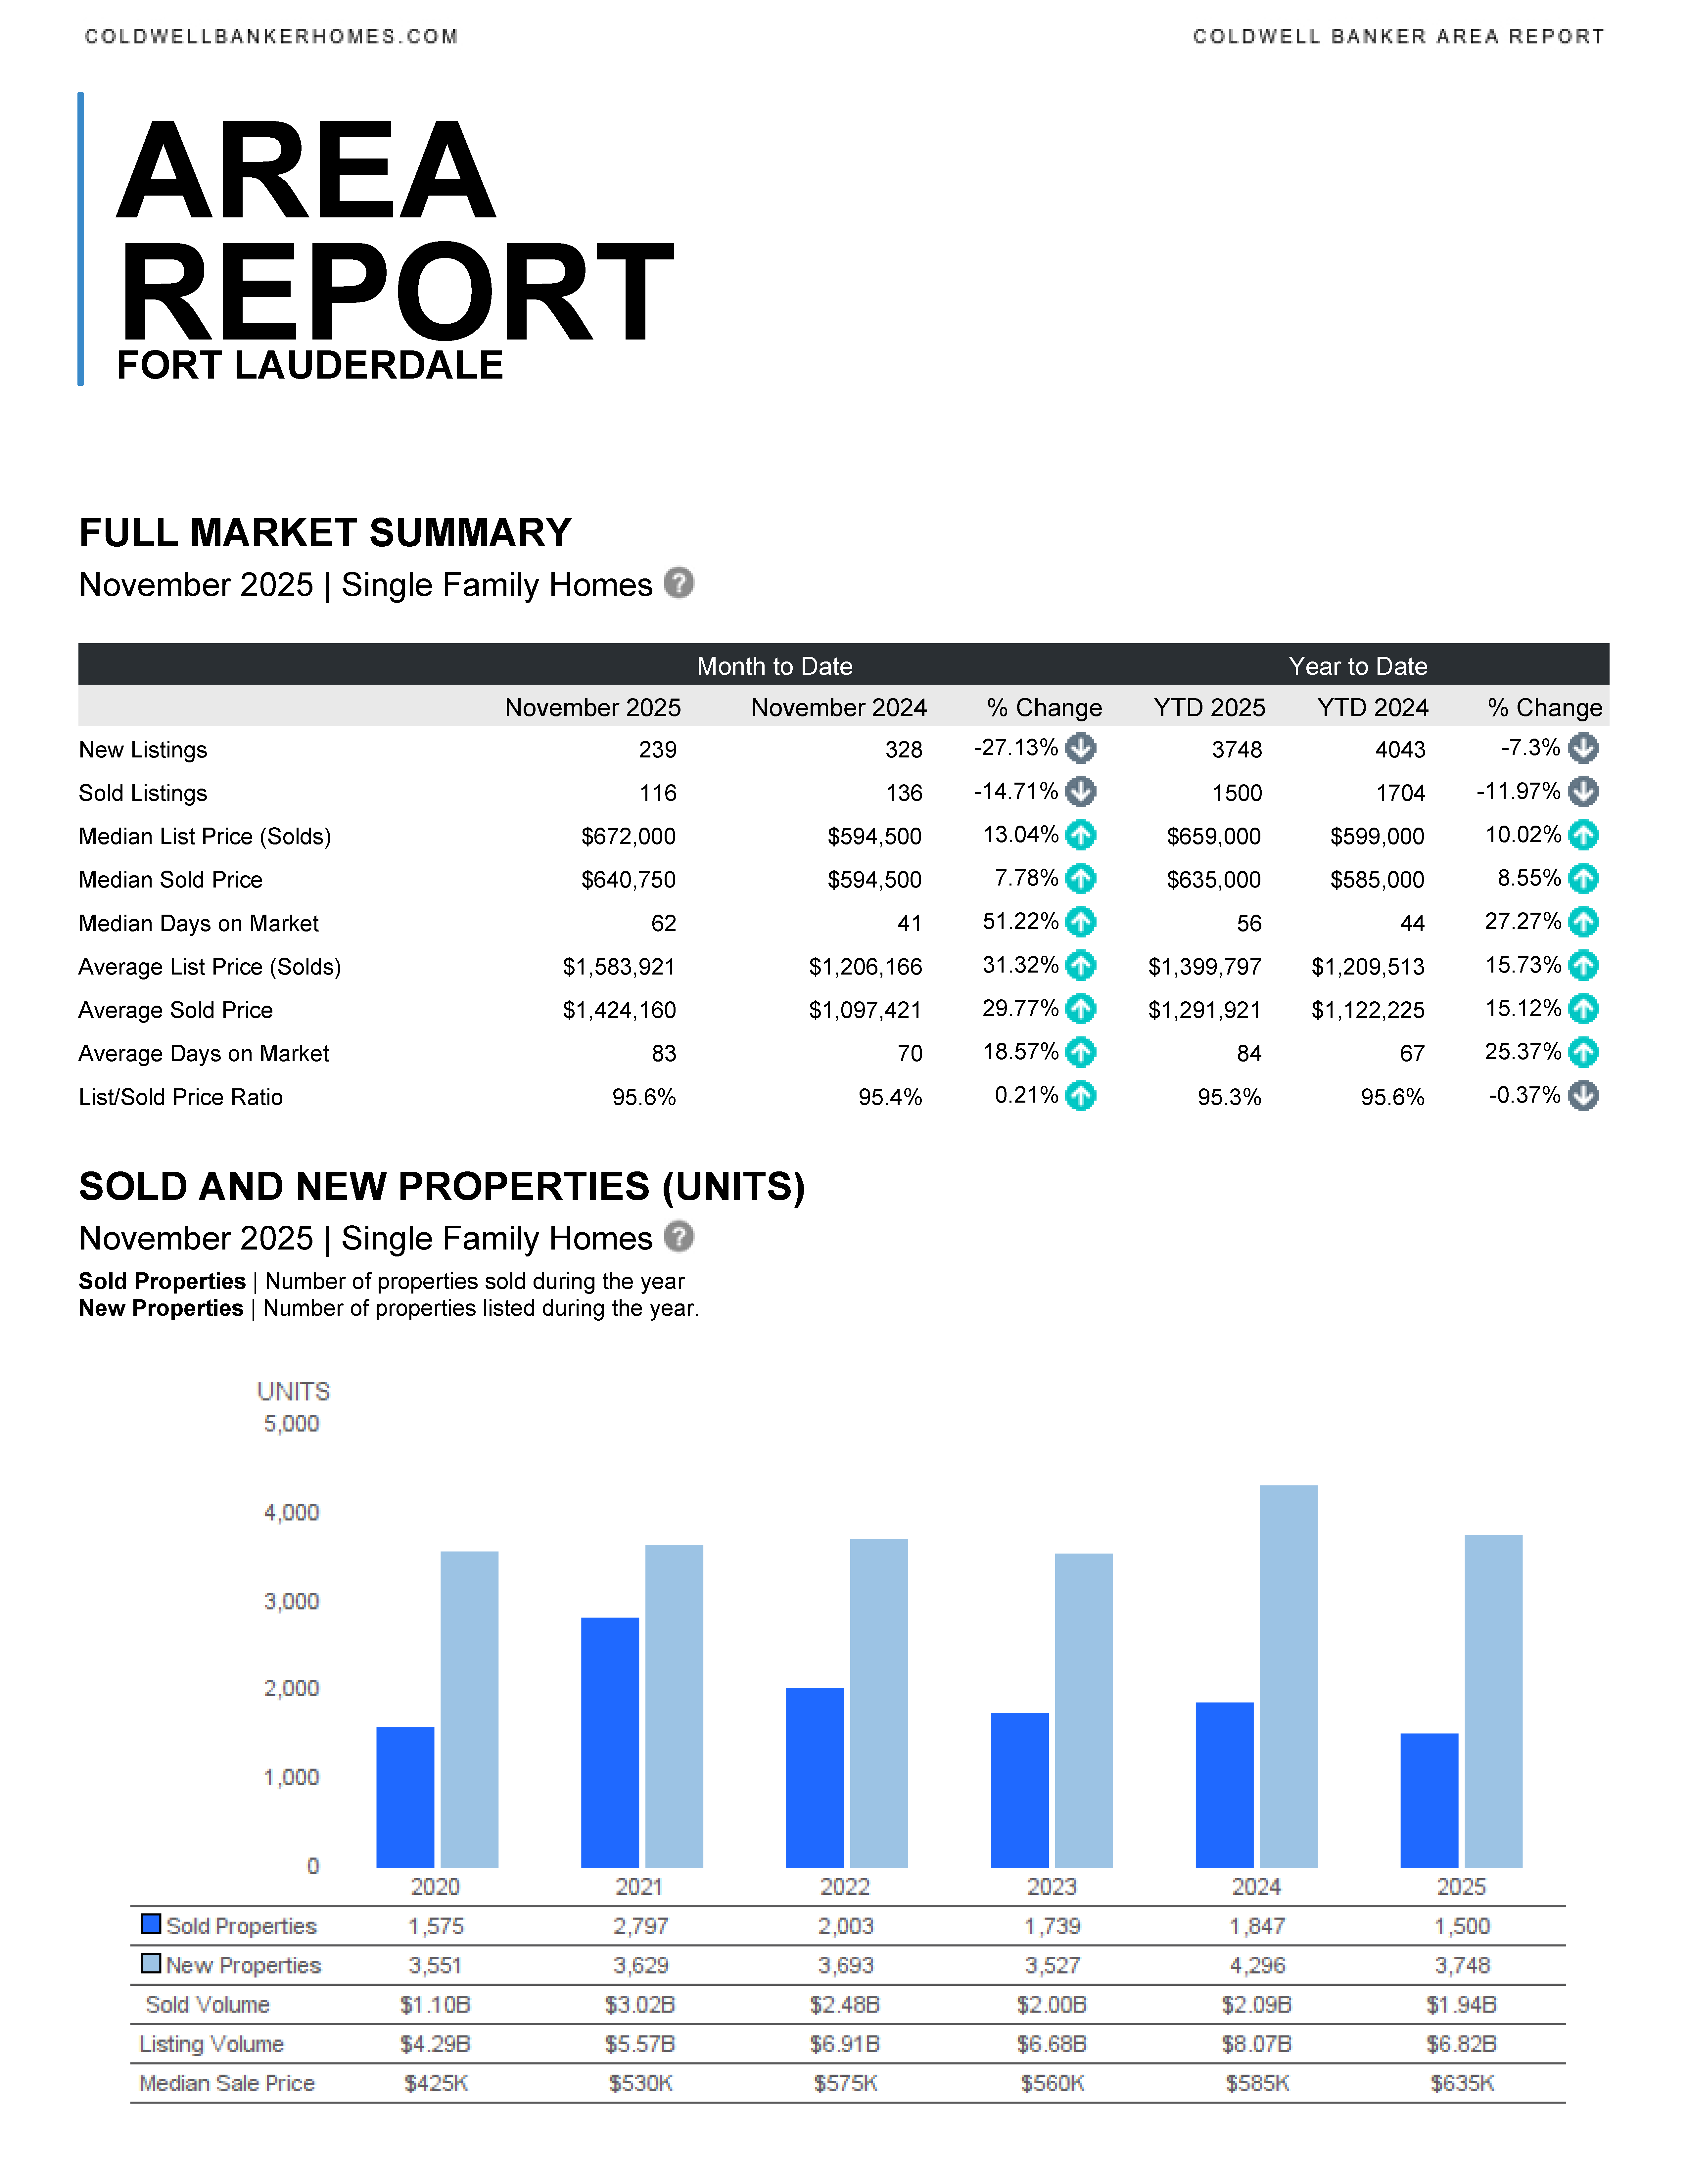
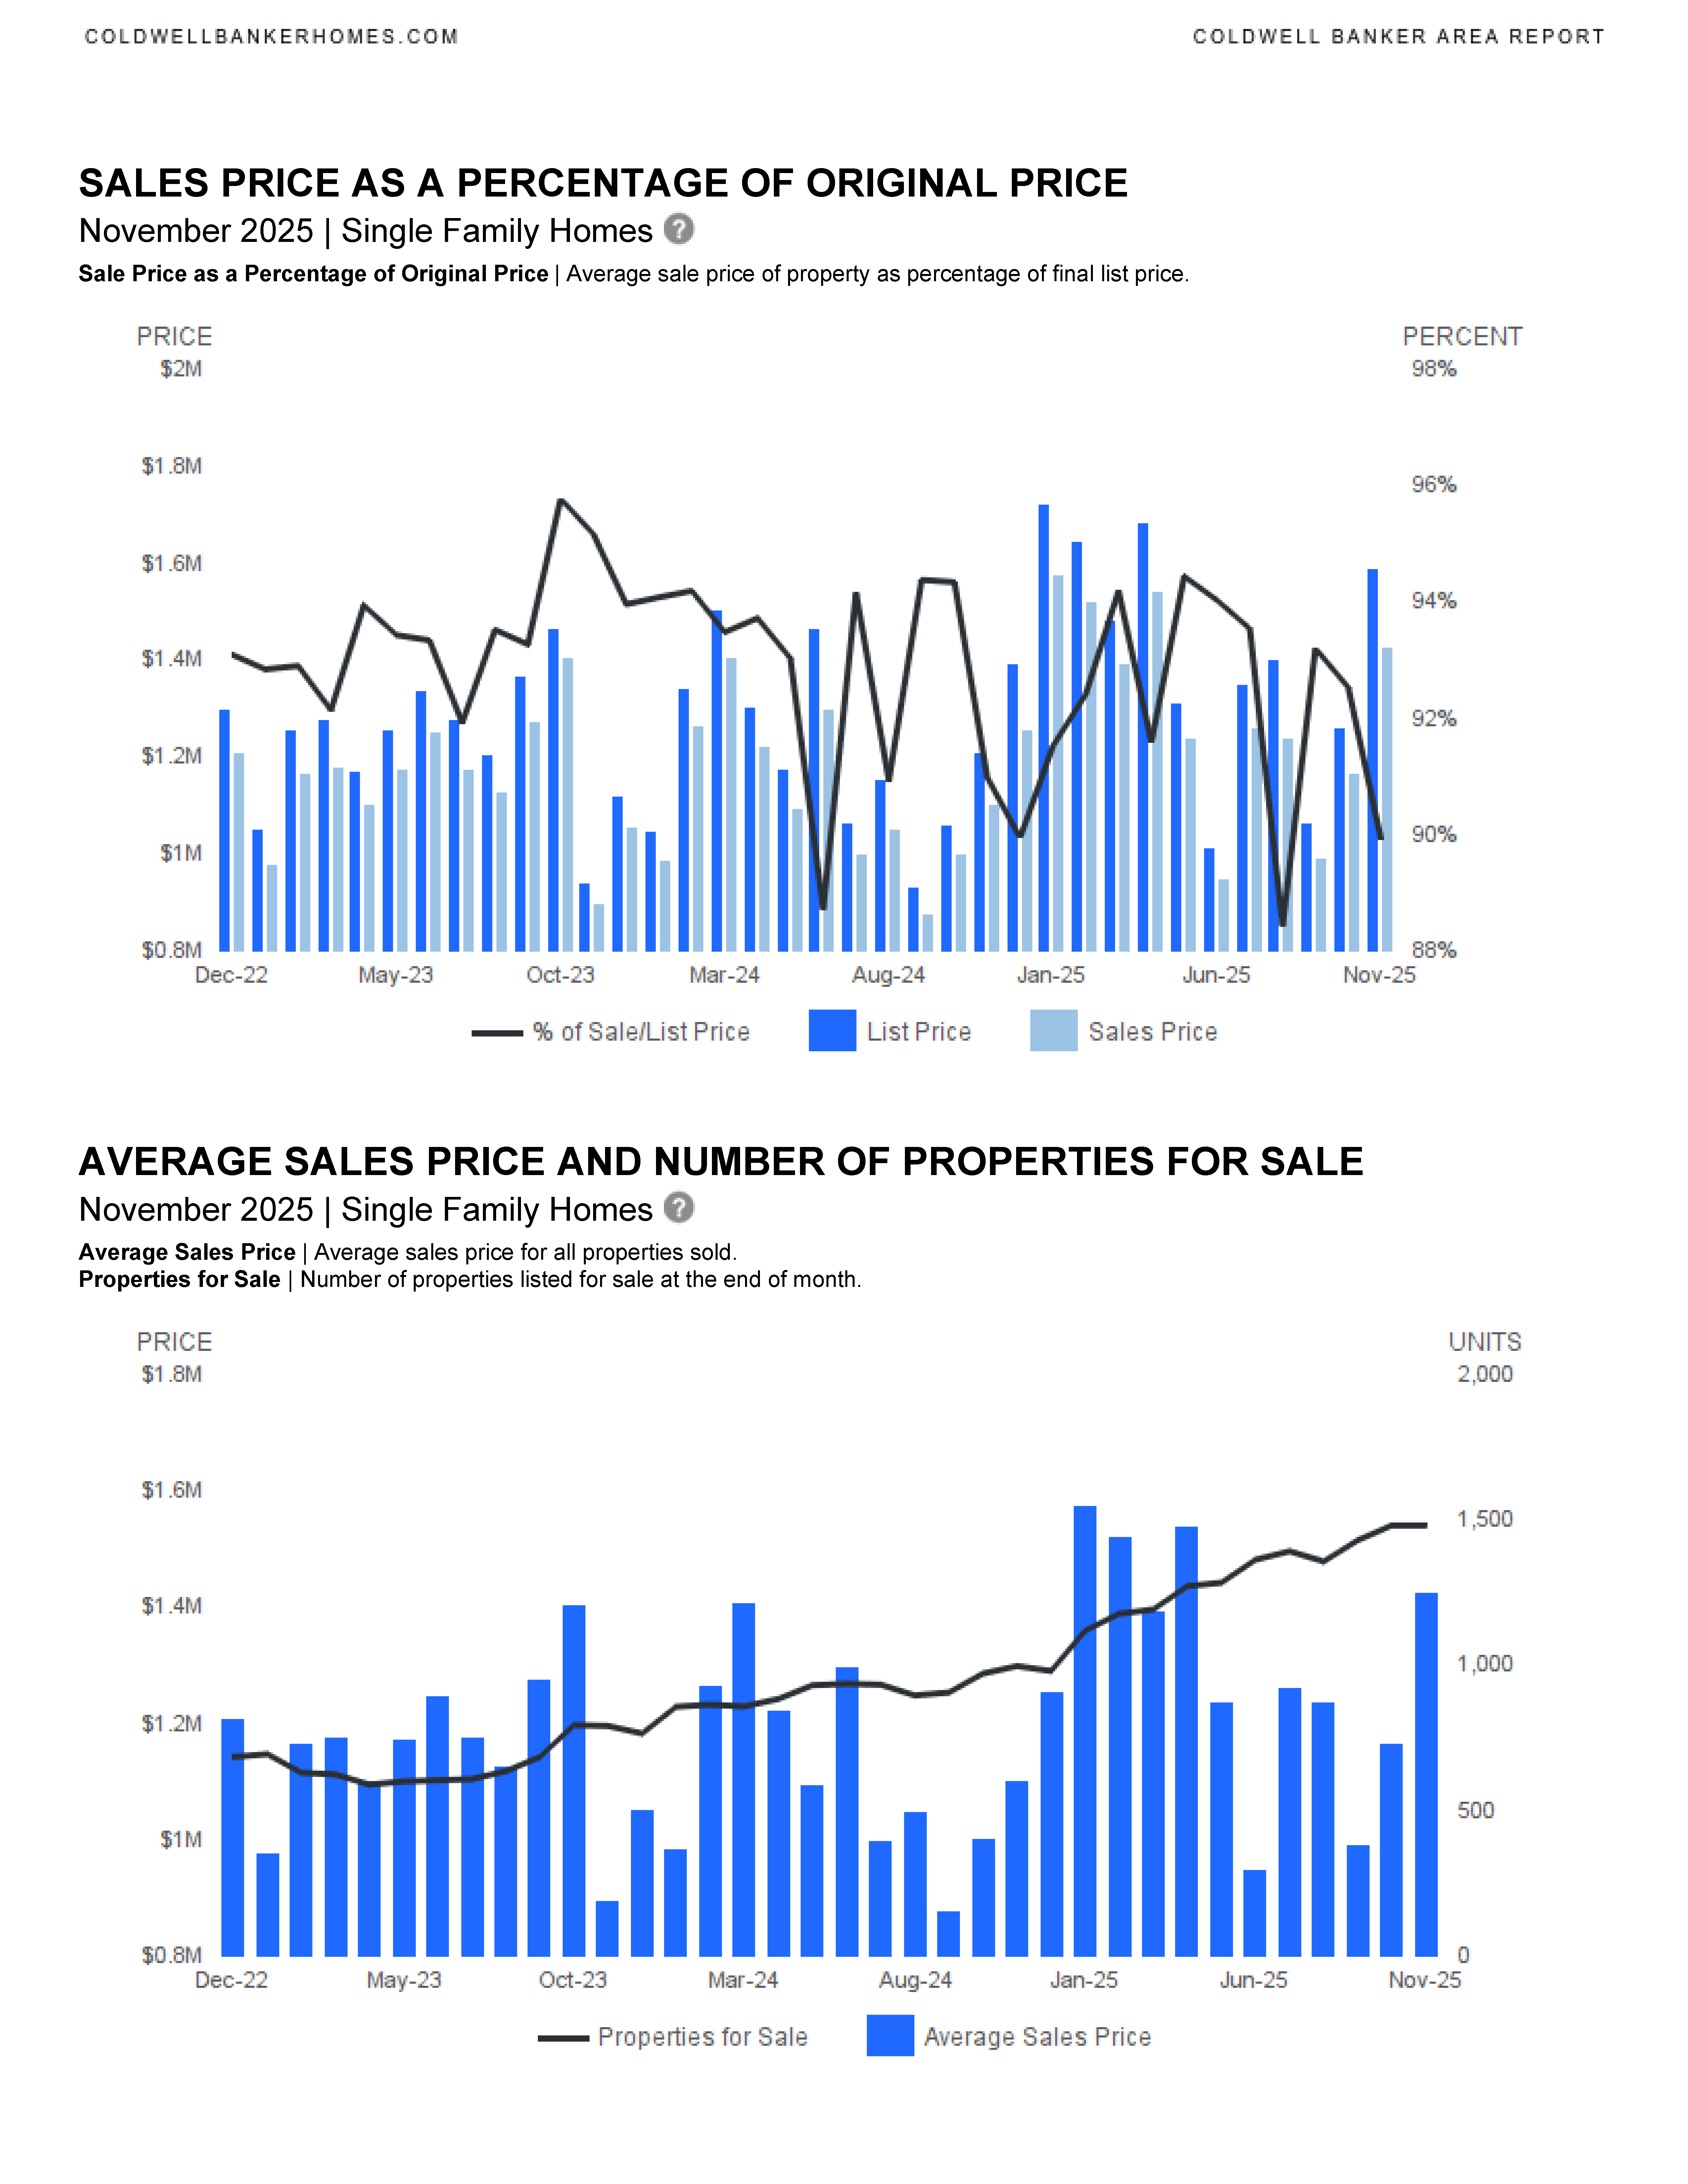
Fort Lauderdale Real Estate Market Summary – November 2025
🏡Single-Family Homes
- New Listings: 239 (↓27.1% YoY)
- Sold Listings: 116 (↓14.7% YoY)
- Median Sold Price: $640,750 (↑7.8% YoY)
- Average Sold Price: $1,424,160 (↑29.8% YoY)
- Median Days on Market: 62 (↑51.2% YoY)
- List/Sold Price Ratio: 95.6% (stable)
- Year-to-Date: Sales down 12%, prices up ~8–15%.
Key Trend: Inventory and sales declined, but prices surged significantly, especially at the high end.
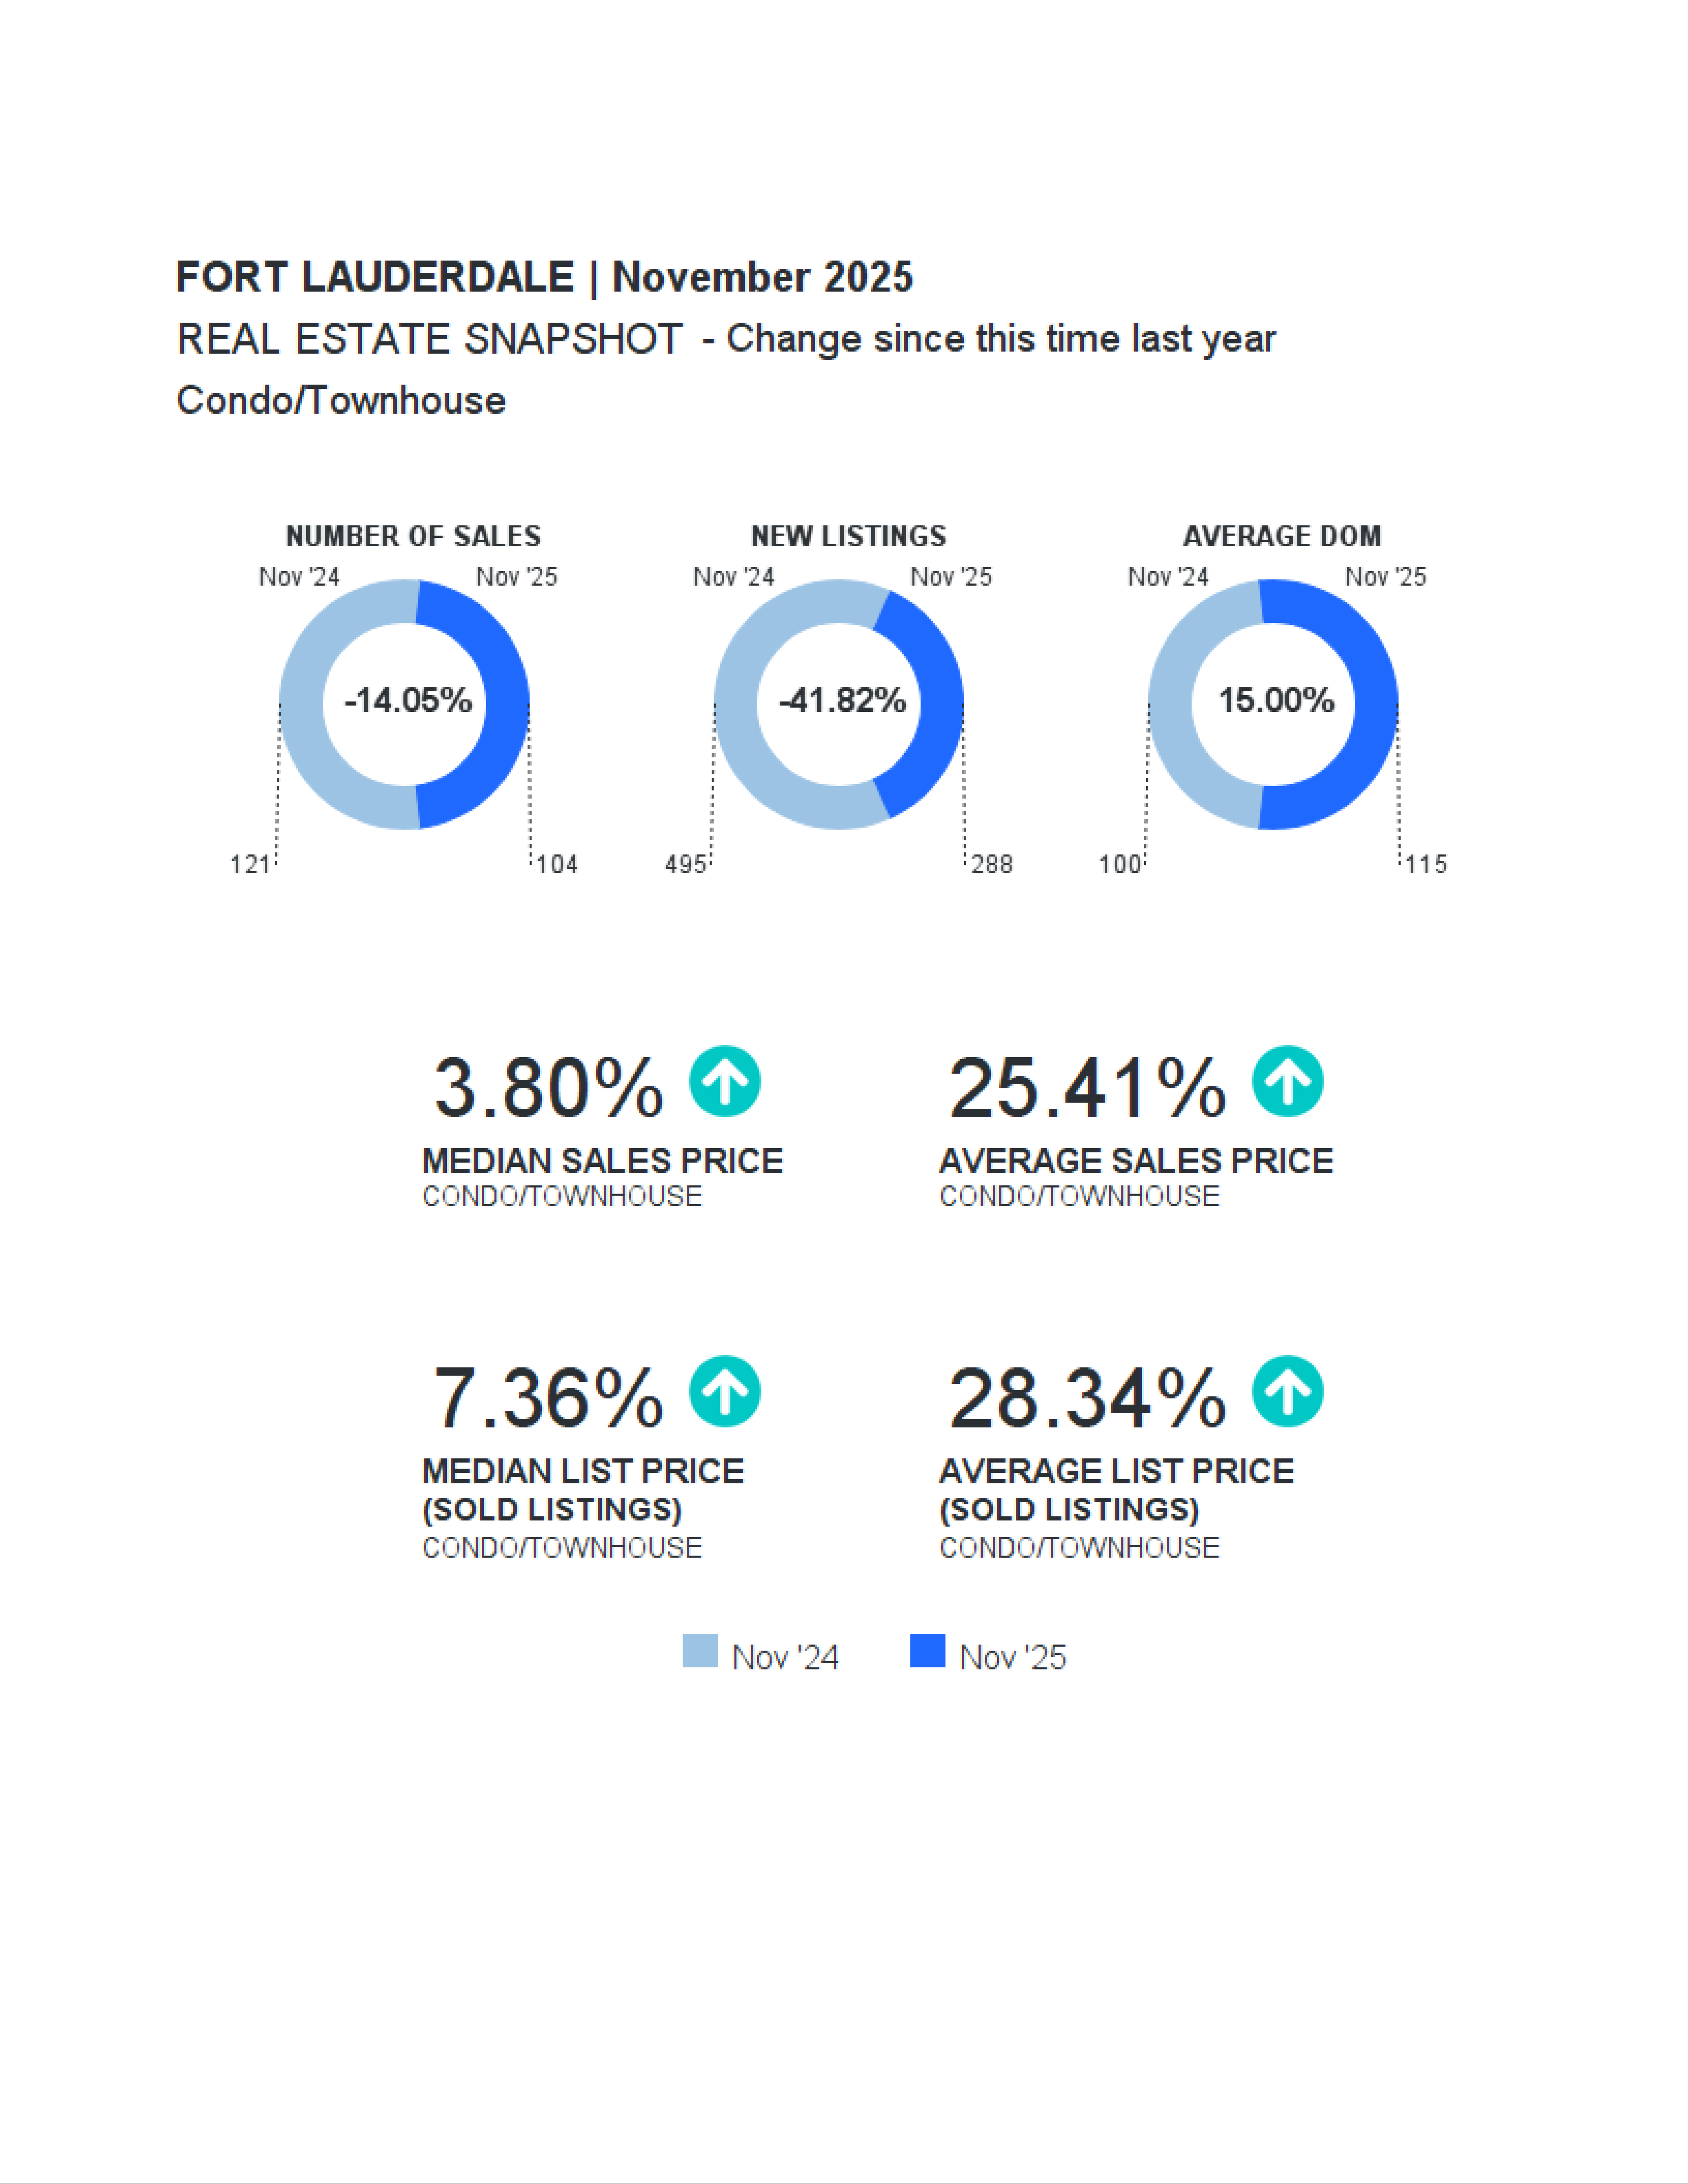
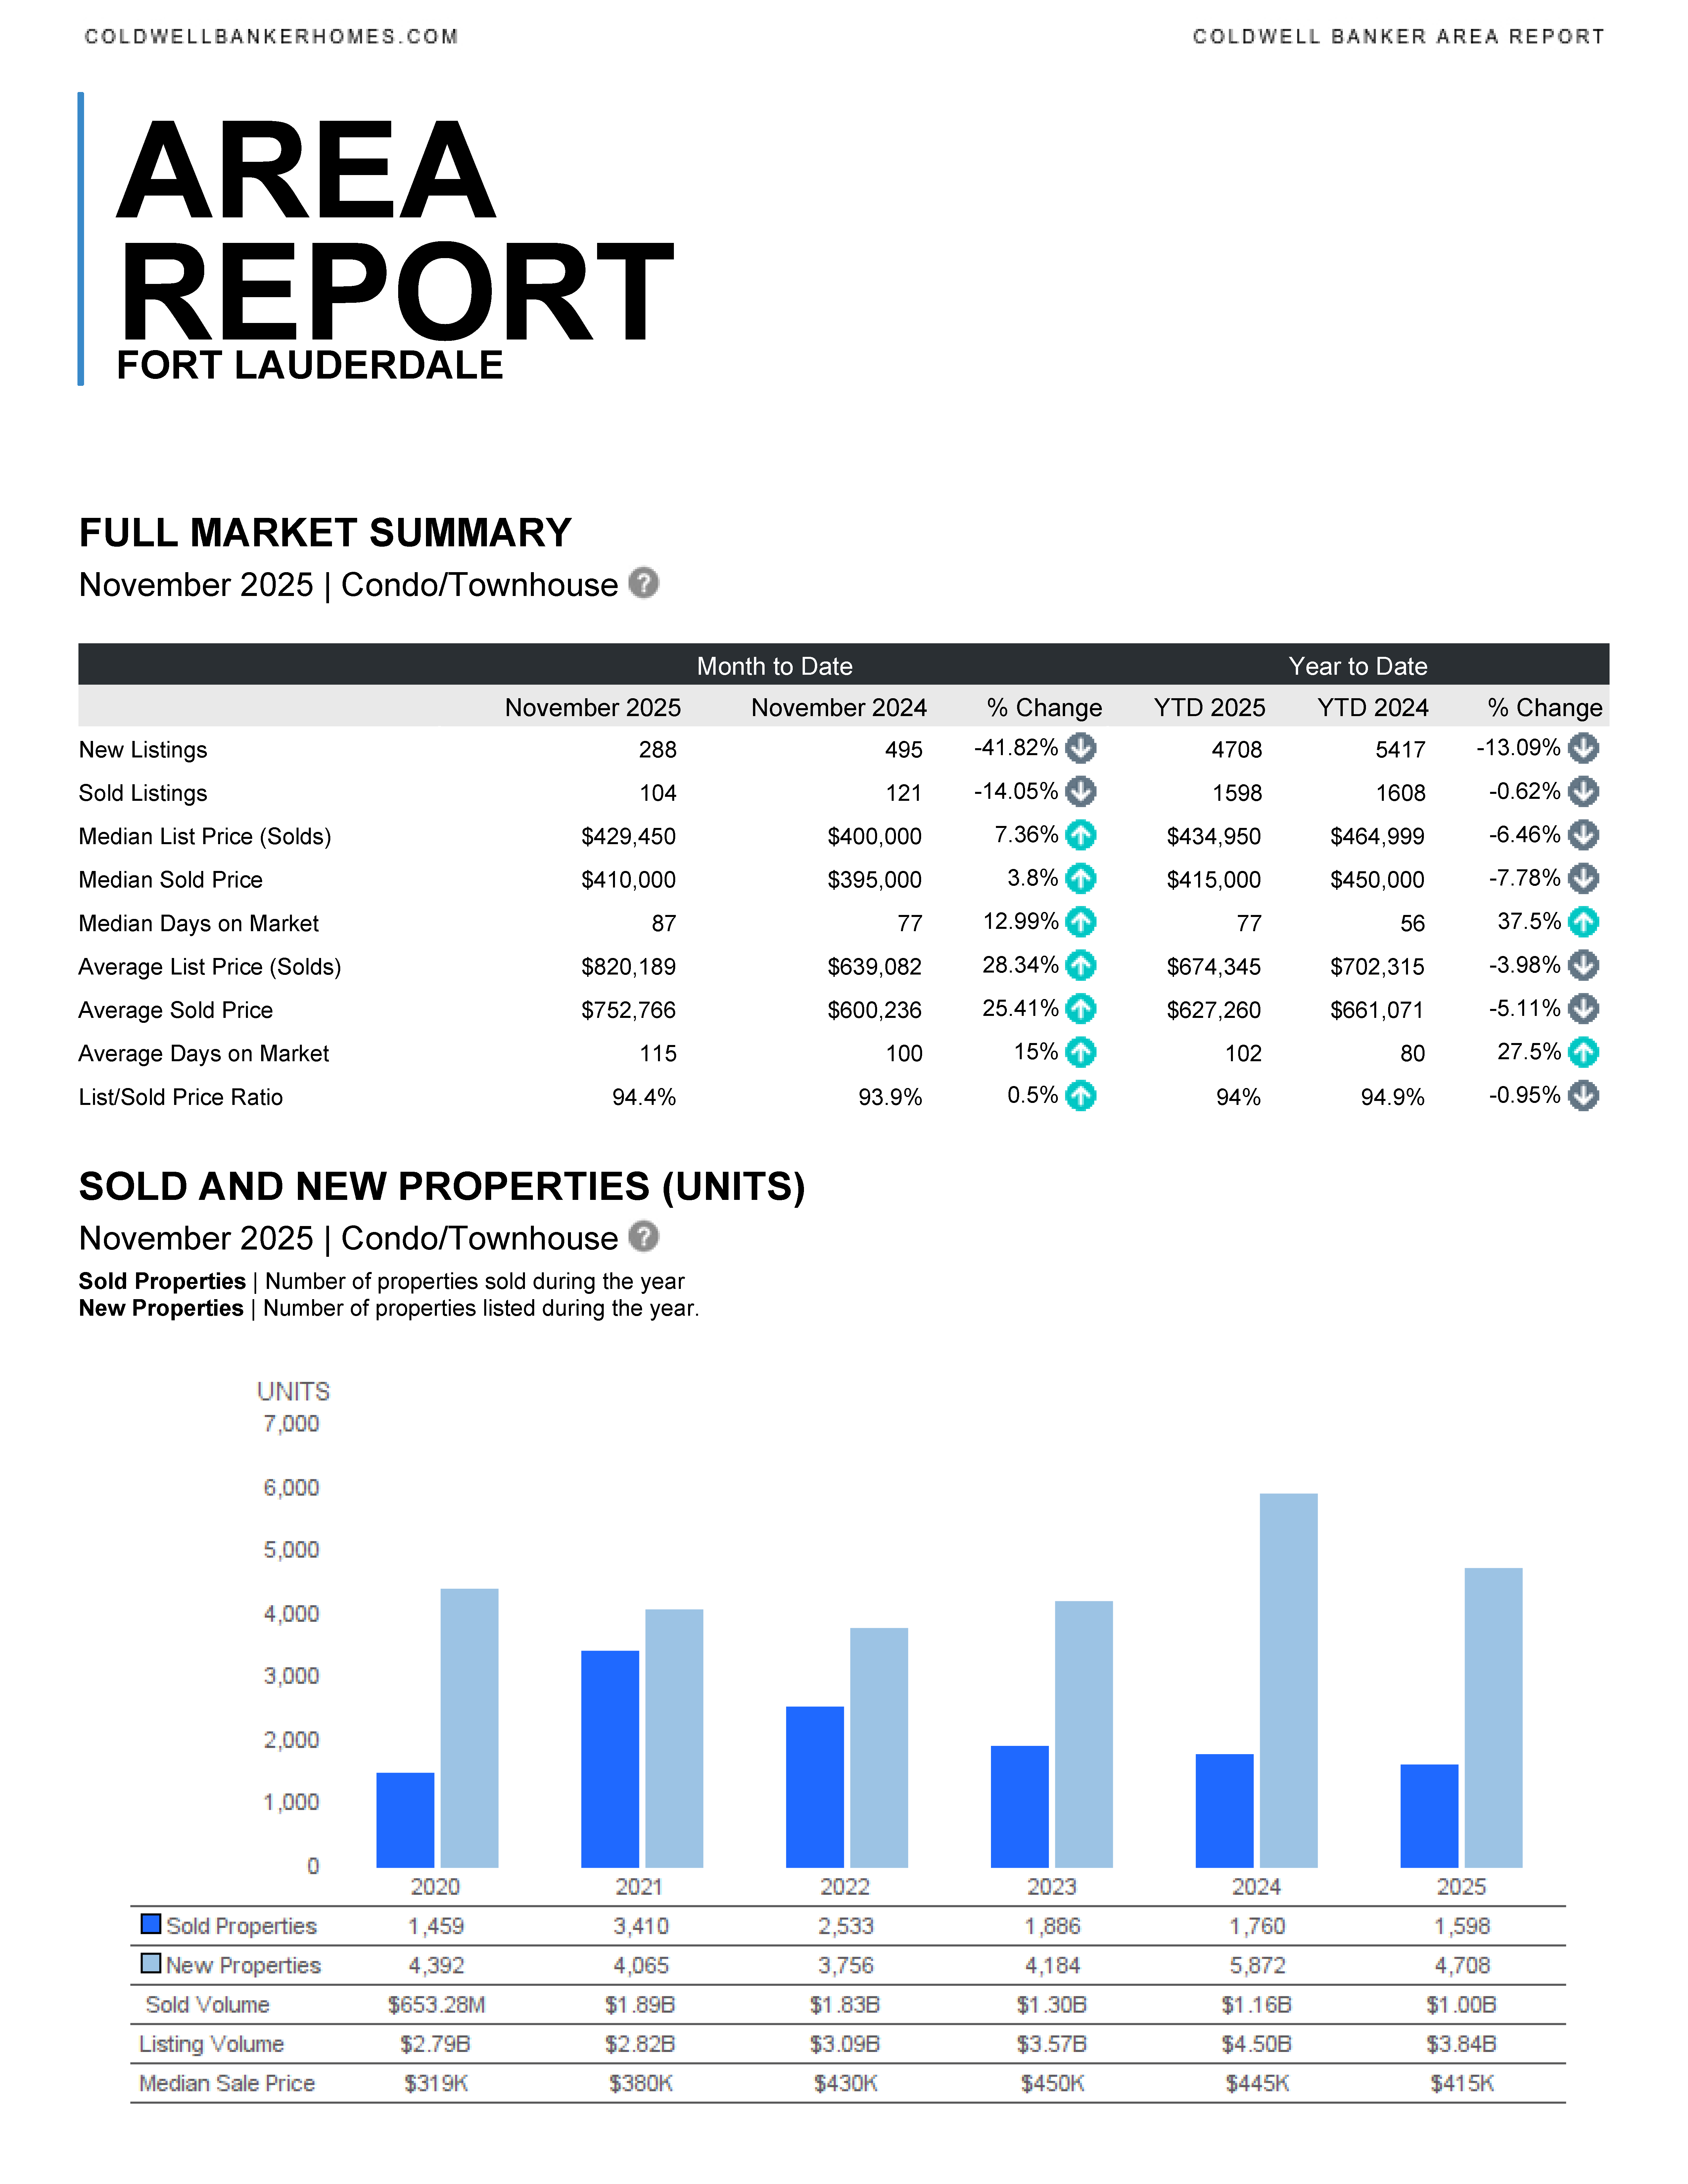
🏢Condo/Townhomes
- New Listings: 288 (↓41.8% YoY)
- Sold Listings: 104 (↓14.1% YoY)
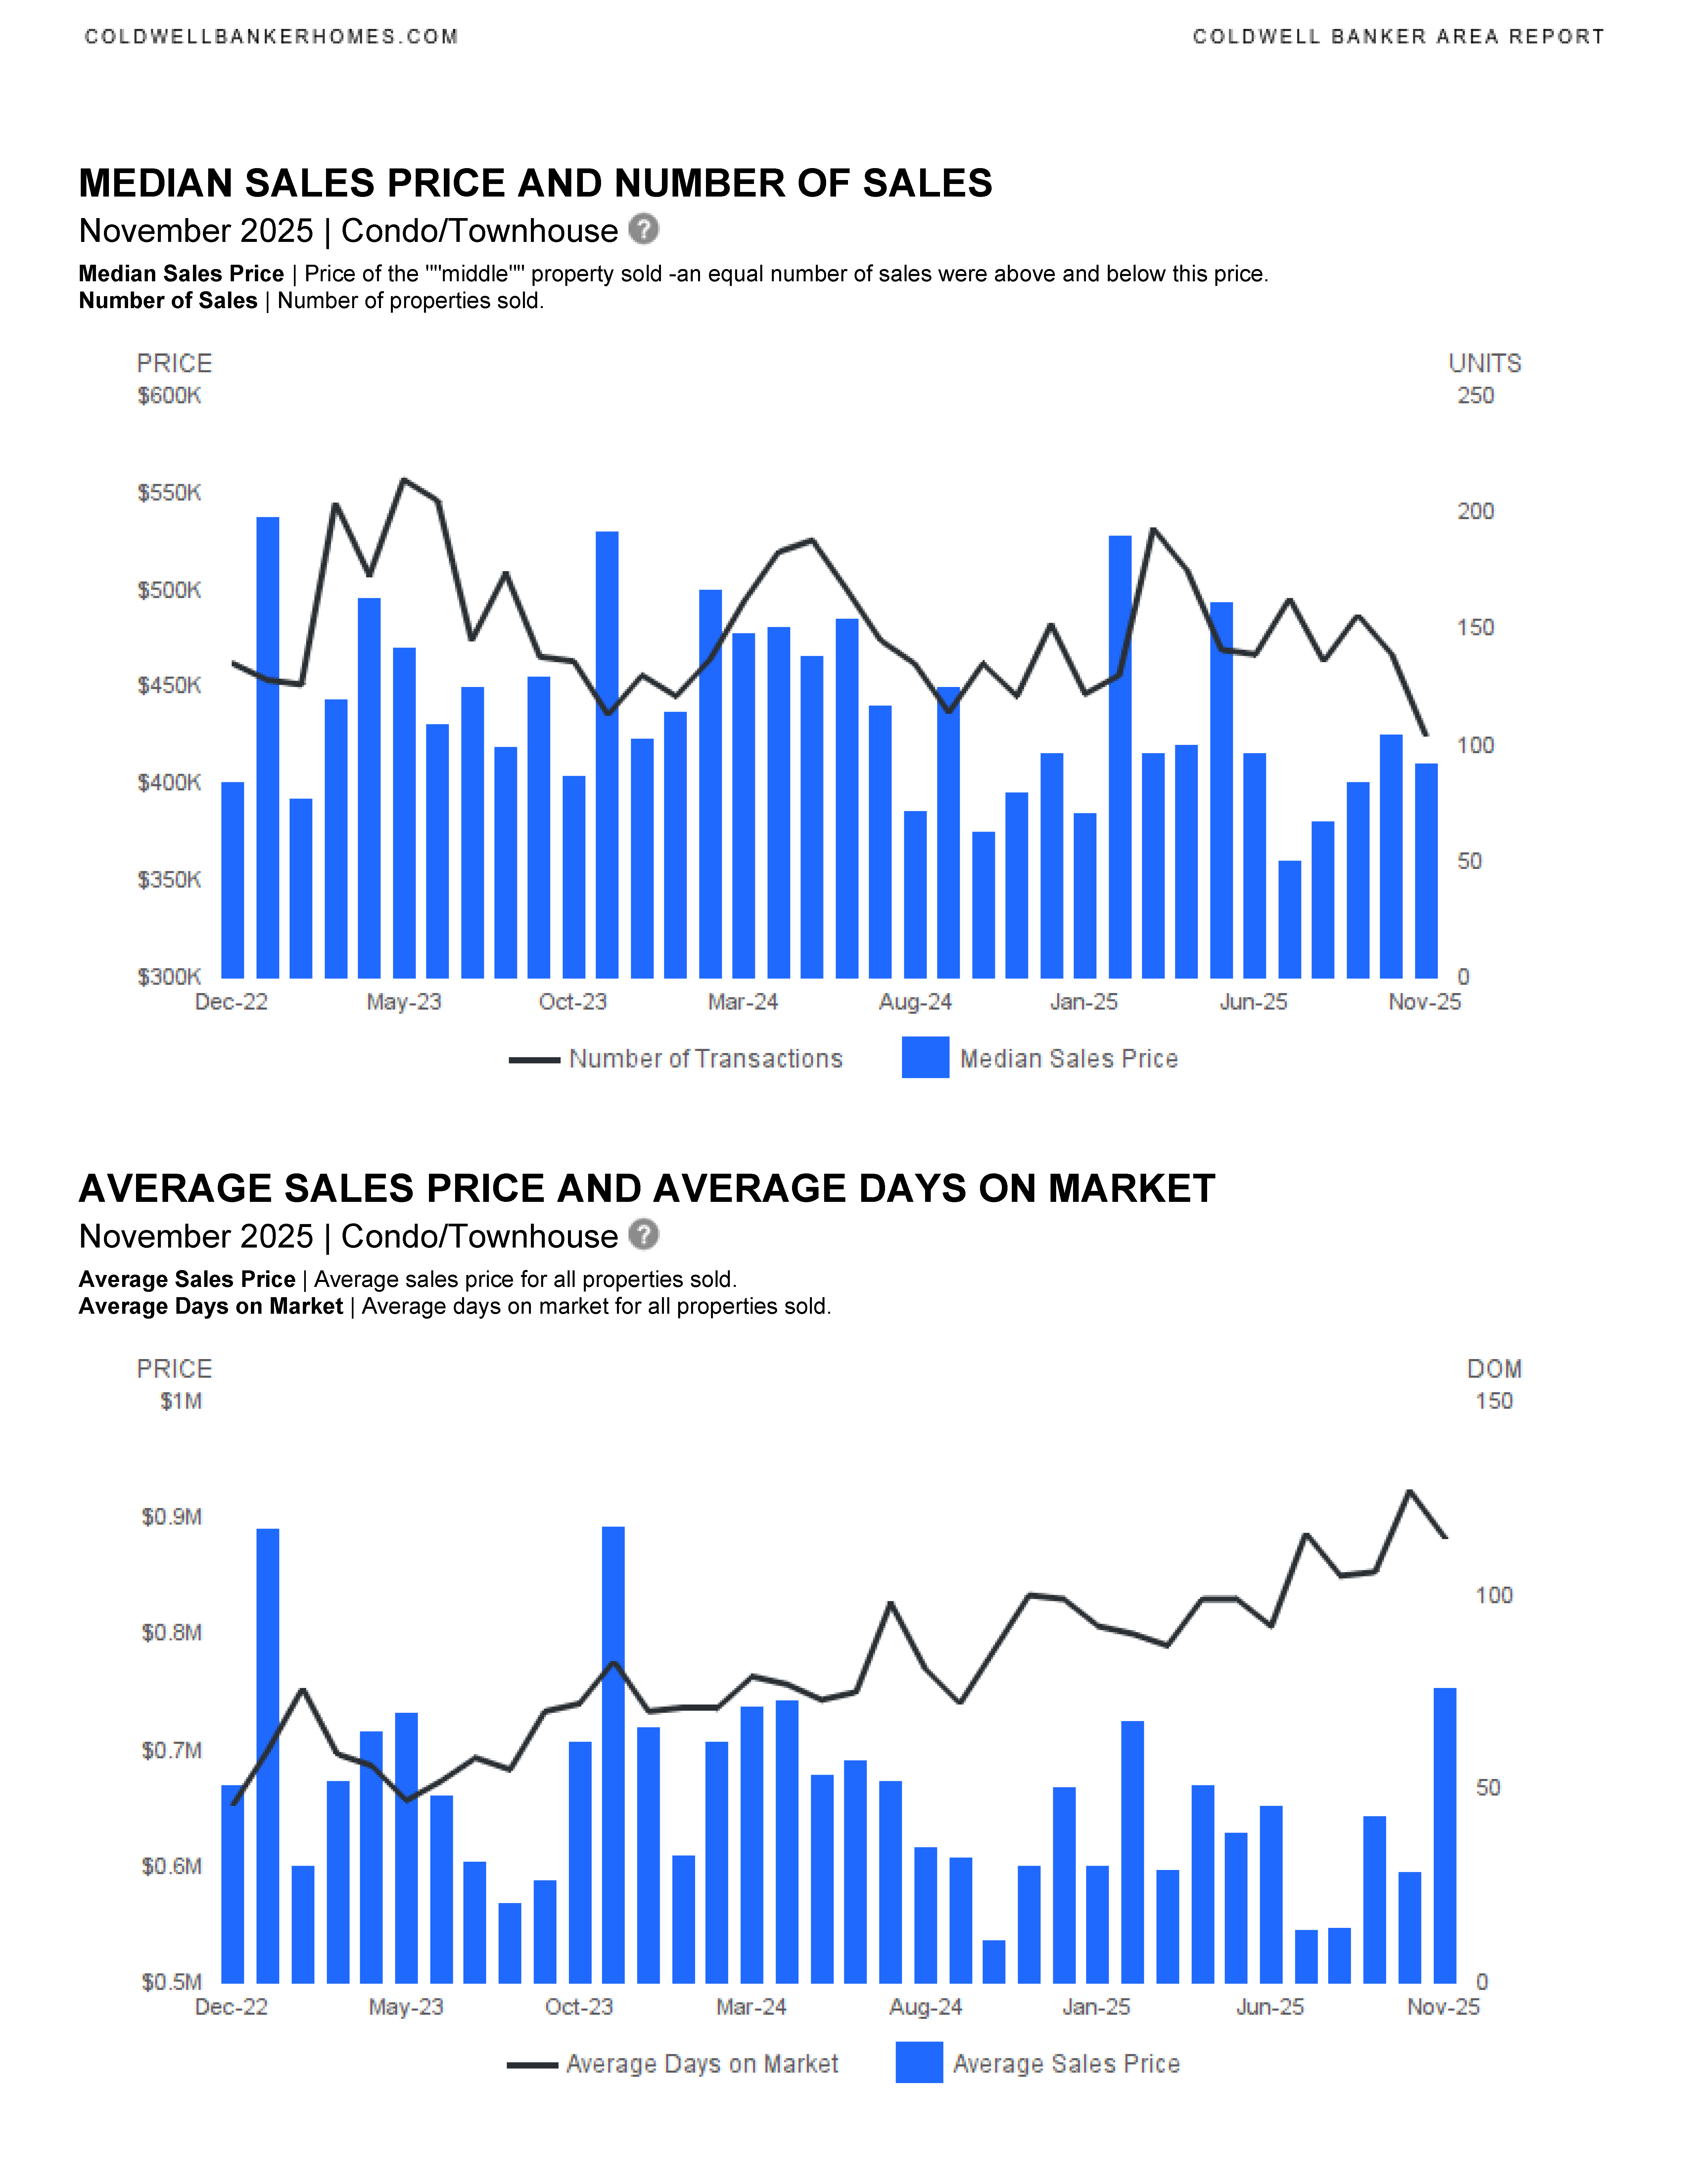
- Median Sold Price: $410,000 (↑3.8% YoY)
- Average Sold Price: $752,766 (↑25.4% YoY)
- Median Days on Market: 87 (↑13% YoY)
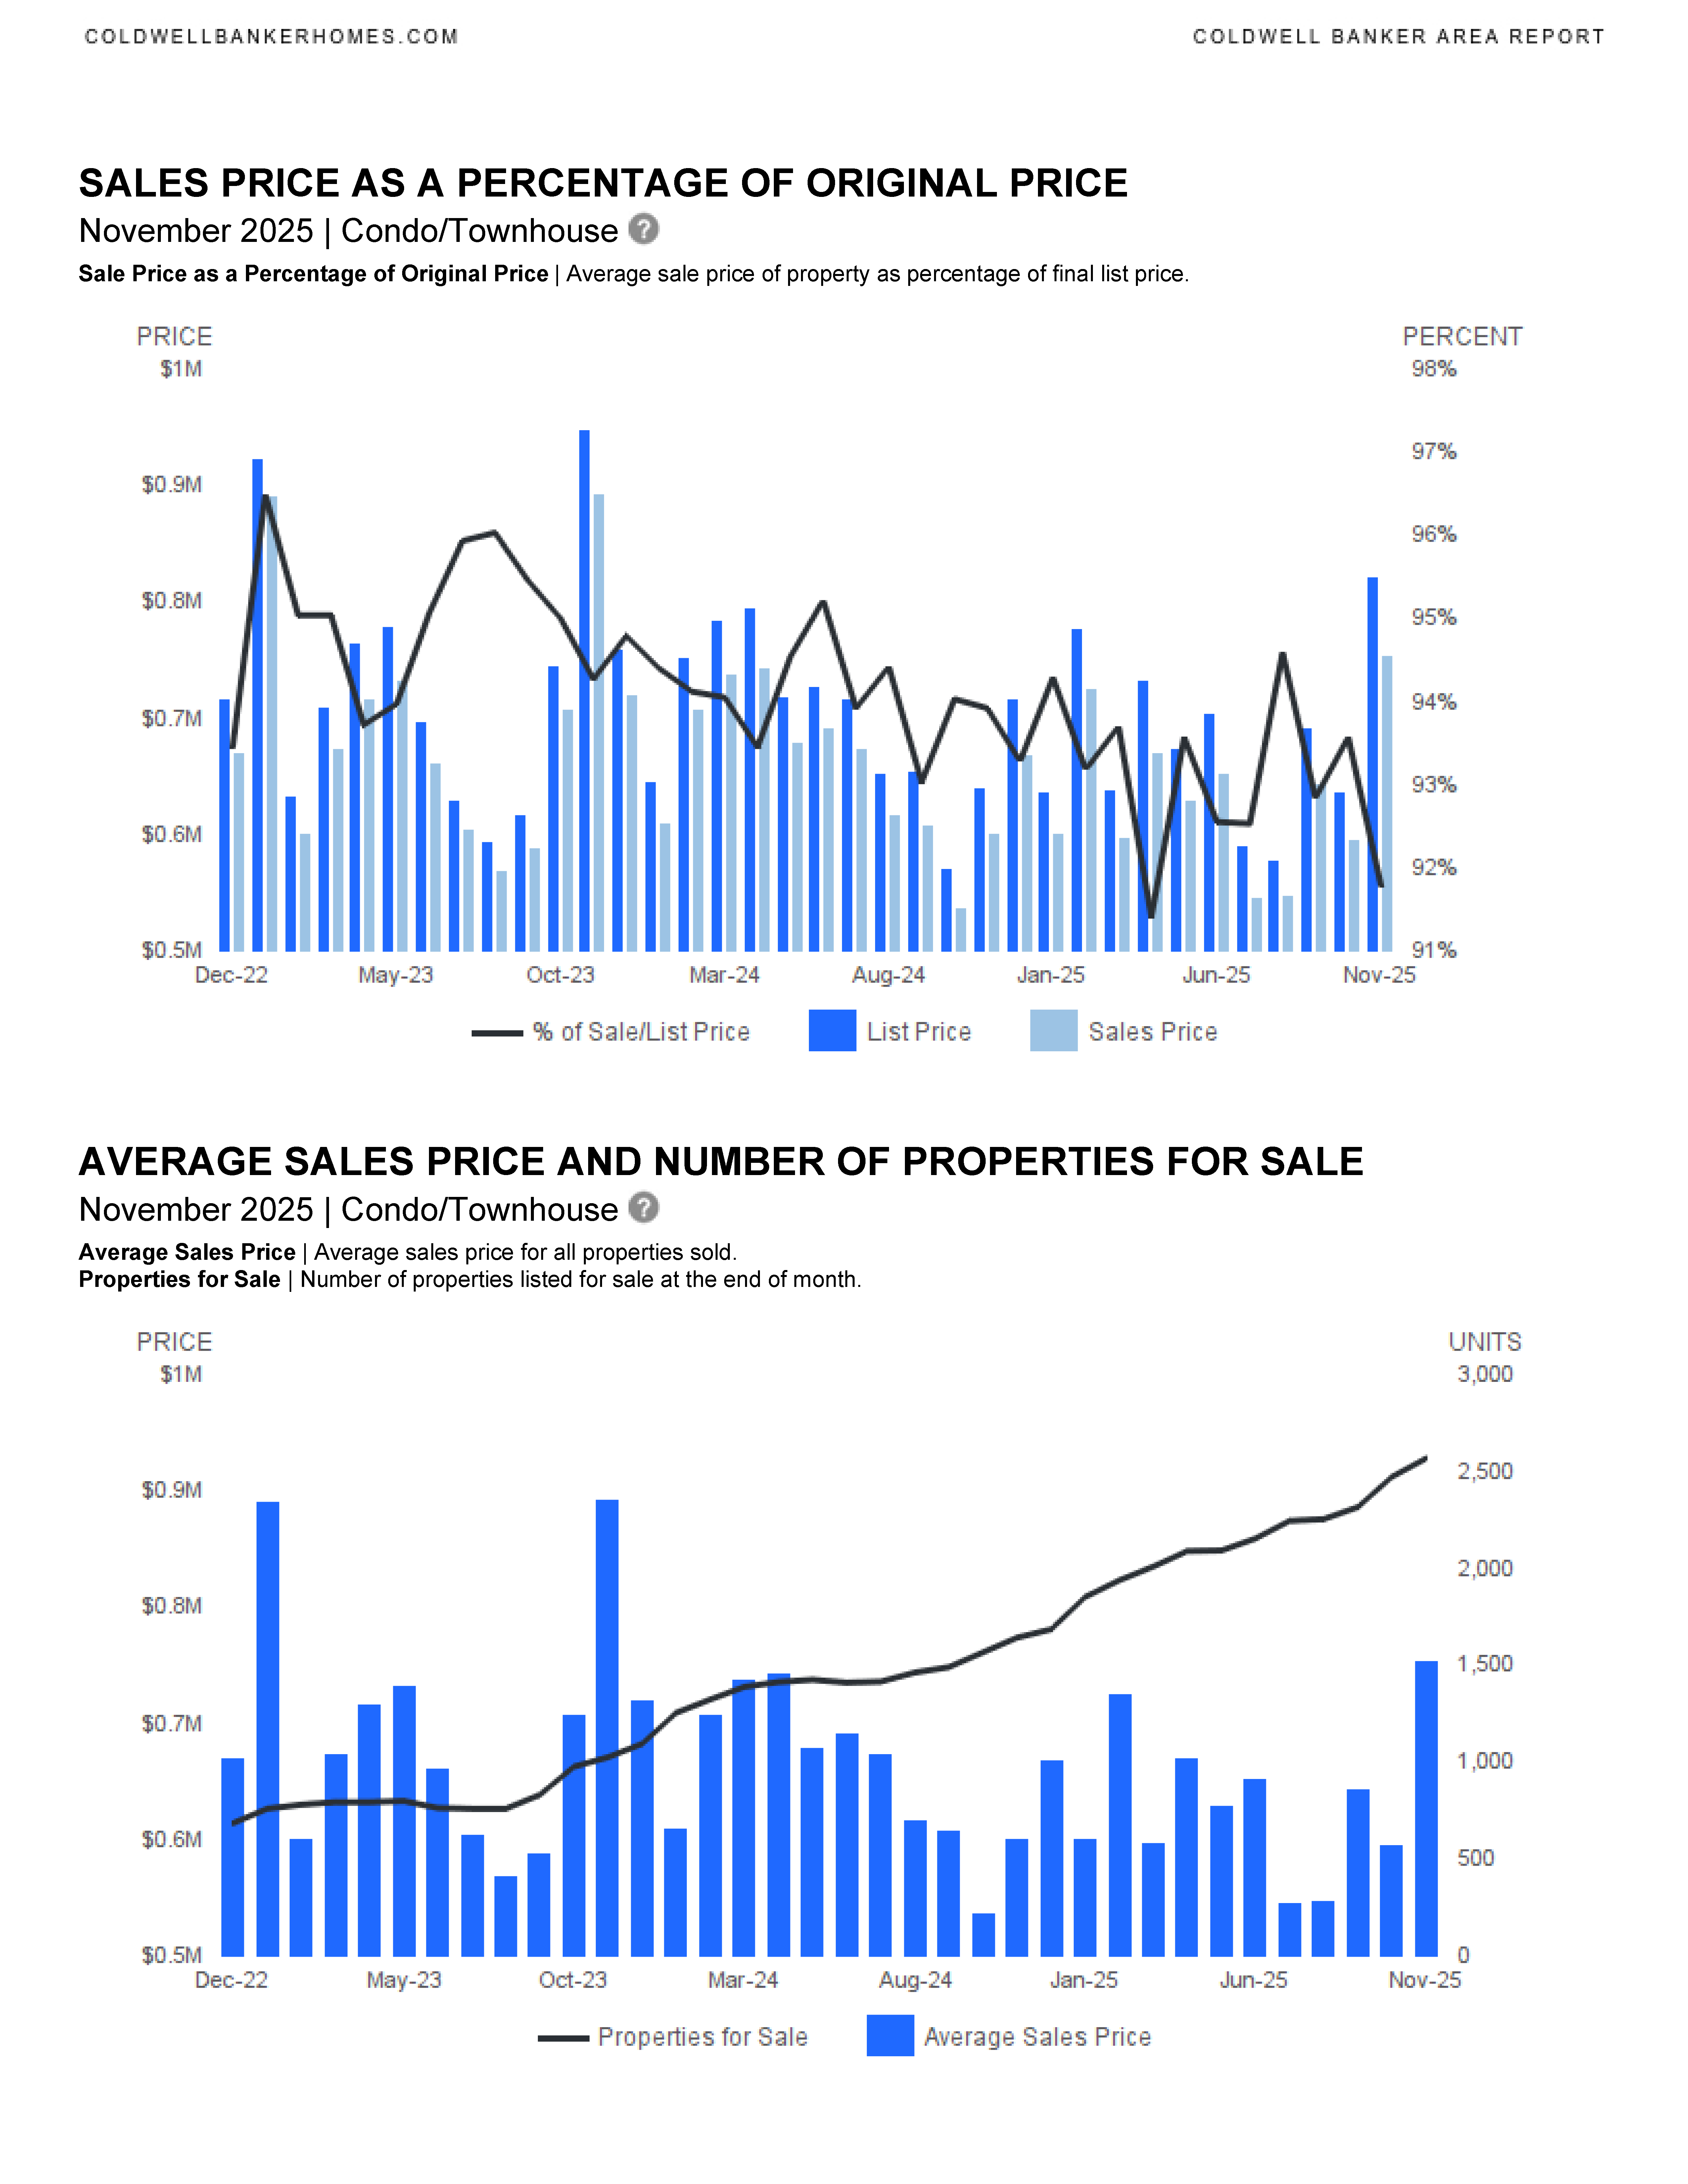
- List/Sold Price Ratio: 94.4% (slightly up)
- Year-to-Date: Sales nearly flat, prices mixed (median ↓7.8%, average ↓5.1%).
Key Trend: Sharp drop in new listings, slower sales pace, but luxury segment drove average prices higher.
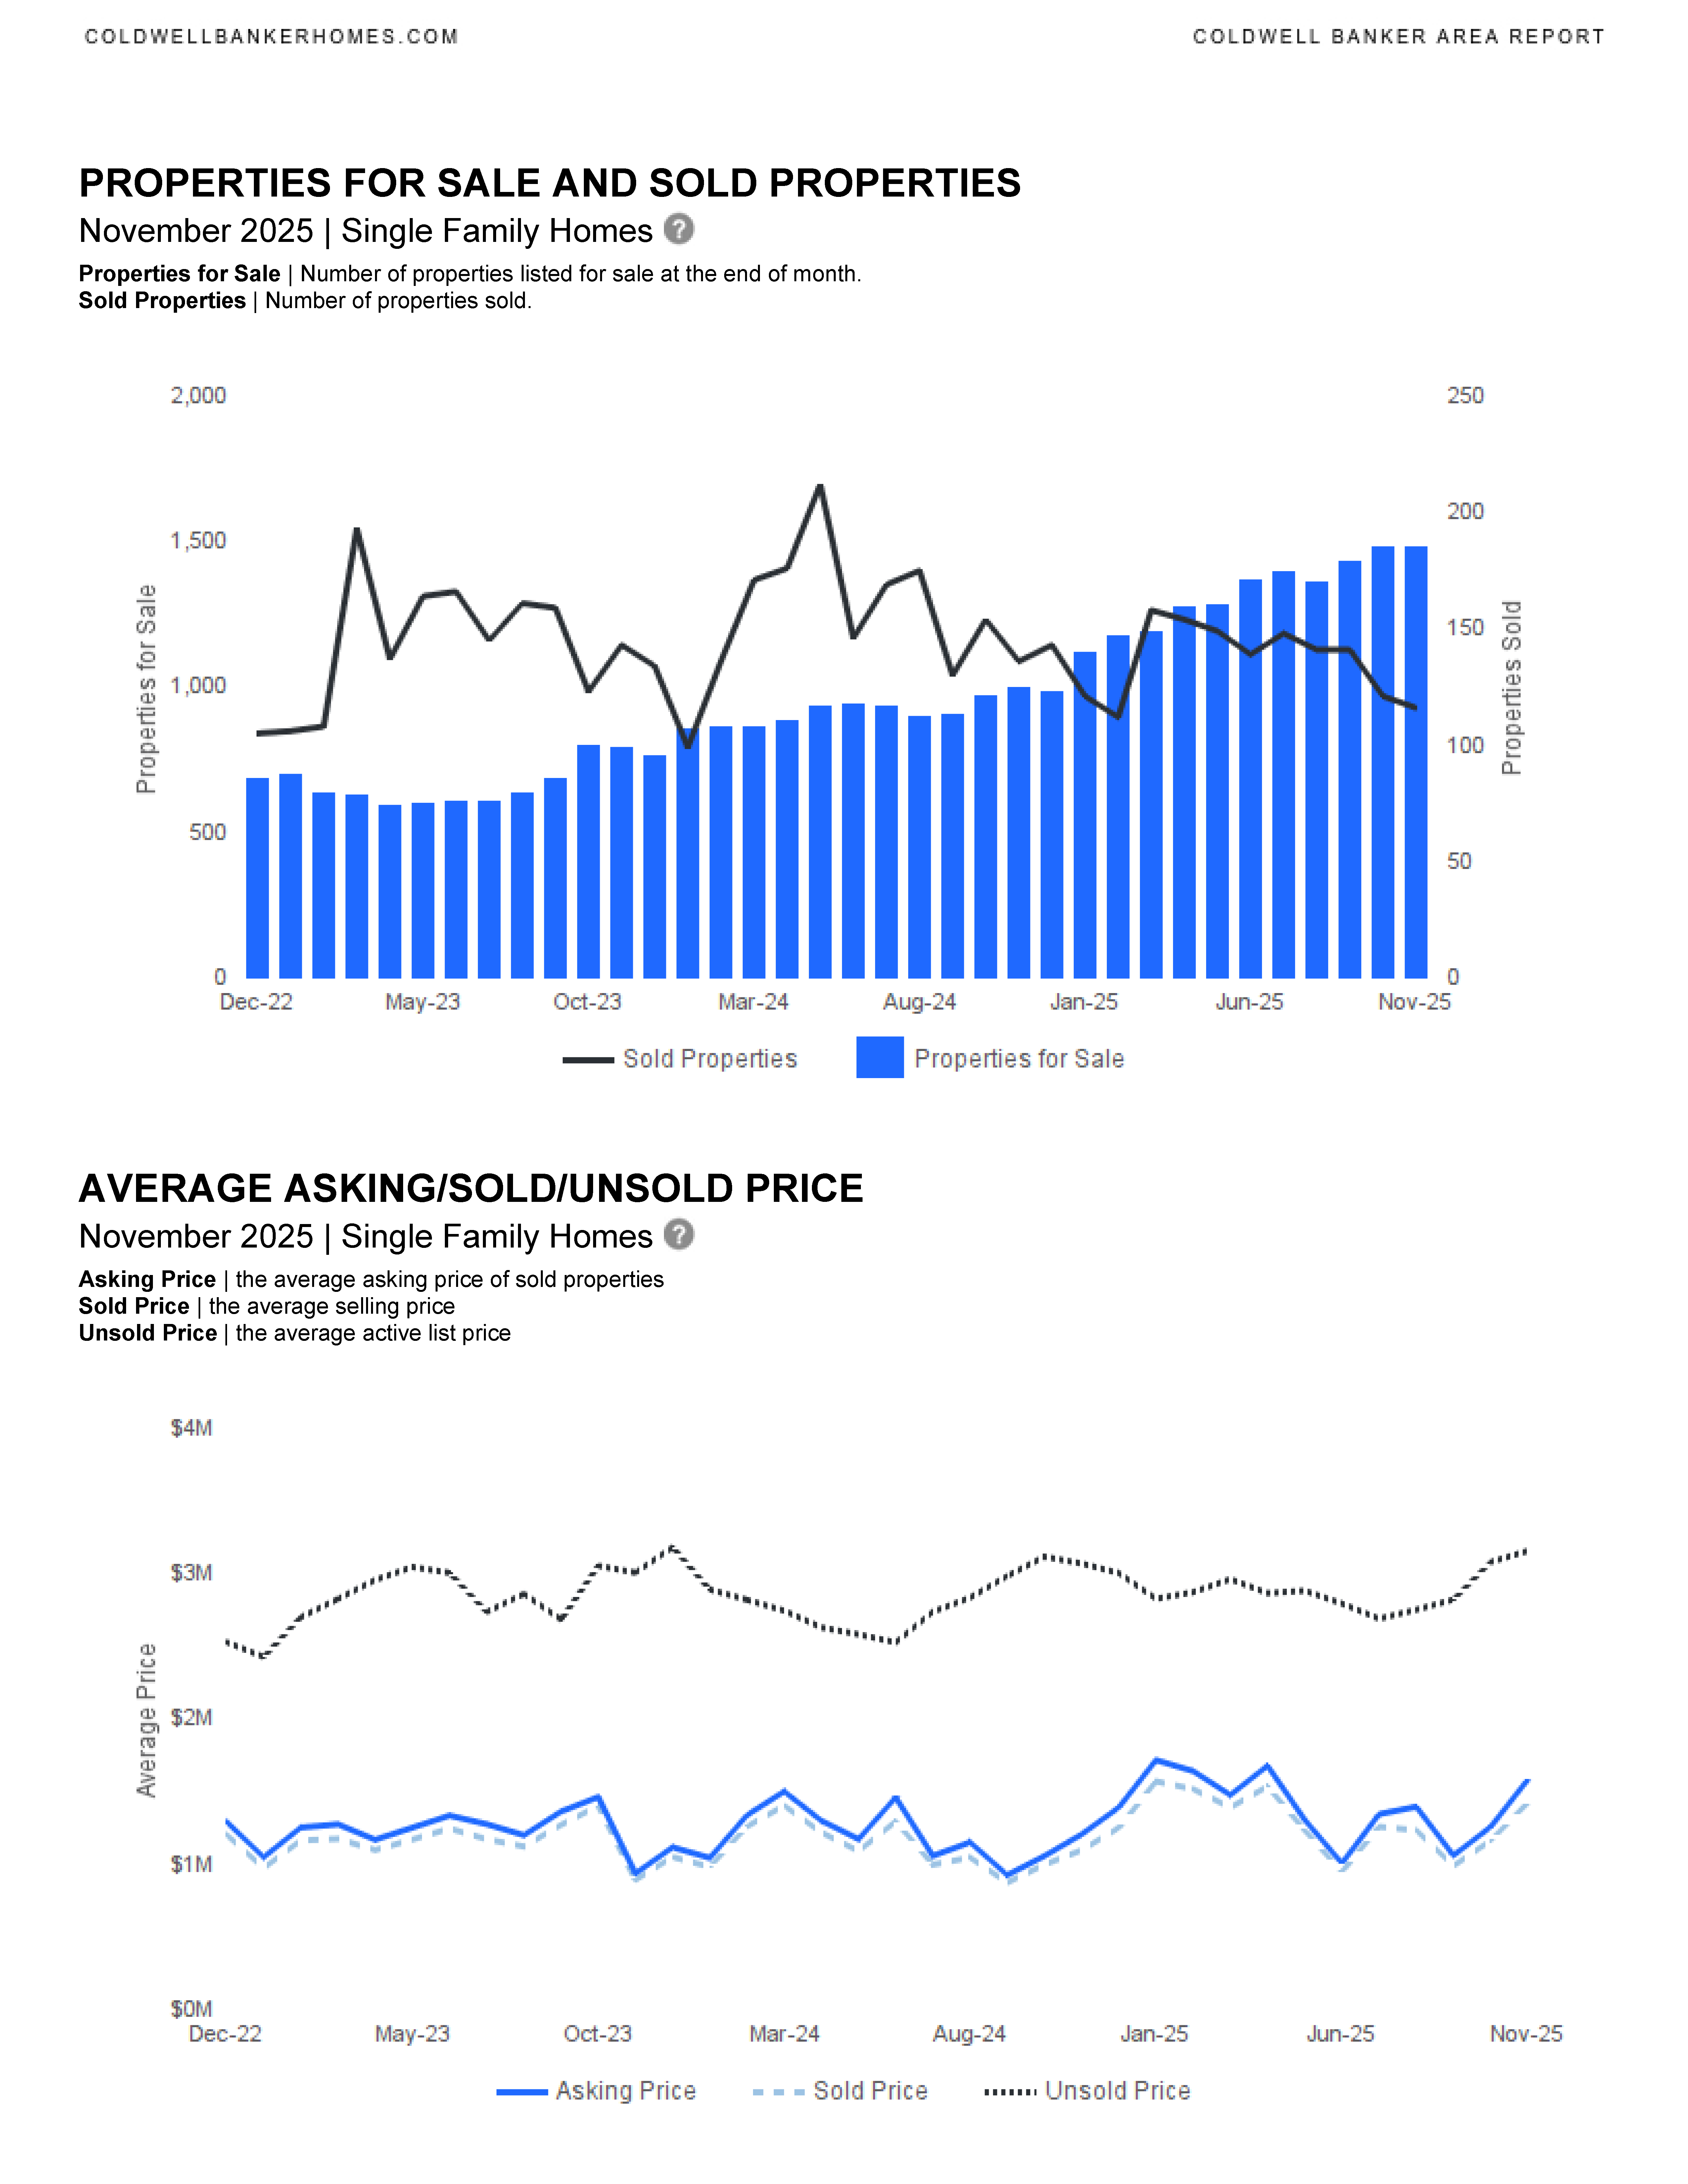
📊Overall Market Insights
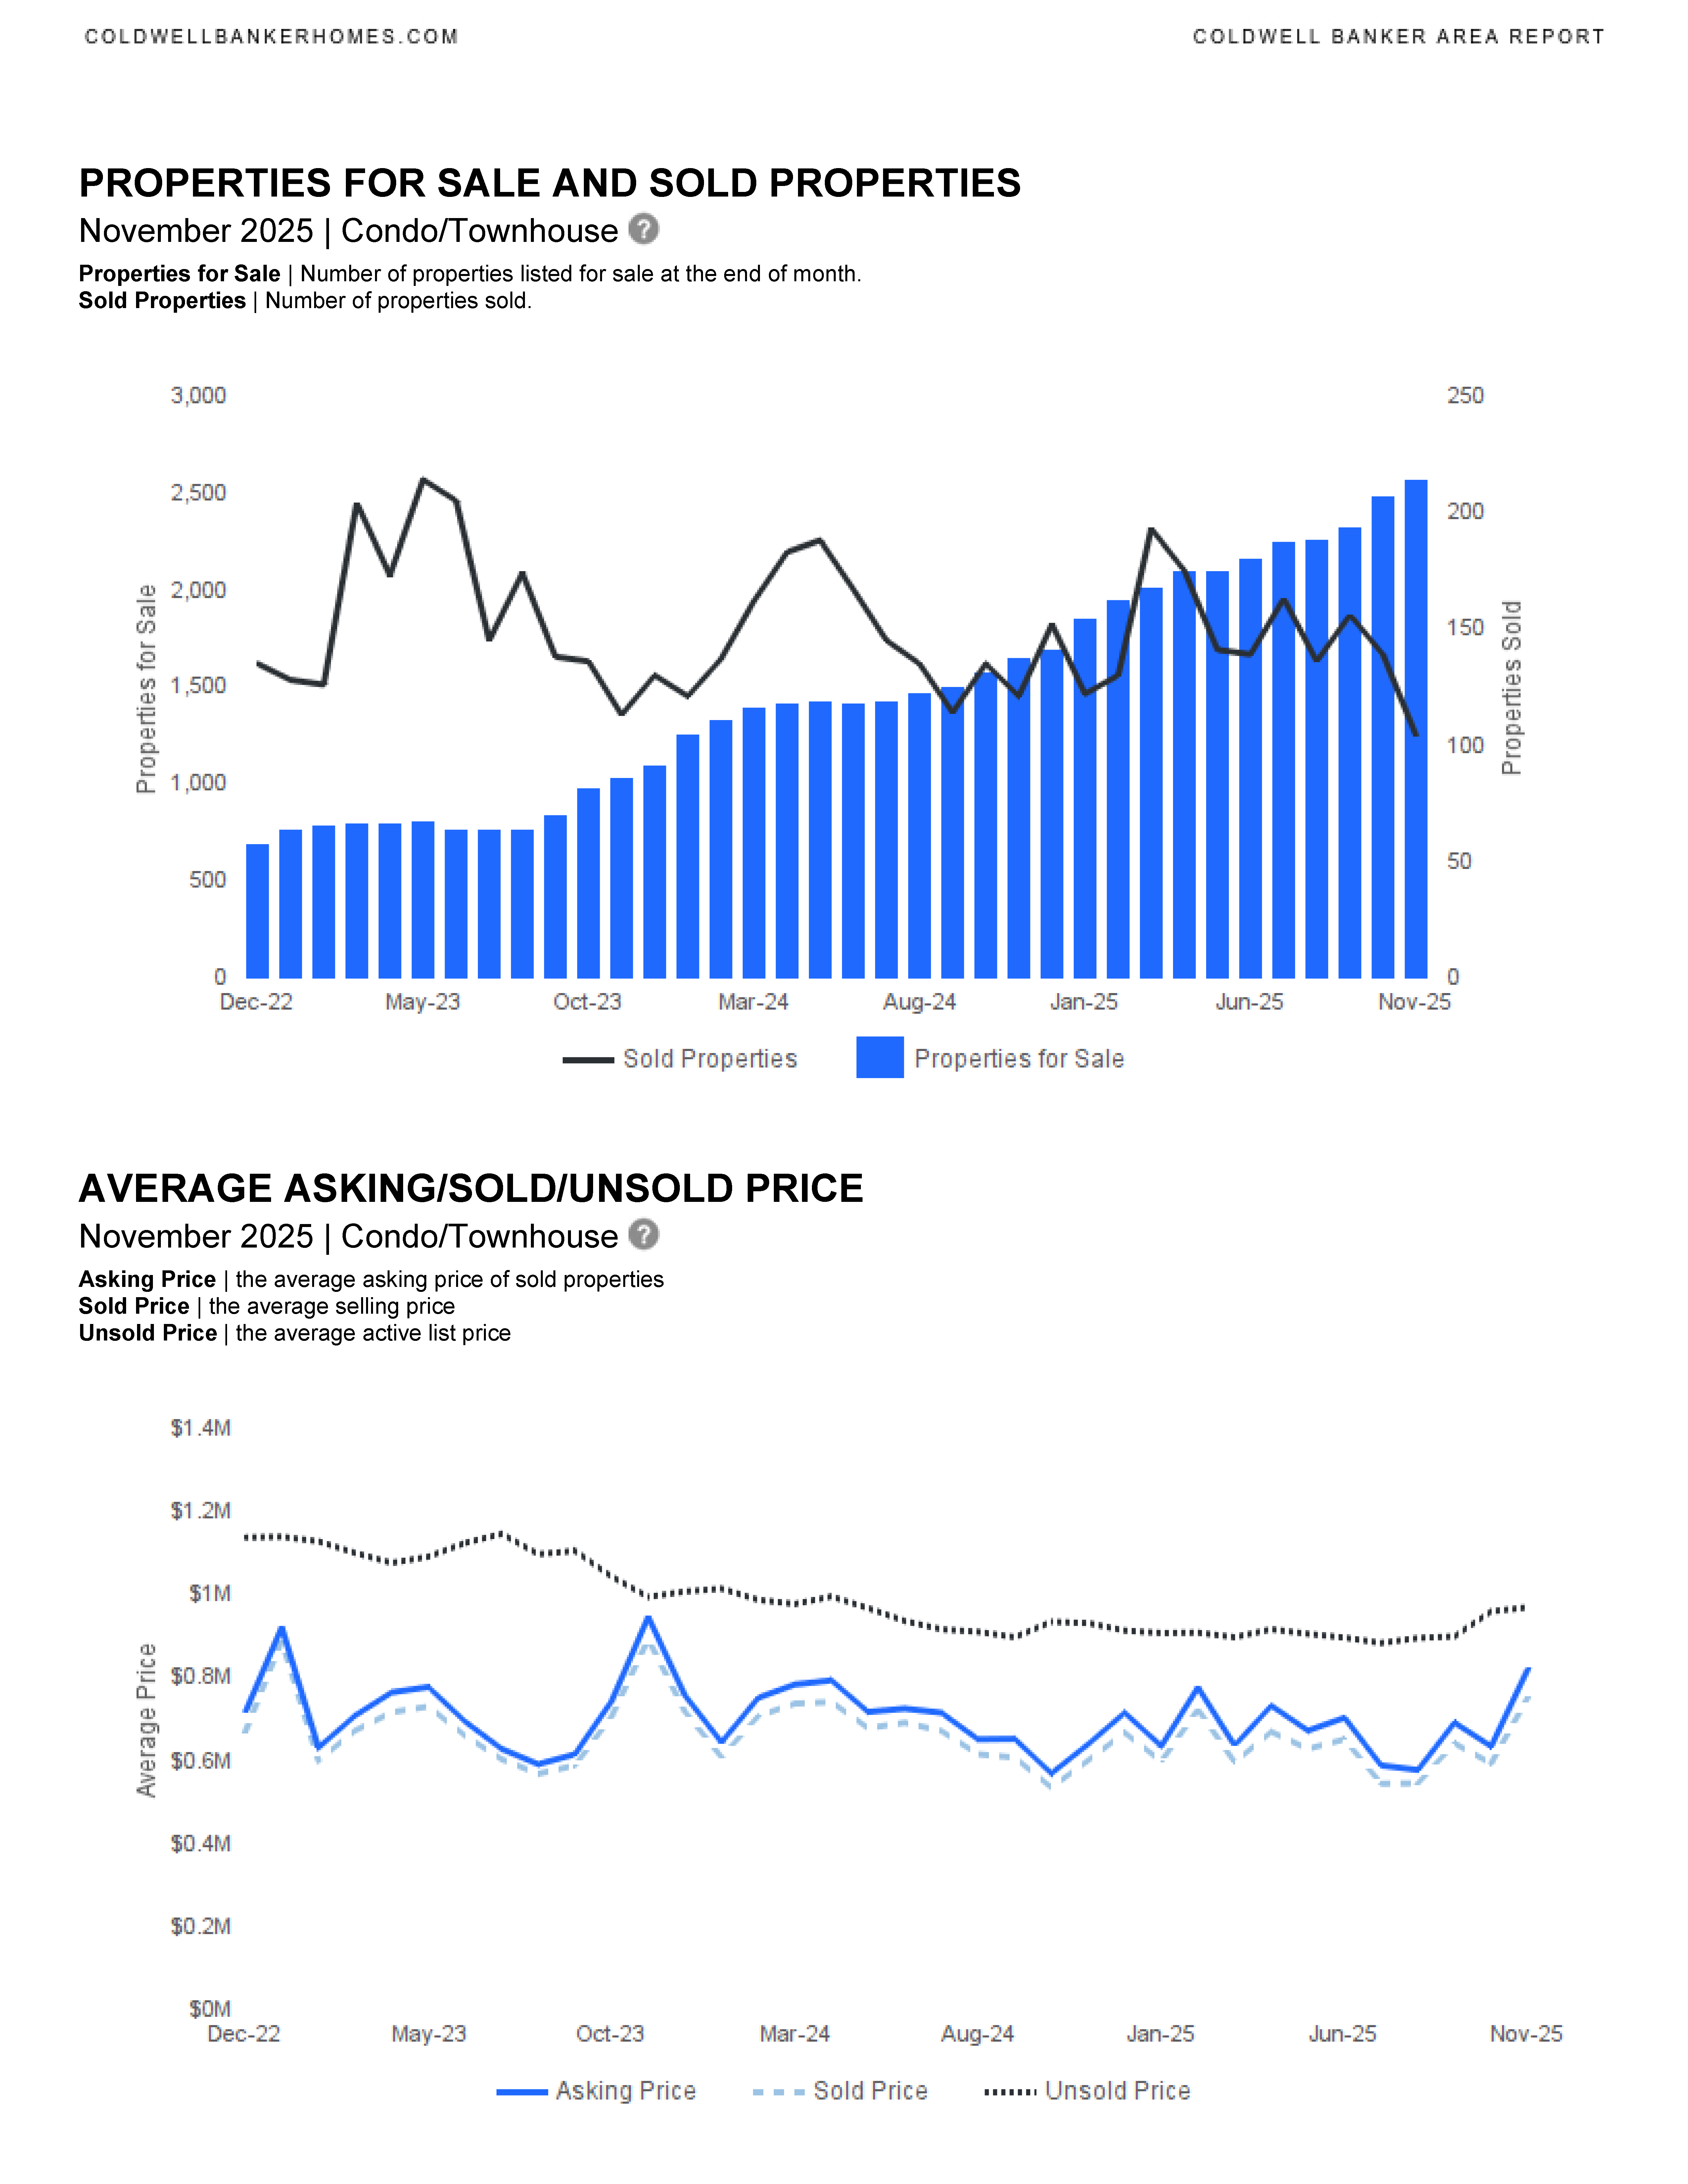
- Inventory is tightening, with fewer new listings and longer days on market.
- Price growth is strong, especially in higher-end properties.
- Sellers still achieve ~94–96% of asking price, indicating stable demand despite slower sales.


We are in a new housing market in SE Florida. This is the time to work with an experienced and knowledgeable real estate professional. Please contact me if you would like to be sent updated market reports for YOUR specific neighborhood, Fort Lauderdale, or another SE Florida city. We can discuss the market, current trends and how we can work together to accomplish your real estate goals. I am here to help.
CONTACT ANNETTE
Let’s start working together!
Annette Dammeyer, REALTOR®, ABR®, AHWD®
Coldwell Banker Realty
901 E Las Olas Blvd STE 101, Fort Lauderdale, FL 33301
808.747.3686
SL 3535792
Fort Lauderdale October 2025 Area Report
Fort Lauderdale October 2025 real estate statistics have been published.
Fort Lauderdale Area Reports
Single Family Homes
Condominium & Townhouses
Fort Lauderdale Real Estate Market Summary – October 2025
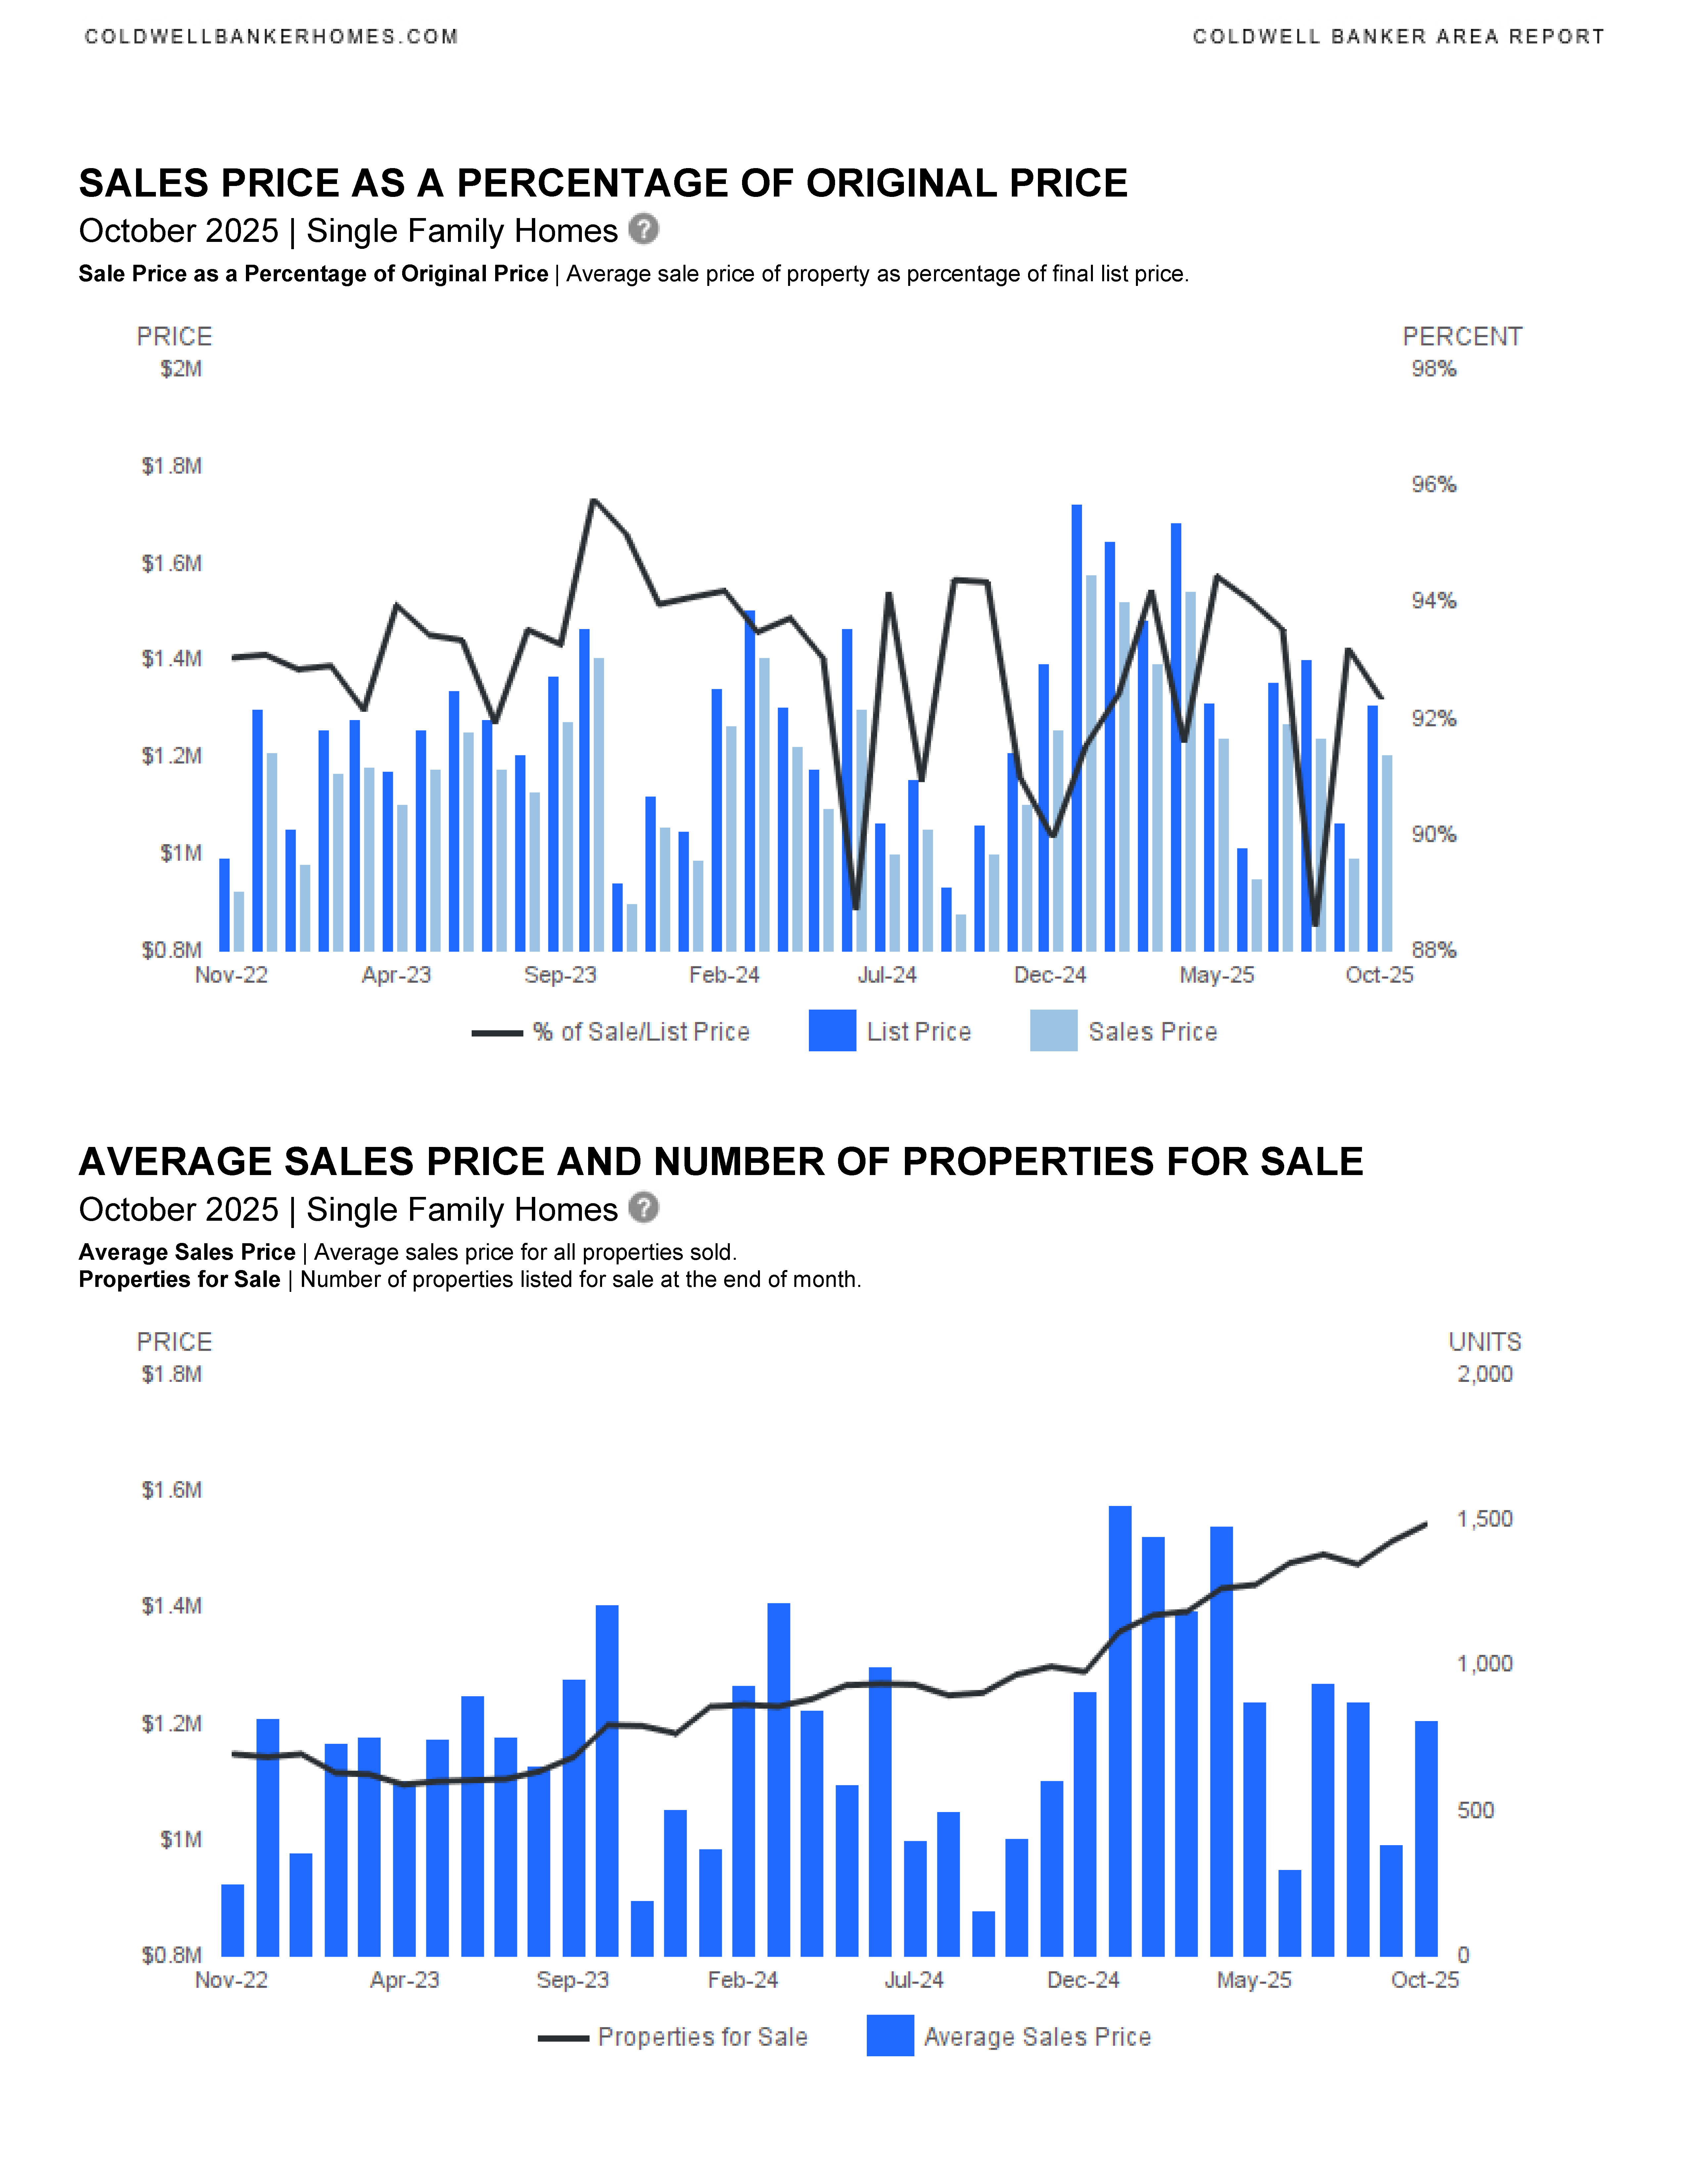
🏡 Single Family Homes – October 2025 Highlights
Monthly Changes (vs. October 2024):
- New Listings: 321 (⬇️ 18.9%)
- Sold Listings: 113 (⬇️ 26.6%)
- Median List Price (Solds): $630,000 (⬆️ 0.8%)
- Median Sold Price: $610,000 (⬇️ 0.4%)
- Average Sold Price: $1,203,546 (⬆️ 20.6%)
- Average Days on Market: 83 days (⬆️ 3.75%)
- List-to-Sale Price Ratio: 95% (slightly down)
Year-to-Date (YTD) Changes:
- New Listings: 3,499 (⬇️ 5.6%)
- Sold Listings: 1,375 (⬇️ 12.3%)
- Median Sold Price: $635,000 (⬆️ 9%)
- Average Sold Price: $1,285,511 (⬆️ 14.3%)
- Average Days on Market: 84 days (⬆️ 25.4%)
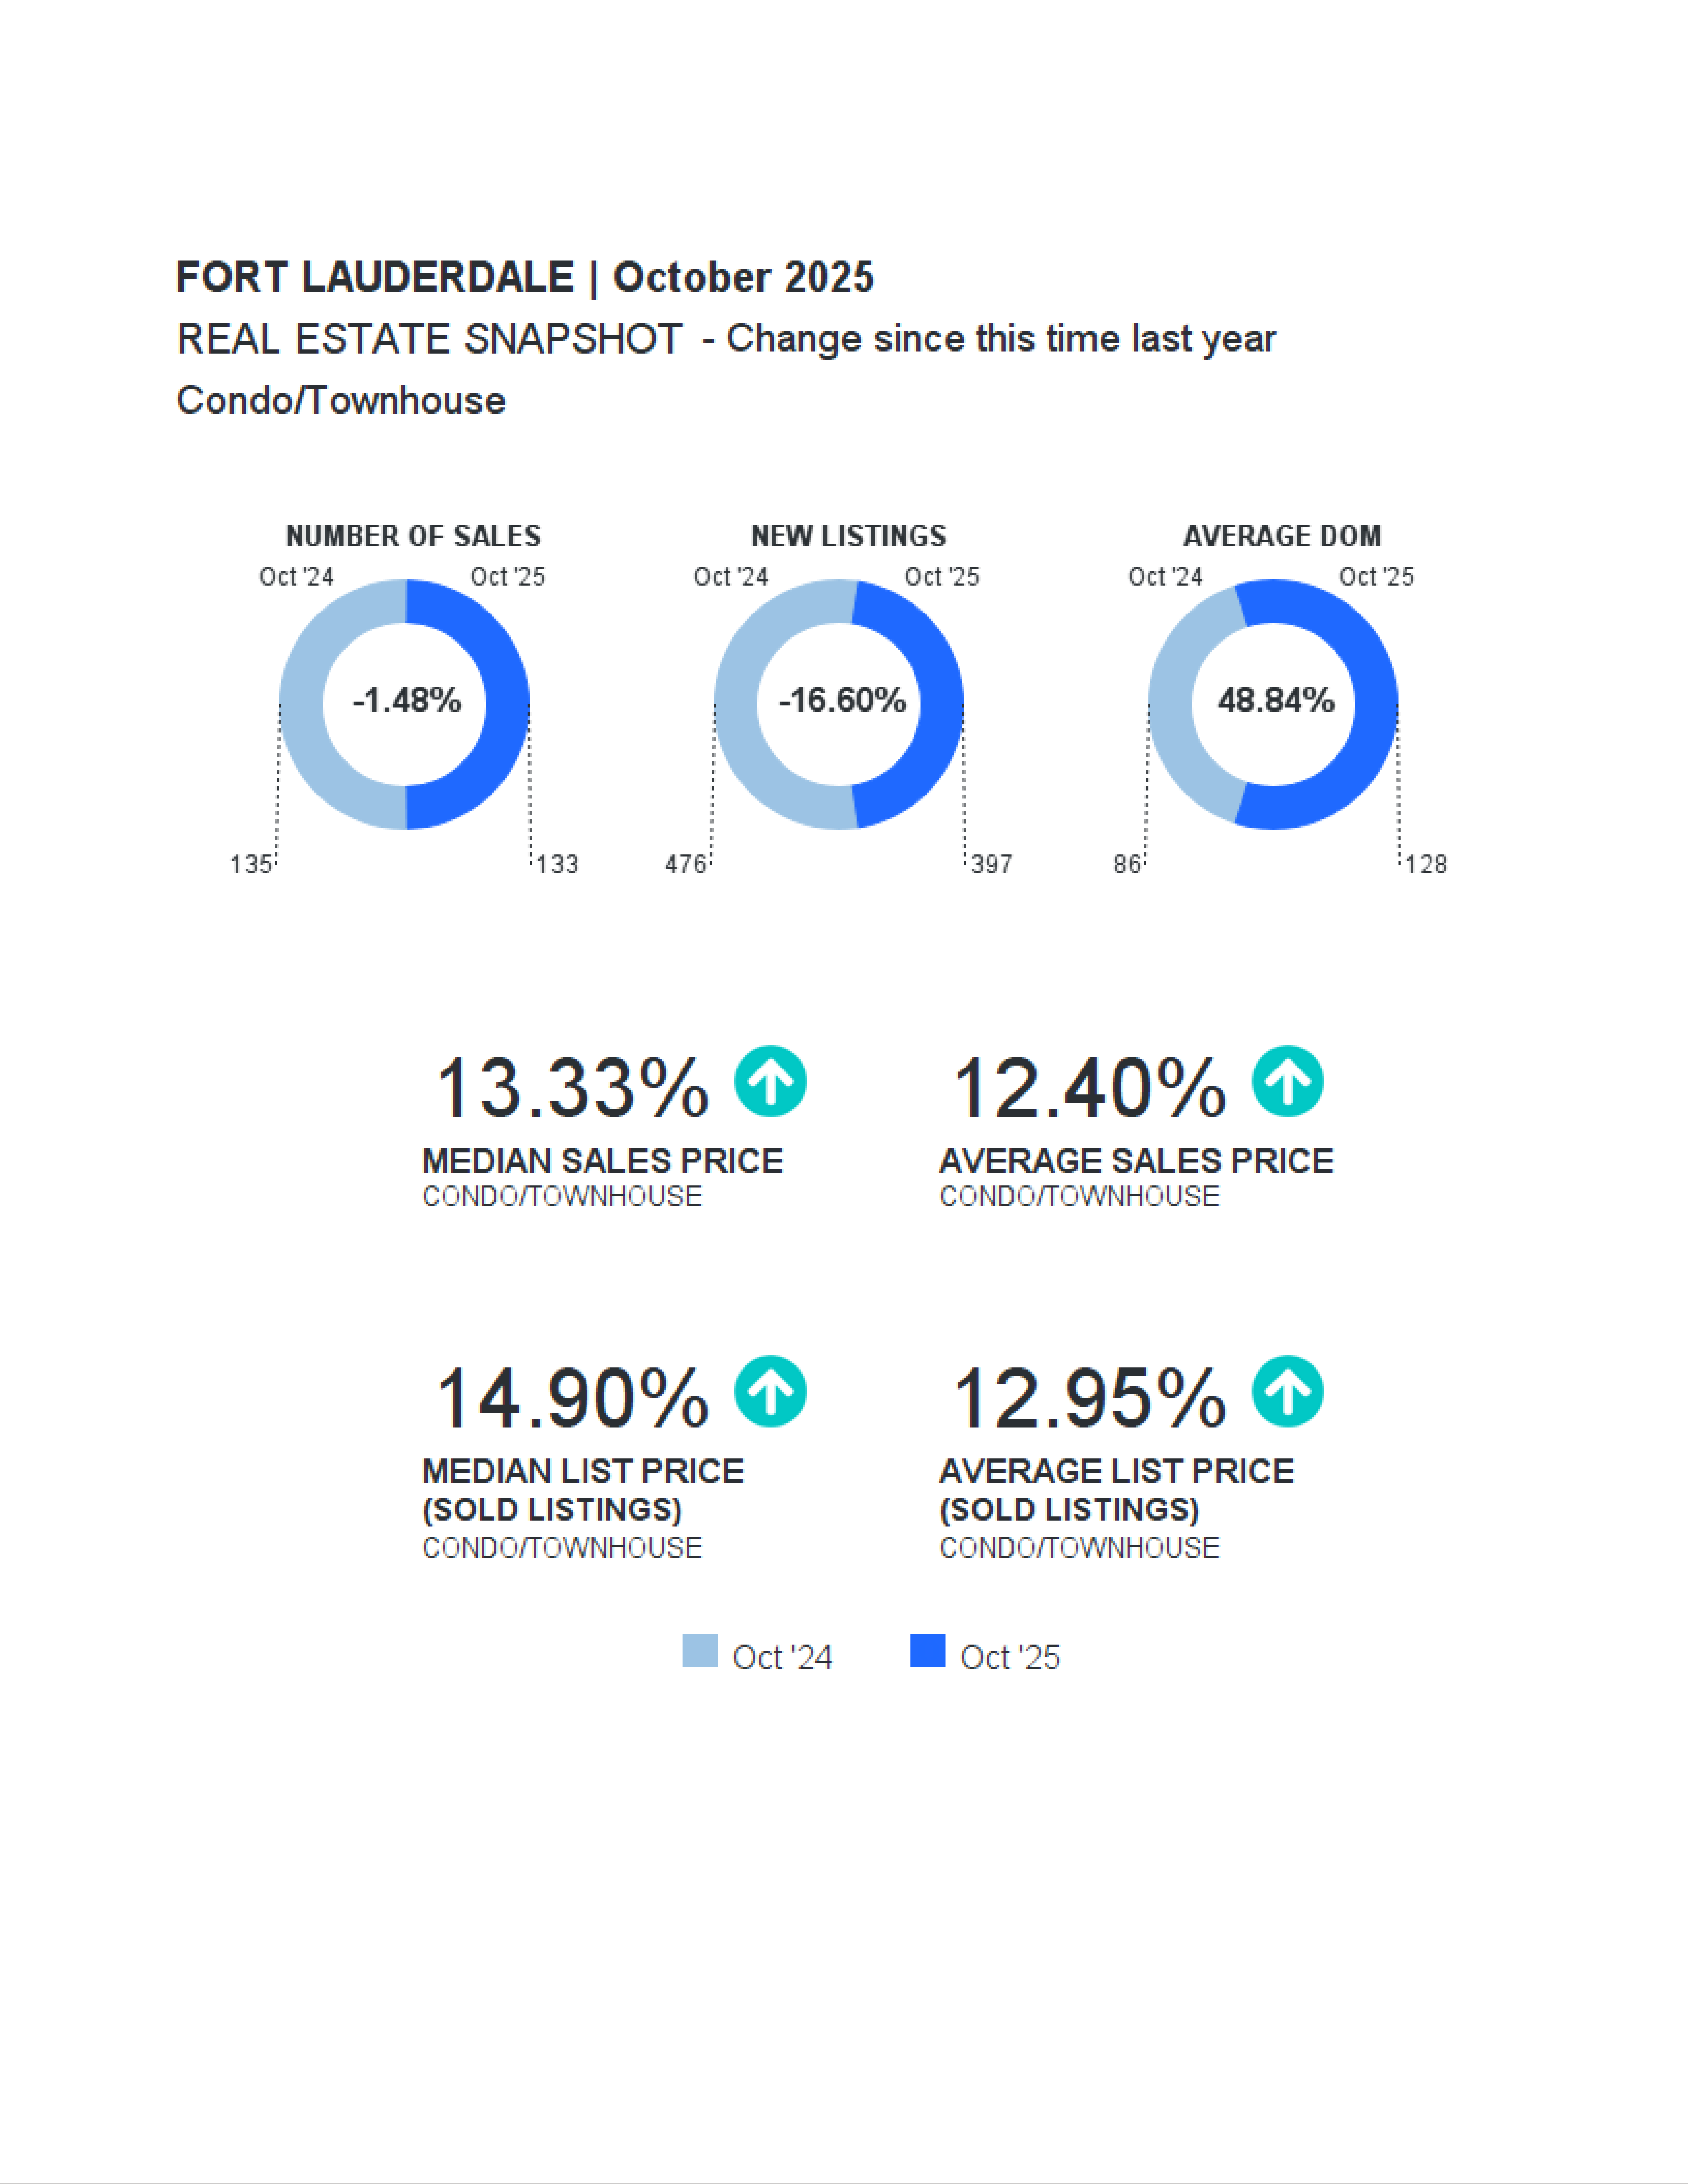
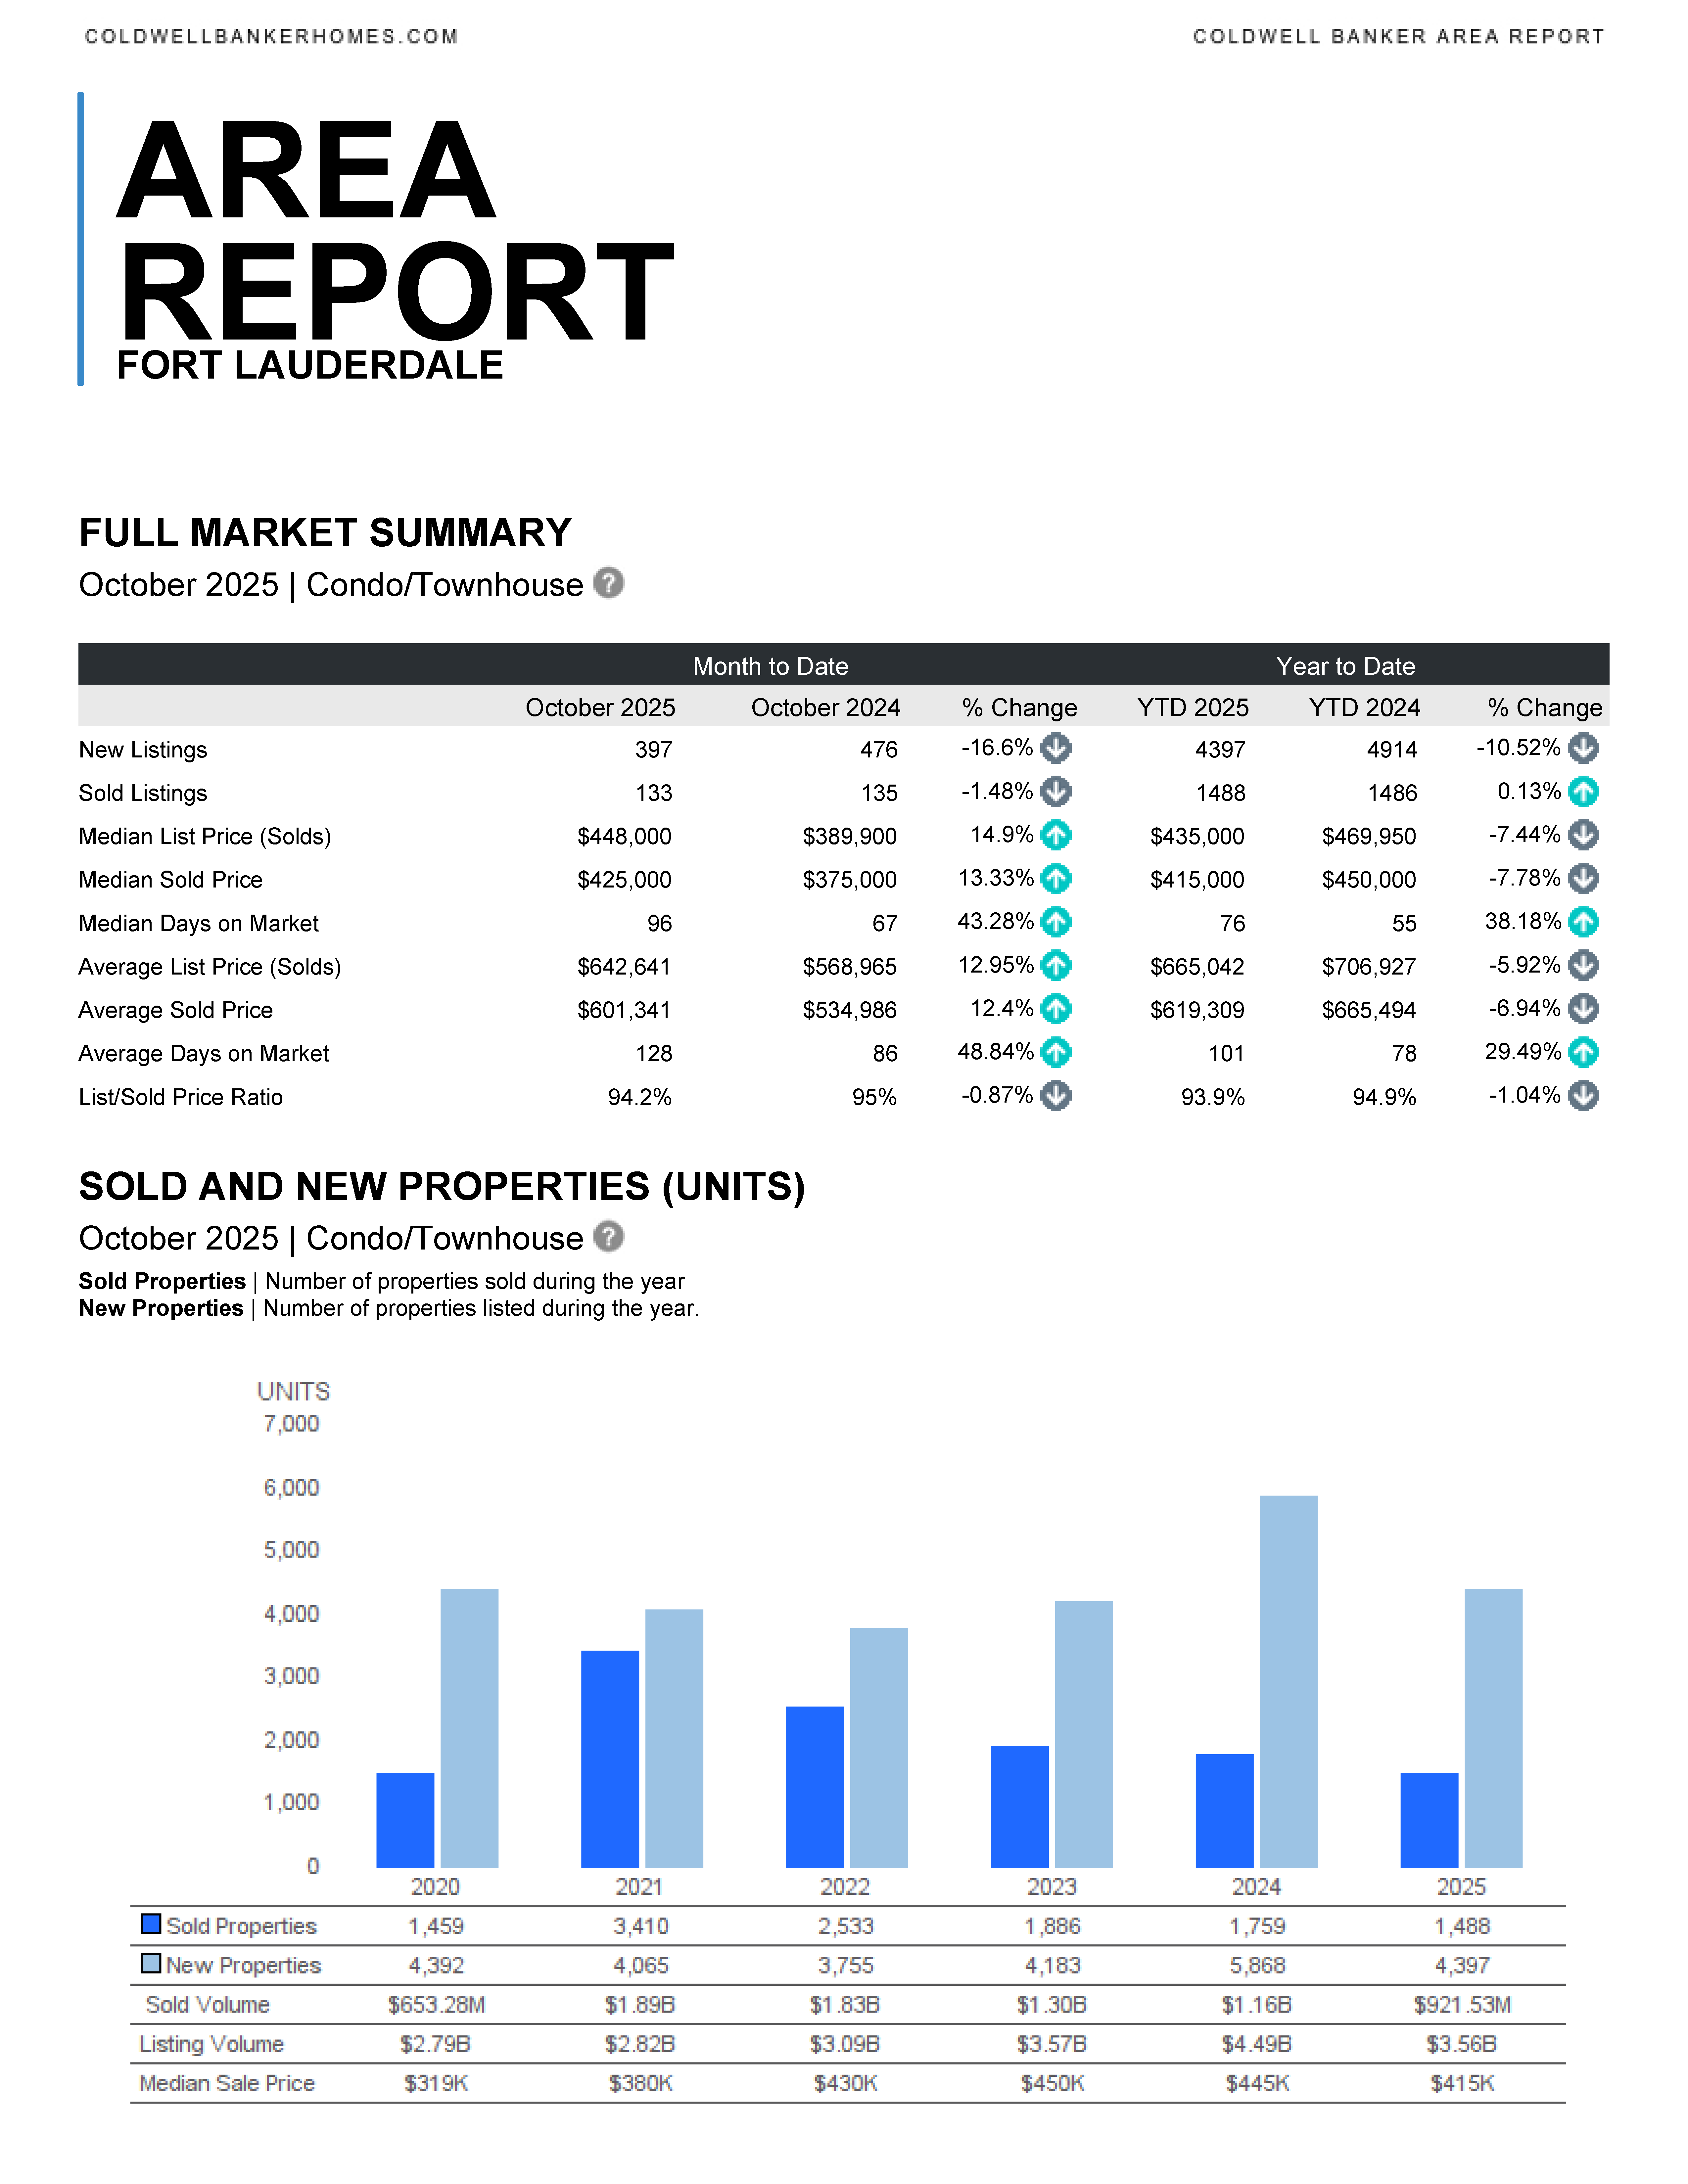
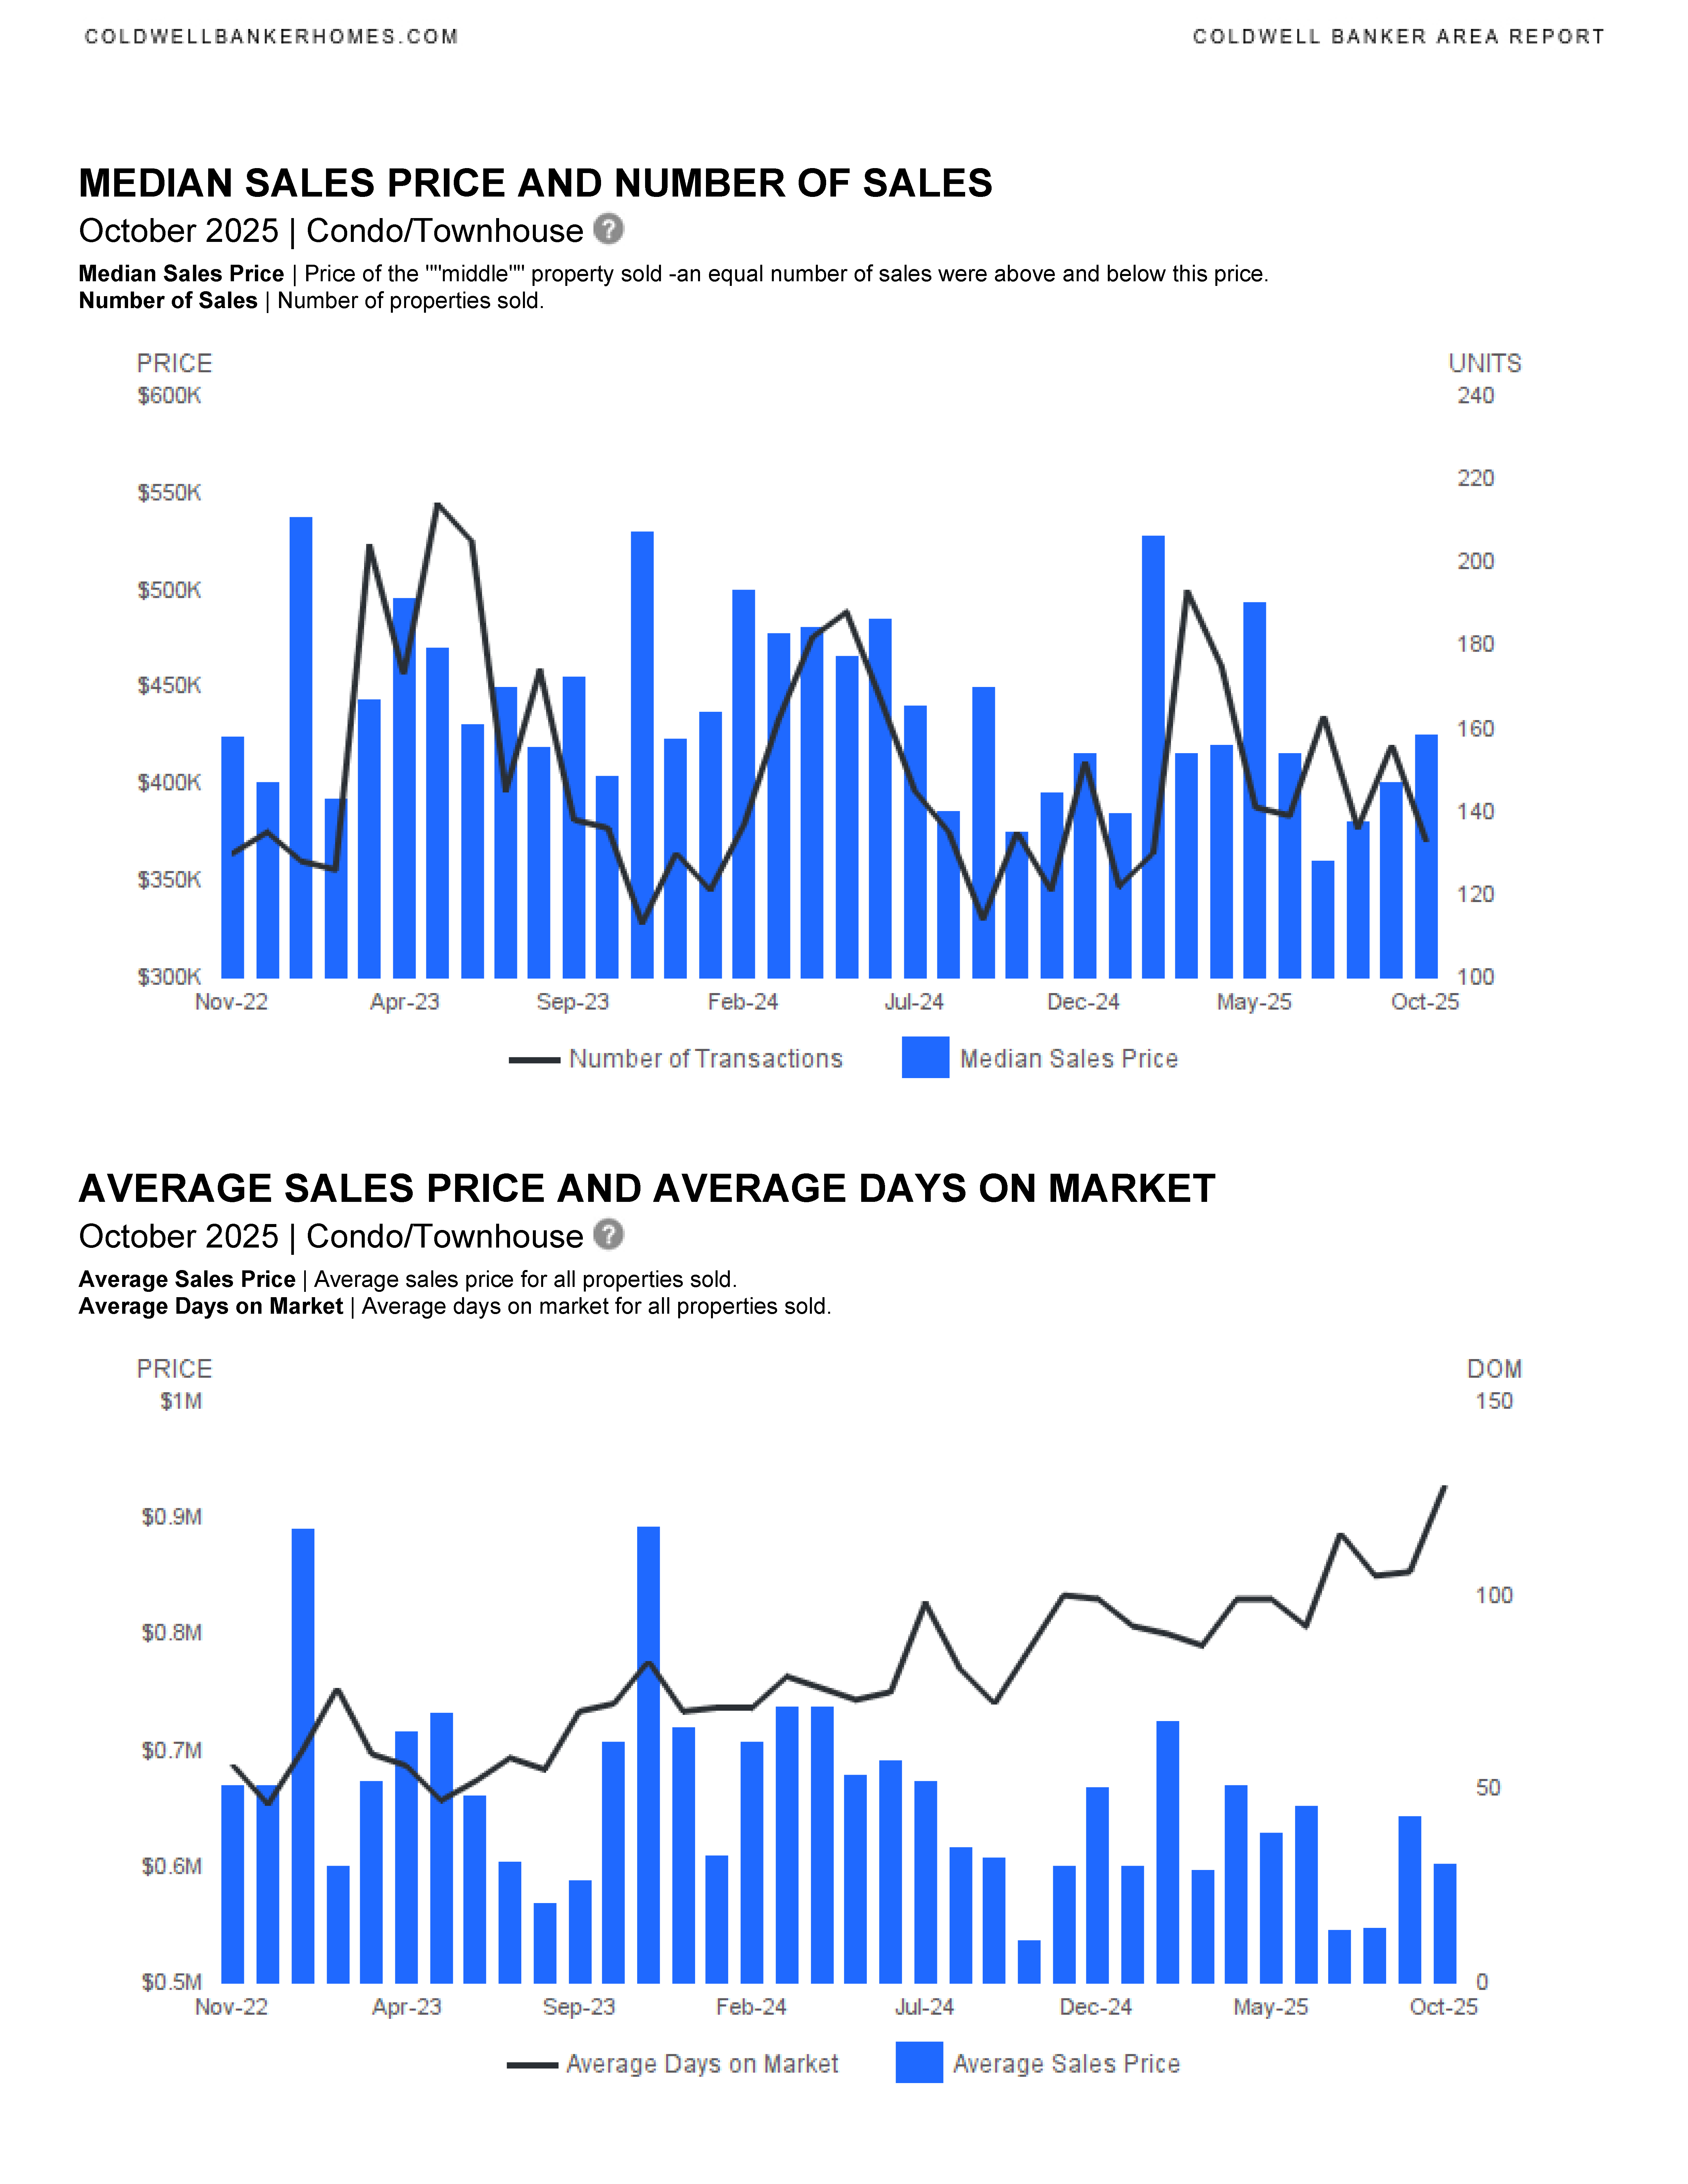
🏢 Condos & Townhomes – October 2025 Highlights
Monthly Changes (vs. October 2024):
- New Listings: 397 (⬇️ 16.6%)
- Sold Listings: 133 (⬇️ 1.5%)
- Median List Price (Solds): $448,000 (⬆️ 14.9%)
- Median Sold Price: $425,000 (⬆️ 13.3%)
- Average Sold Price: $601,341 (⬆️ 12.4%)
- Average Days on Market: 128 days (⬆️ 48.8%)
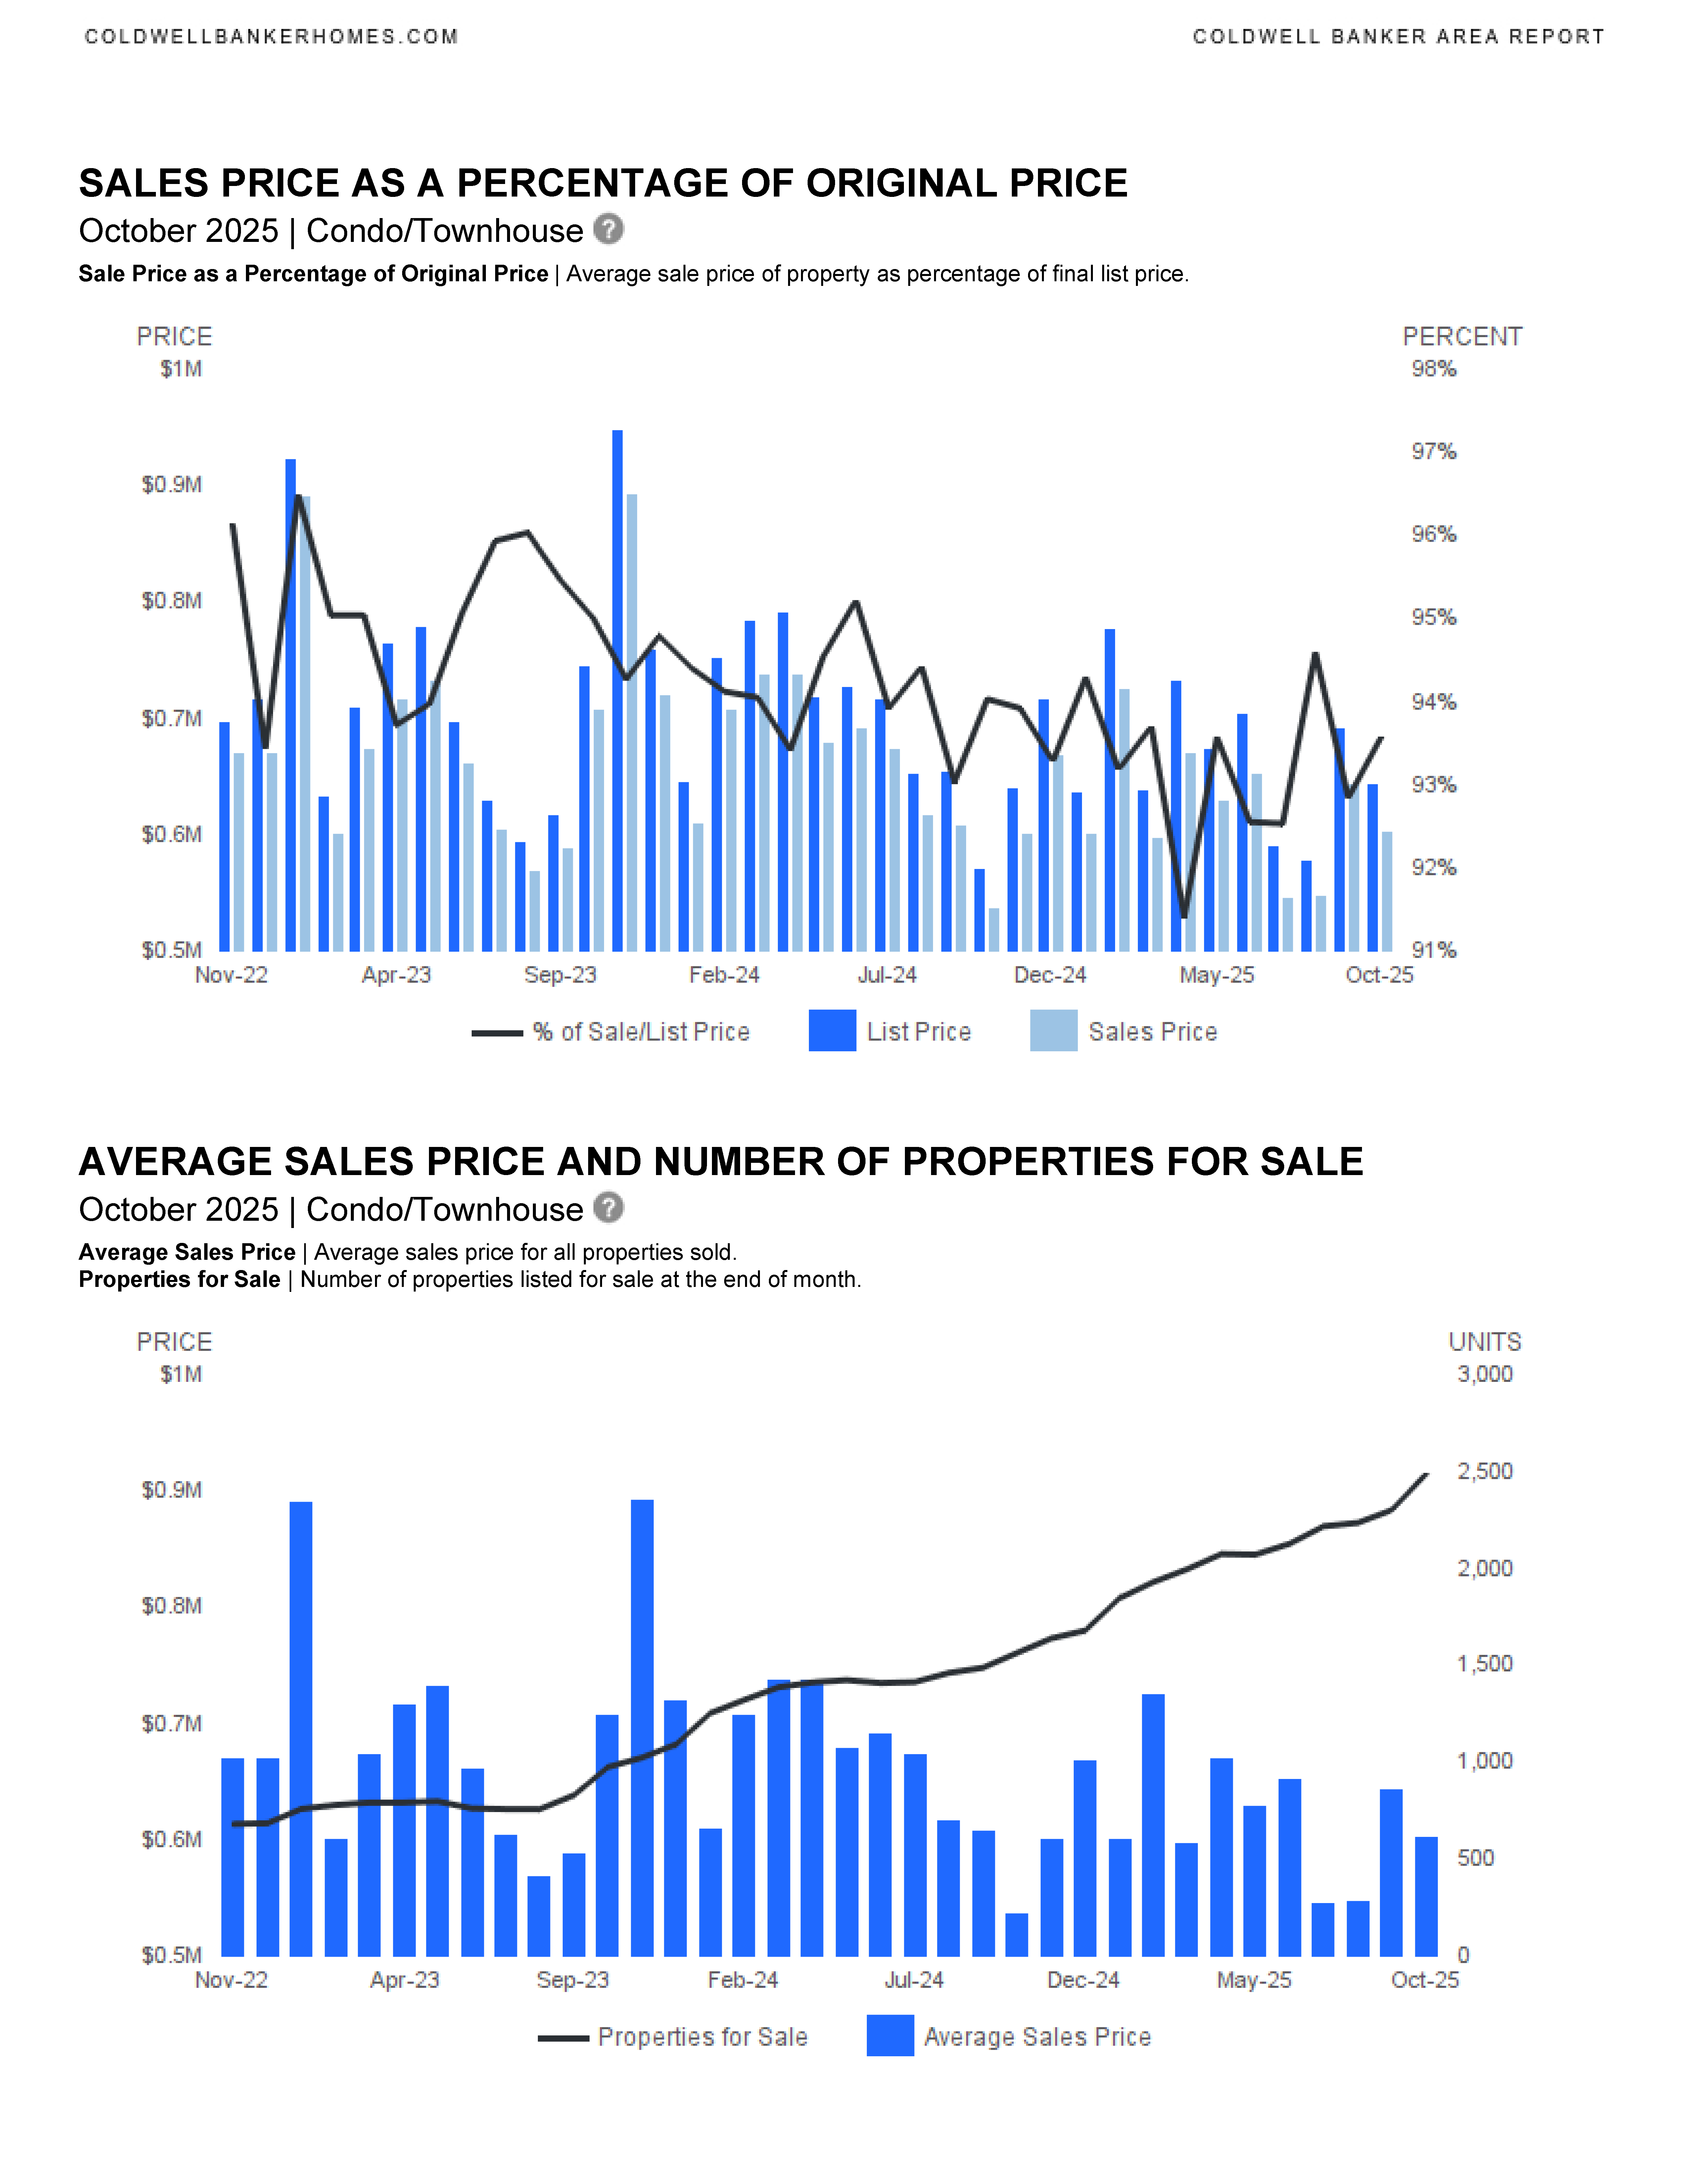
- List-to-Sale Price Ratio: 94.2% (⬇️ slightly)
Year-to-Date (YTD) Changes:
- New Listings: 4,397 (⬇️ 10.5%)
- Sold Listings: 1,488 (⬆️ 0.1%)
- Median Sold Price: $415,000 (⬇️ 7.8%)
- Average Sold Price: $619,309 (⬇️ 6.9%)
- Average Days on Market: 101 days (⬆️ 29.5%)
📊 Market Trends Summary
- Inventory is tightening: Fewer new listings and longer days on market suggest a slower-moving market.
- Prices are mixed: Single family homes are seeing price increases, while condos show mixed results (monthly up, YTD down).
- Buyers have more time: Properties are staying on the market longer, especially condos.
- Sellers need to be competitive: Slight drops in list-to-sale price ratios and higher absorption rates indicate more negotiation and competition.


We are in a new housing market in SE Florida. This is the time to work with an experienced and knowledgeable real estate professional. Please contact me if you would like to be sent updated market reports for YOUR specific neighborhood, Fort Lauderdale, or another SE Florida city. We can discuss the market, current trends and how we can work together to accomplish your real estate goals. I am here to help.
CONTACT ANNETTE
Let’s start working together!
Annette Dammeyer, REALTOR®, ABR®, AHWD®
Coldwell Banker Realty
901 E Las Olas Blvd STE 101, Fort Lauderdale, FL 33301
808.747.3686
SL 3535792
Fort Lauderdale September 2025 Area Report
Fort Lauderdale September 2025 real estate statistics have been published.
Fort Lauderdale Area Reports
Single Family Homes
Condominium & Townhouses
🏡 Fort Lauderdale Real Estate Market Summary – September 2025
📊 Single Family Homes
- Sales Activity
- Sold listings remained flat month-over-month (130 units), but YTD sales dropped 11.74%.
- New listings declined 20.11% month-over-month and 4.72% YTD.
- Pricing Trends
- Median Sold Price: $665K (↑17.7% YoY)
- Average Sold Price: $1.02M (↑16.46% YoY)
- Median List Price (Solds): $699K (↑20.57% YoY)
- Average List Price (Solds): $1.09M (↑18.02% YoY)
- Market Dynamics
- Average Days on Market: 87 (↑47.46% YoY)
- List/Sold Price Ratio: 95% (↓1.35% YoY)
- Absorption Rate: trending above 6 months, indicating a buyer’s market.
- Historical Context
- Sold volume dropped to $1.62B from $2.09B in 2024.
- Listing volume fell to $5.22B from $8.06B.
- Median sale price rose to $640K from $585K.
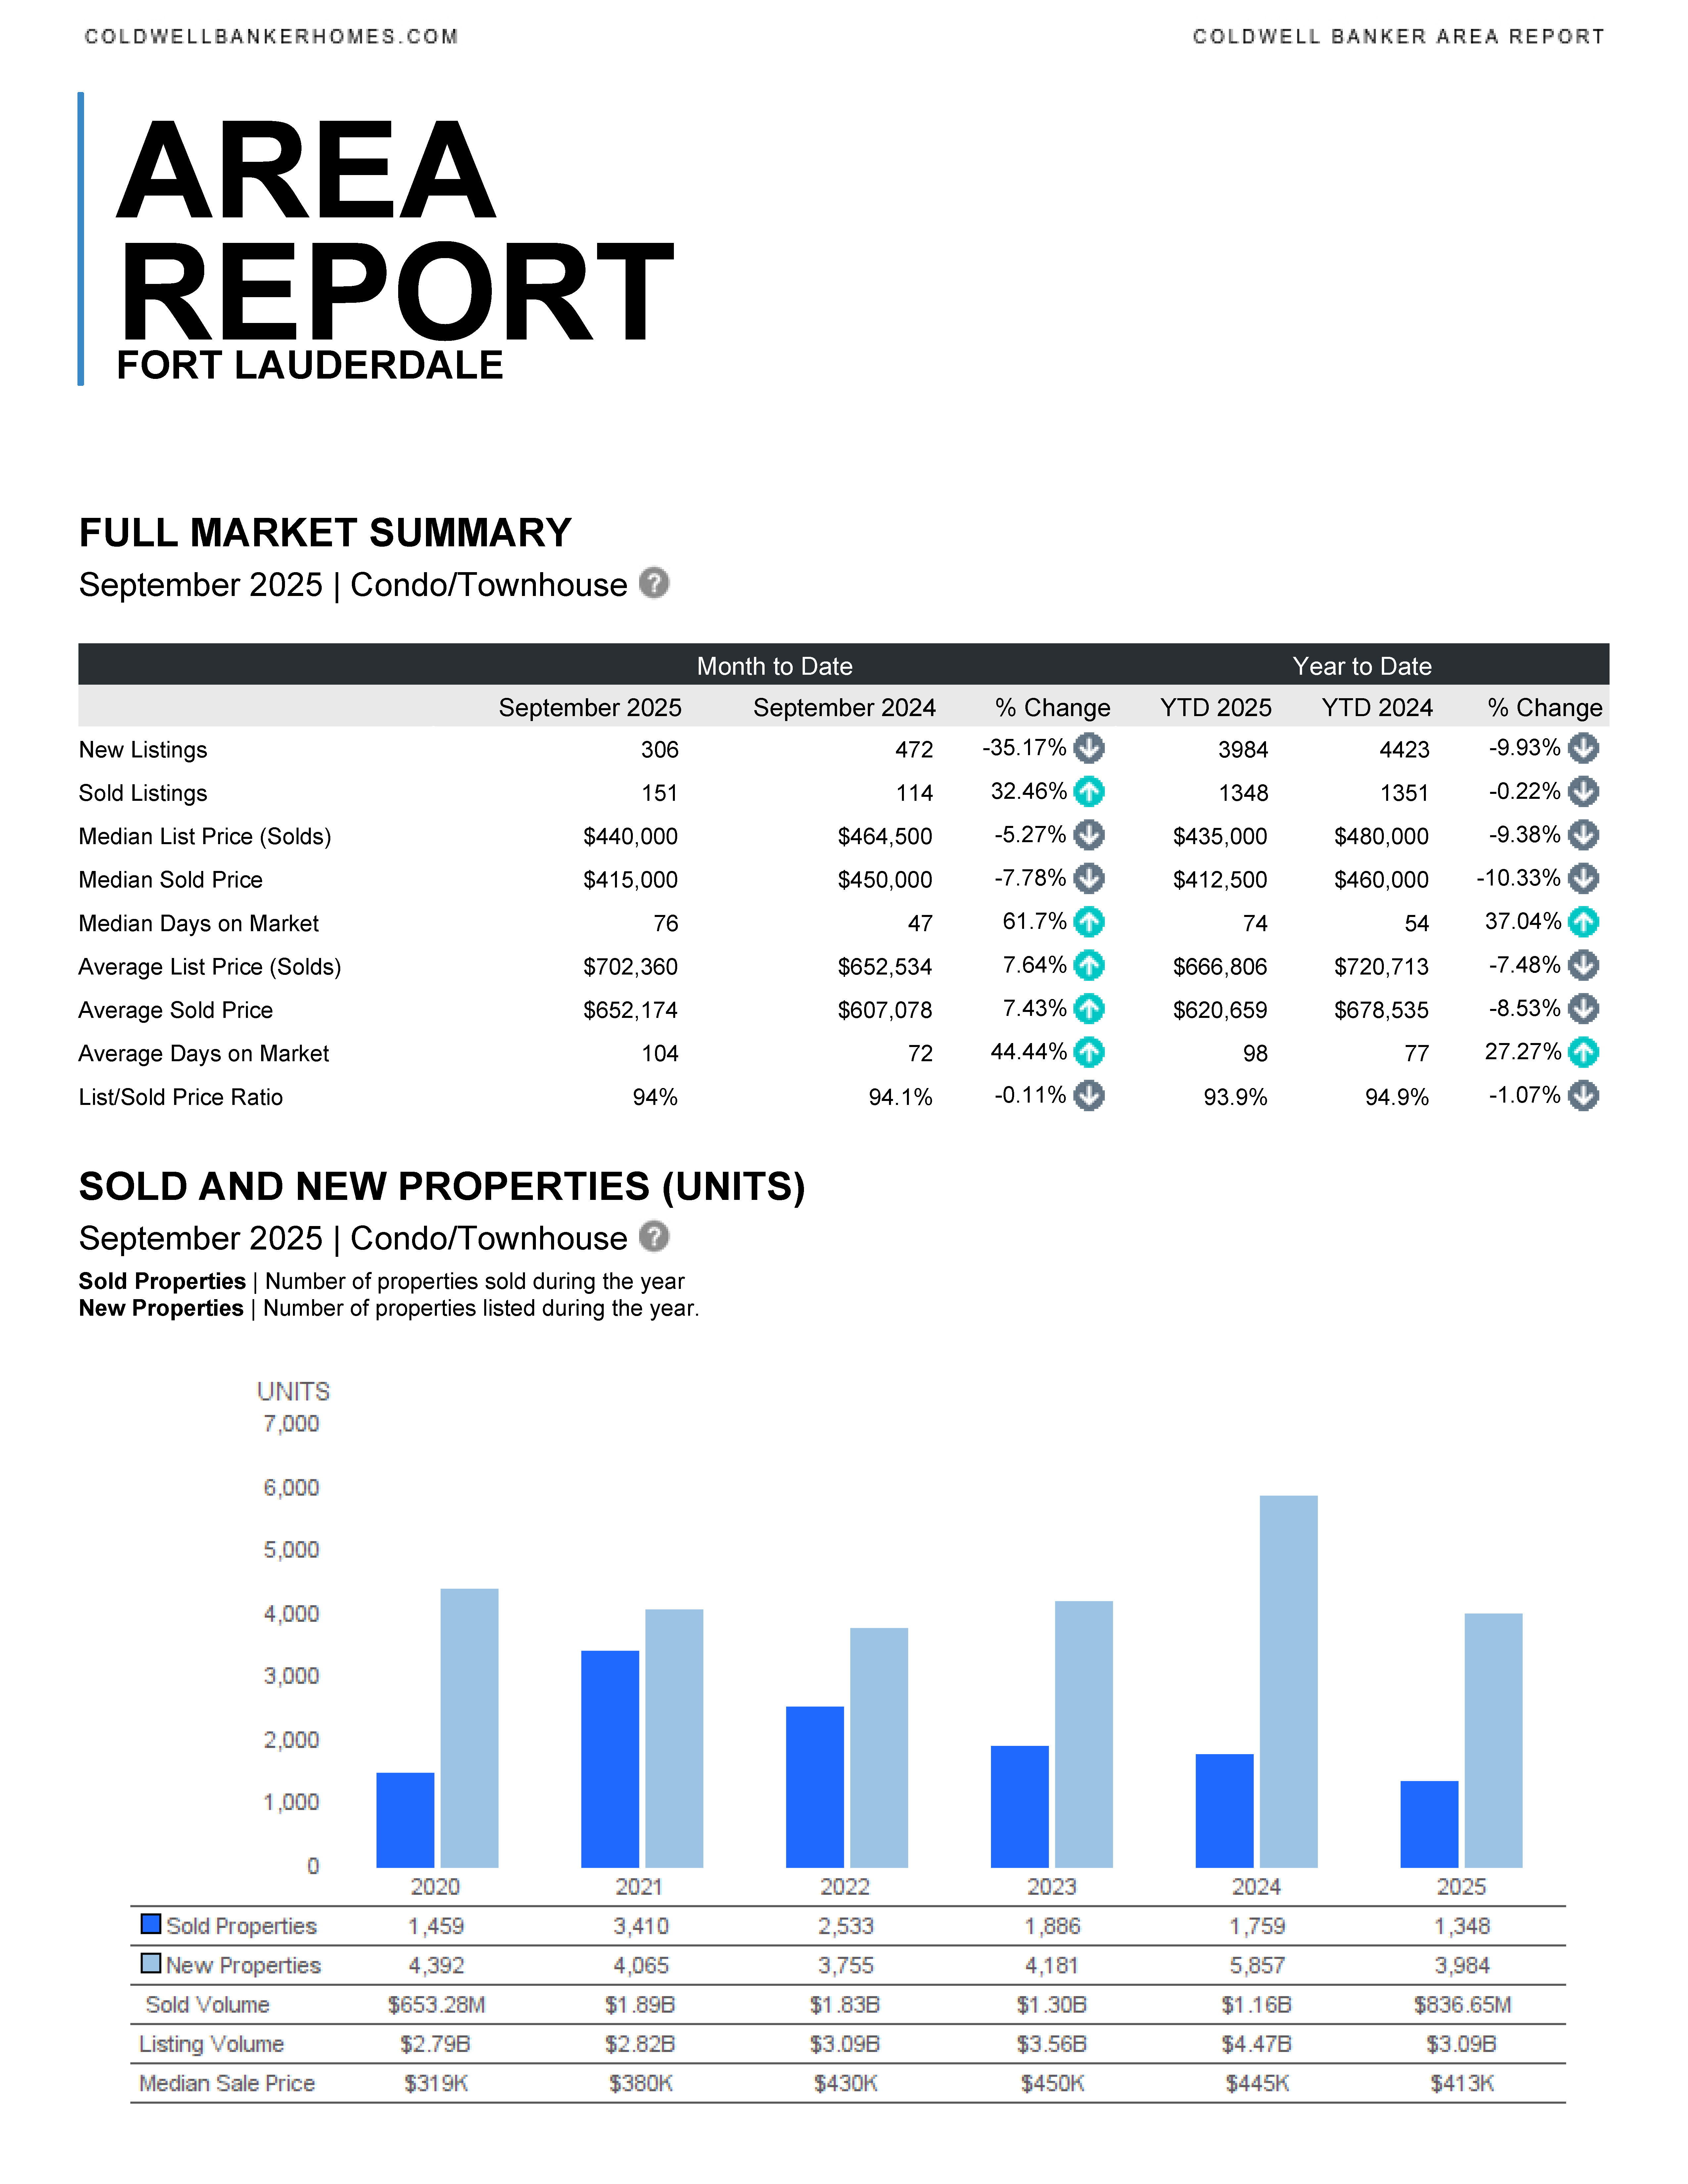
🏢 Condos & Townhomes
- Sales Activity
- Sold listings increased 32.46% YoY (151 units), but YTD sales slightly declined.
- New listings dropped 35.17% YoY and 9.93% YTD.
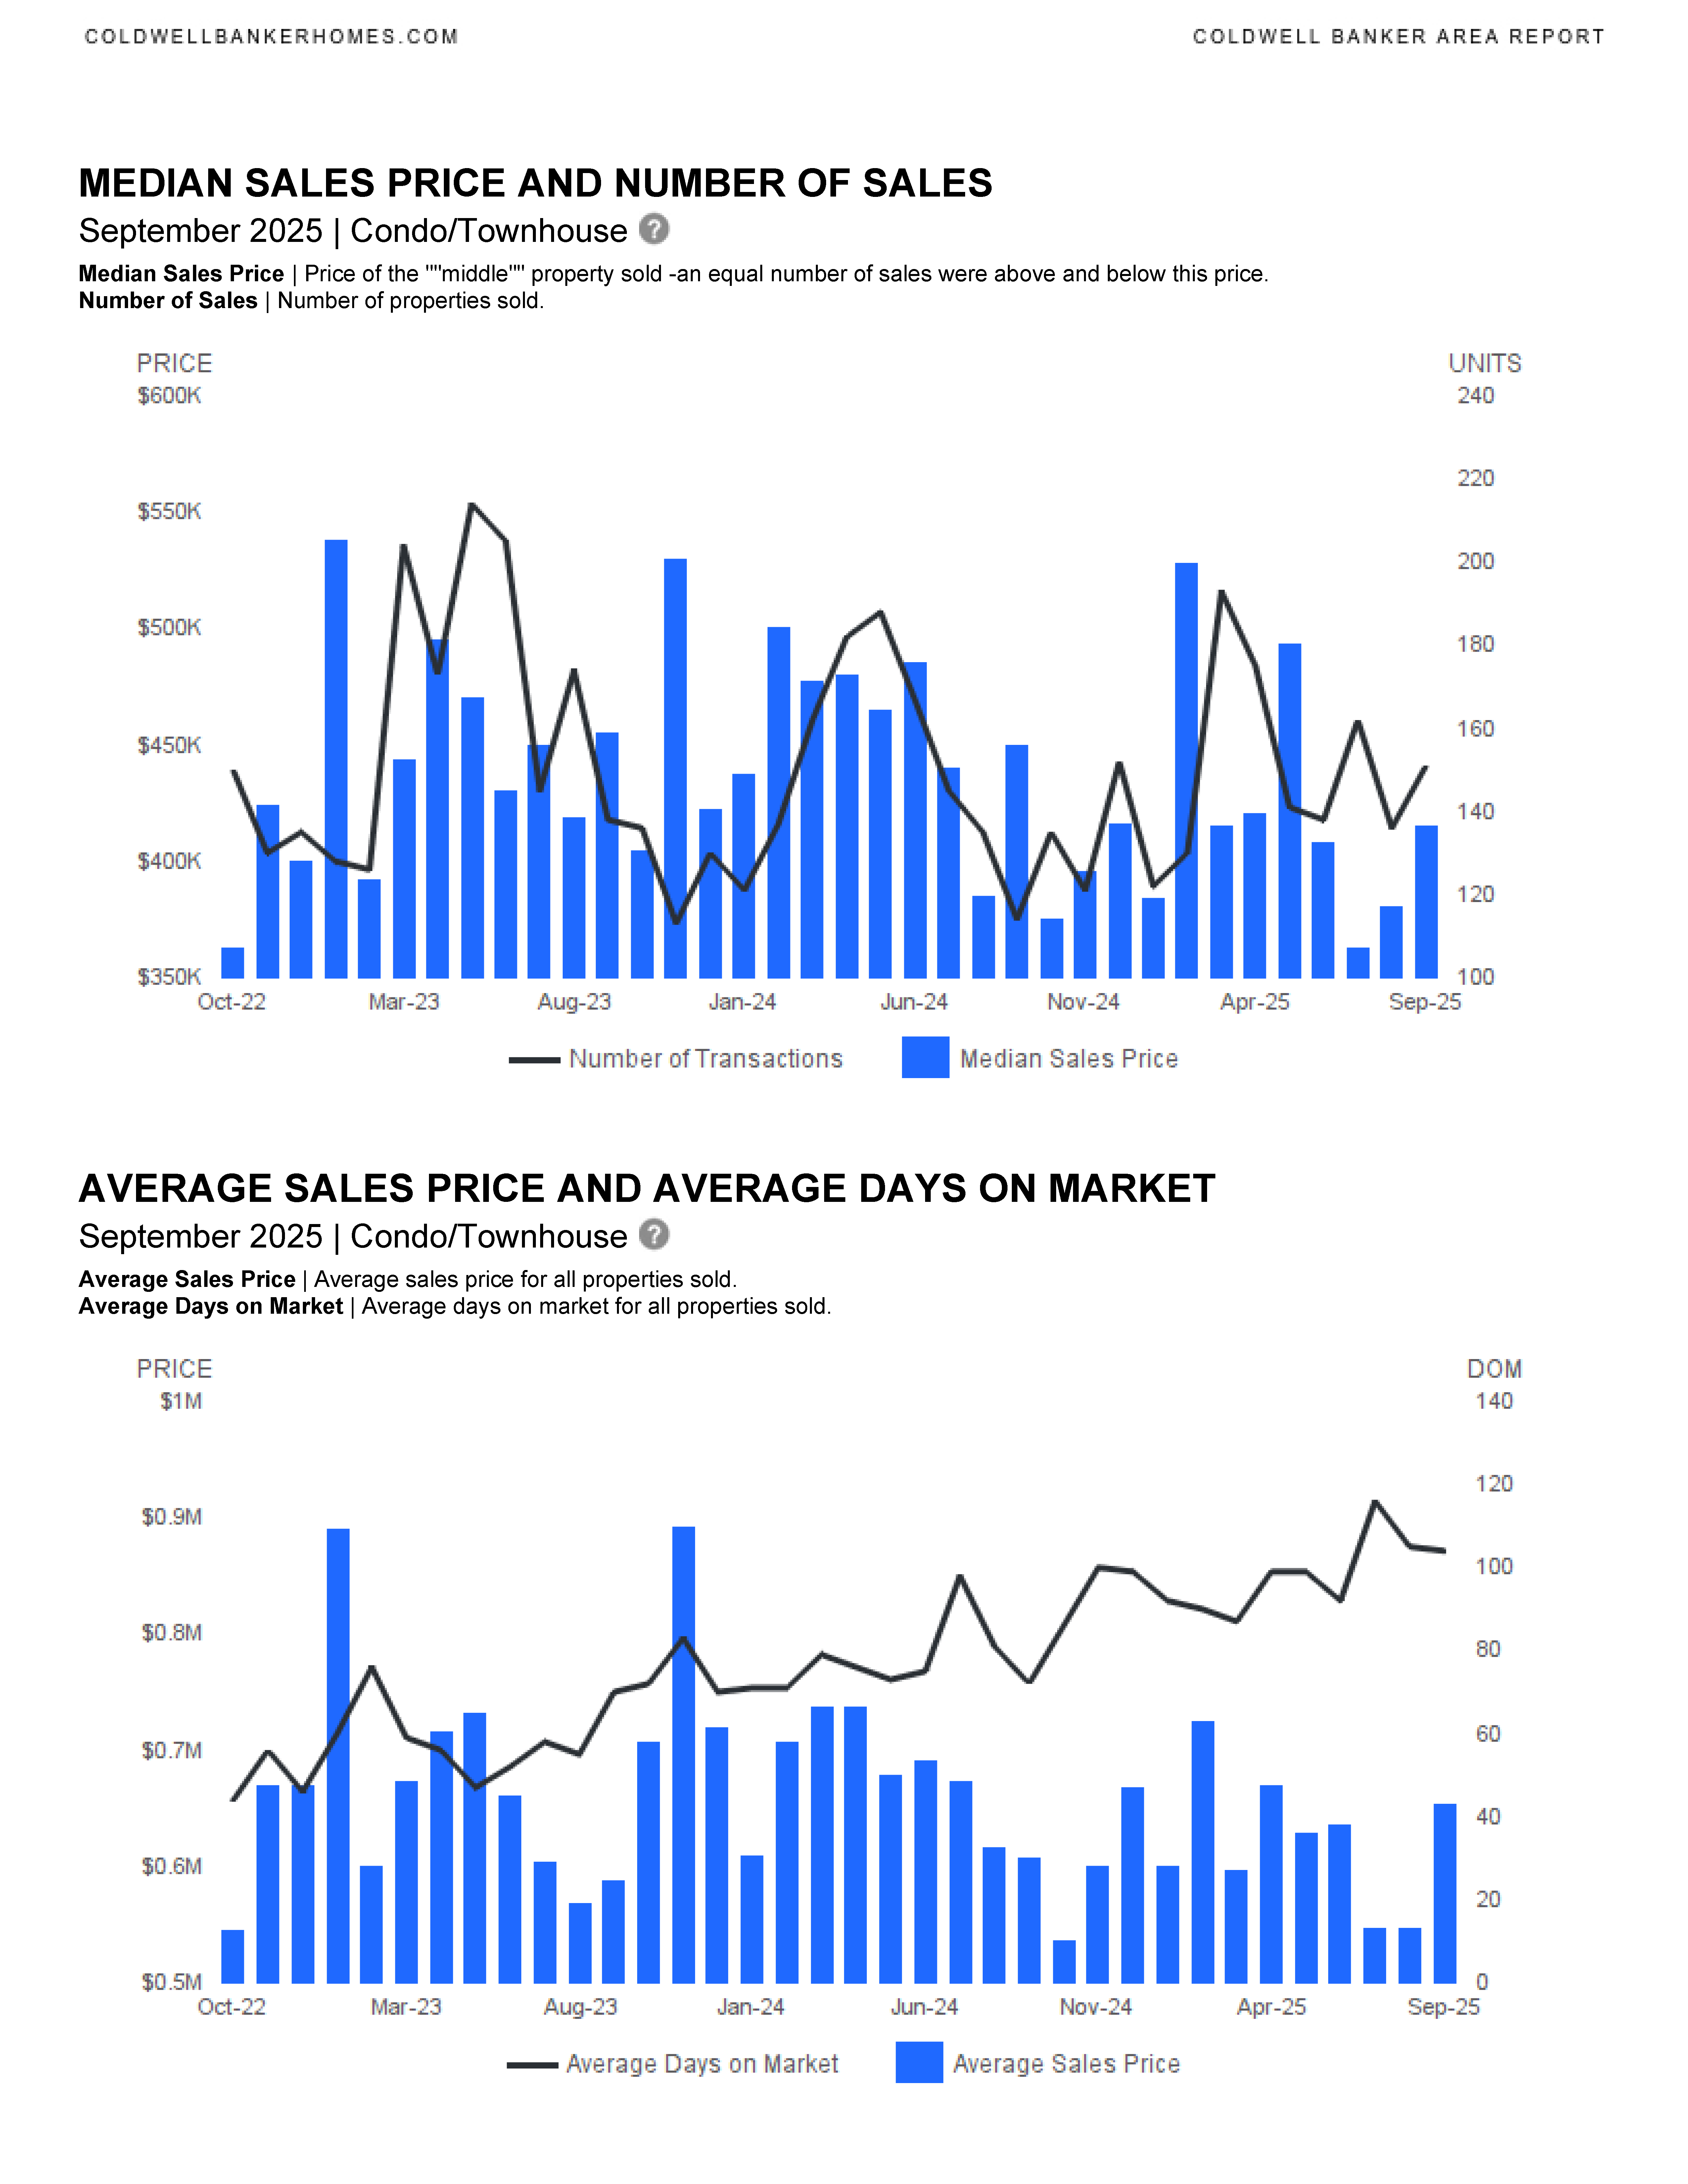
- Pricing Trends
- Median Sold Price: $415K (↓7.78% YoY)
- Average Sold Price: $652K (↑7.43% YoY)
- Median List Price (Solds): $440K (↓5.27% YoY)
- Average List Price (Solds): $702K (↑7.64% YoY)
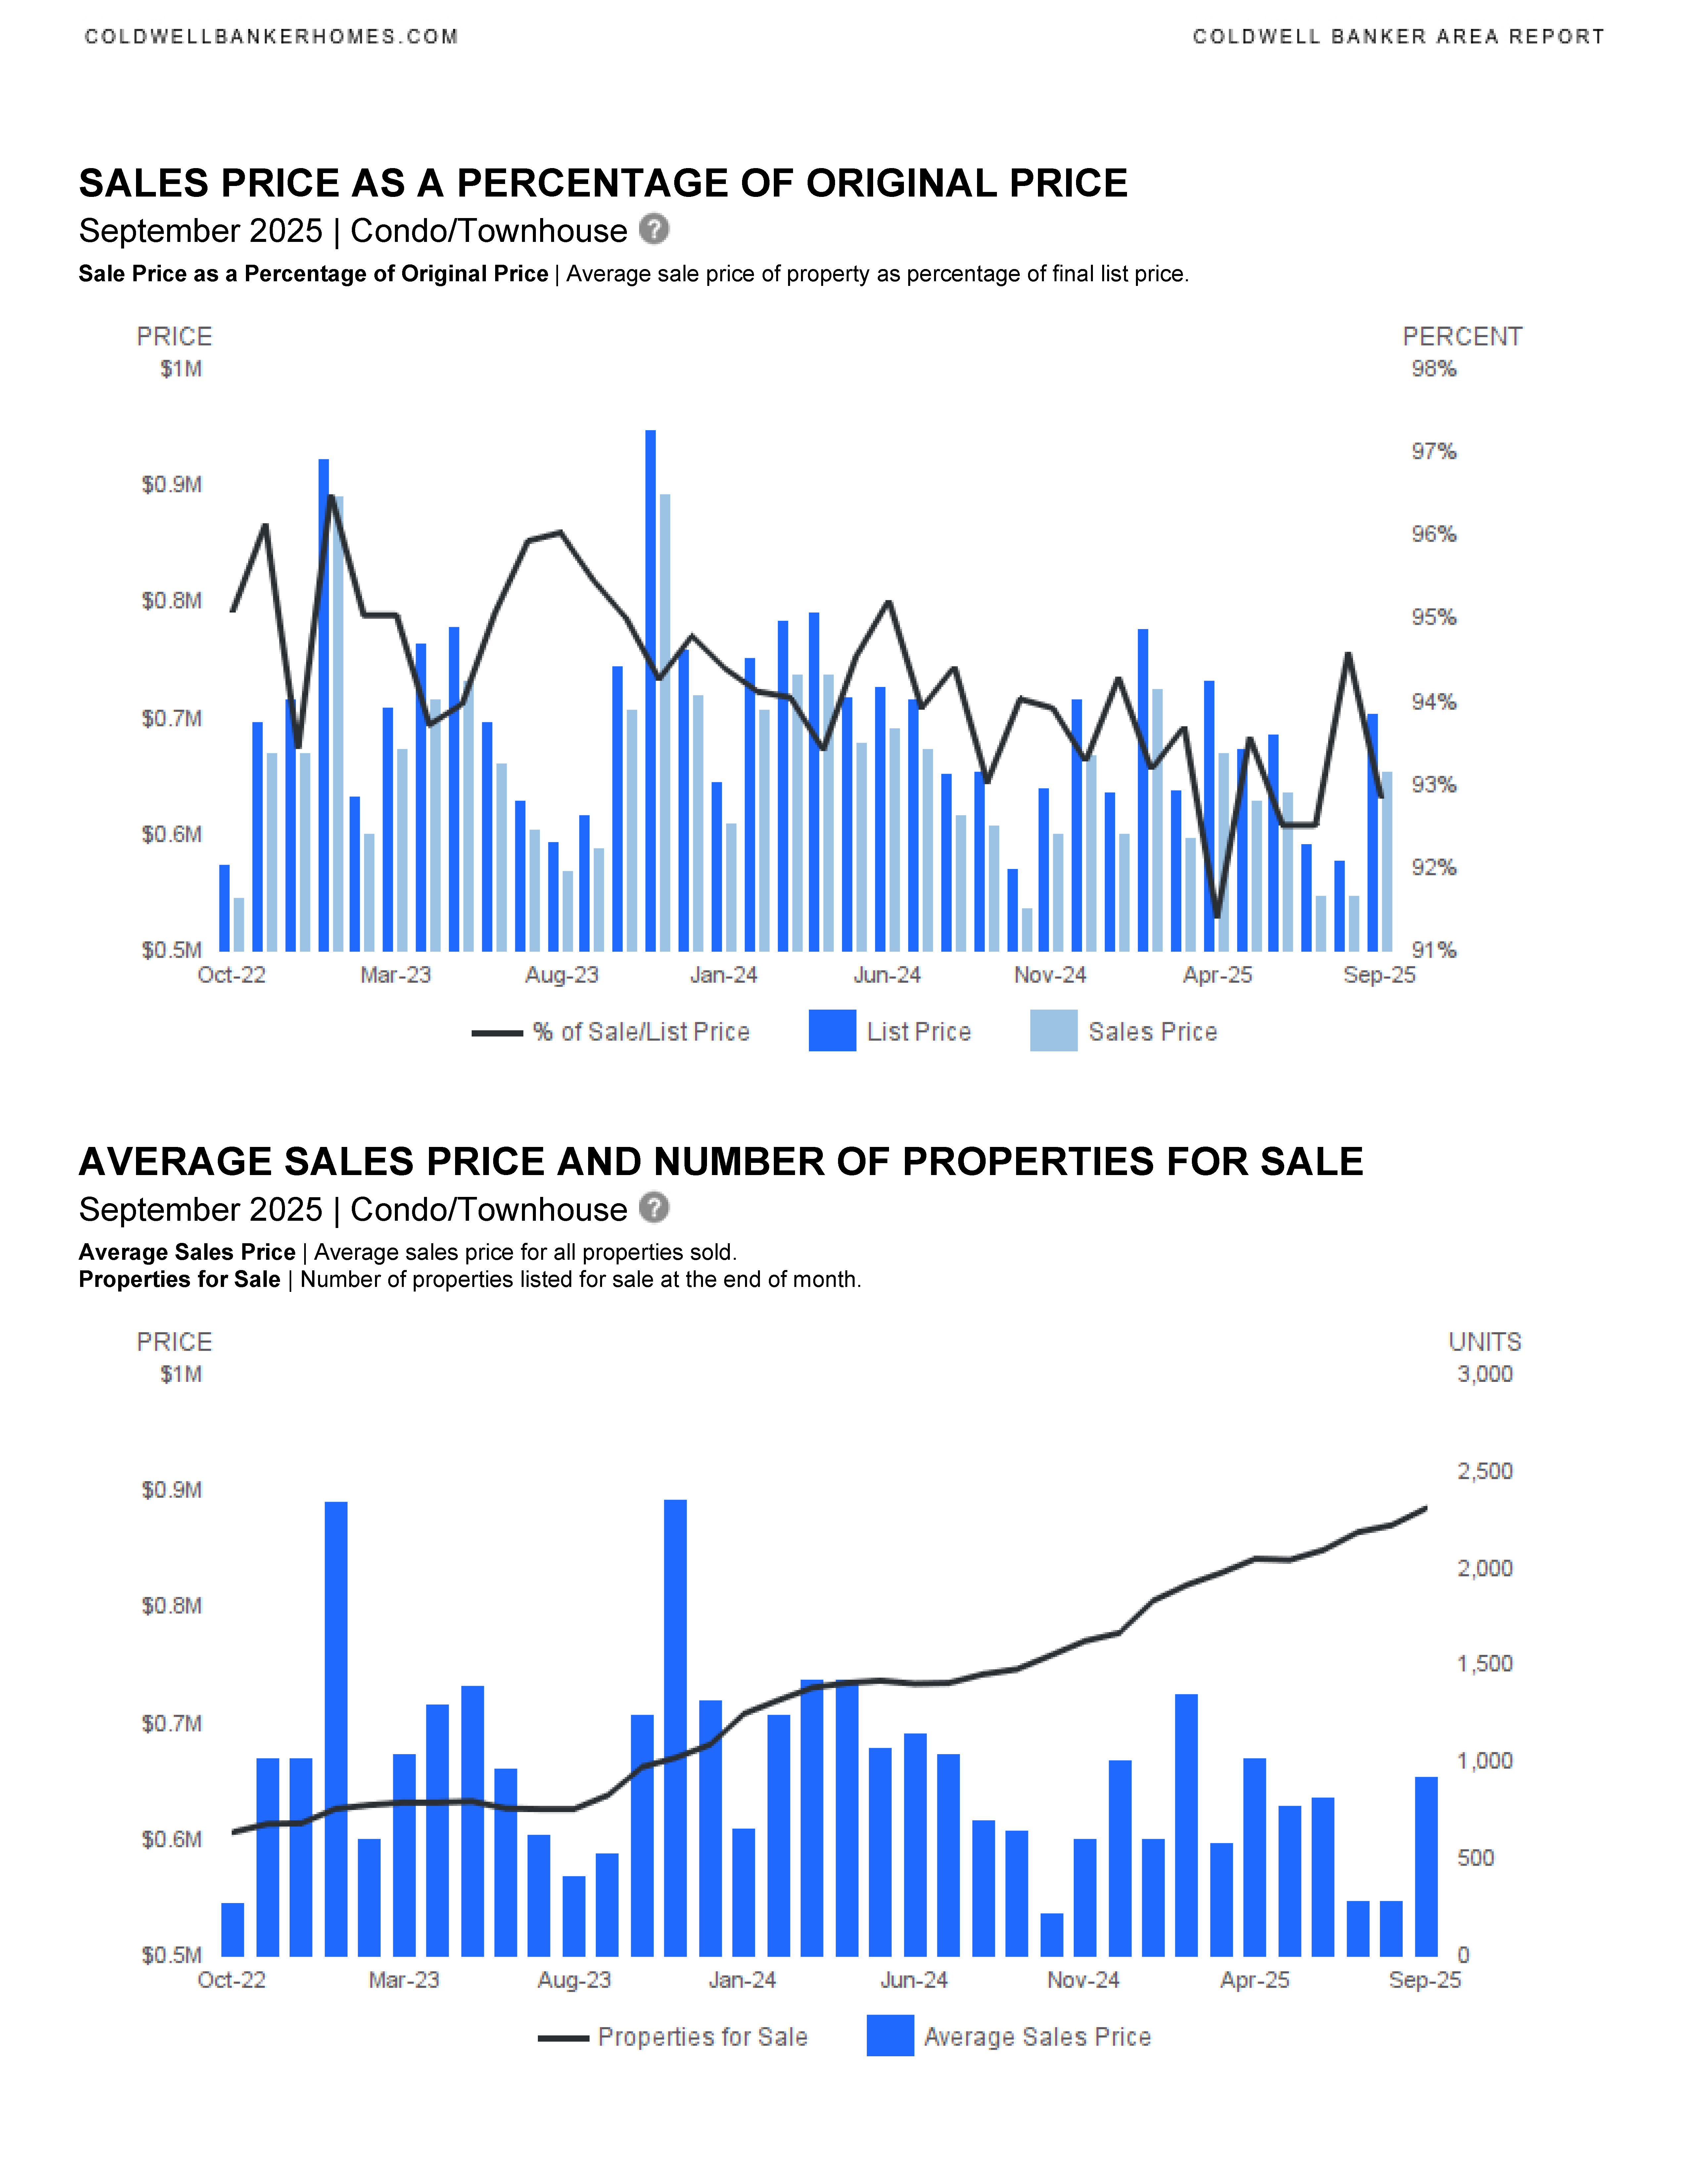
- Market Dynamics
- Average Days on Market: 104 (↑44.44% YoY)
- List/Sold Price Ratio: 94% (slightly down YoY)
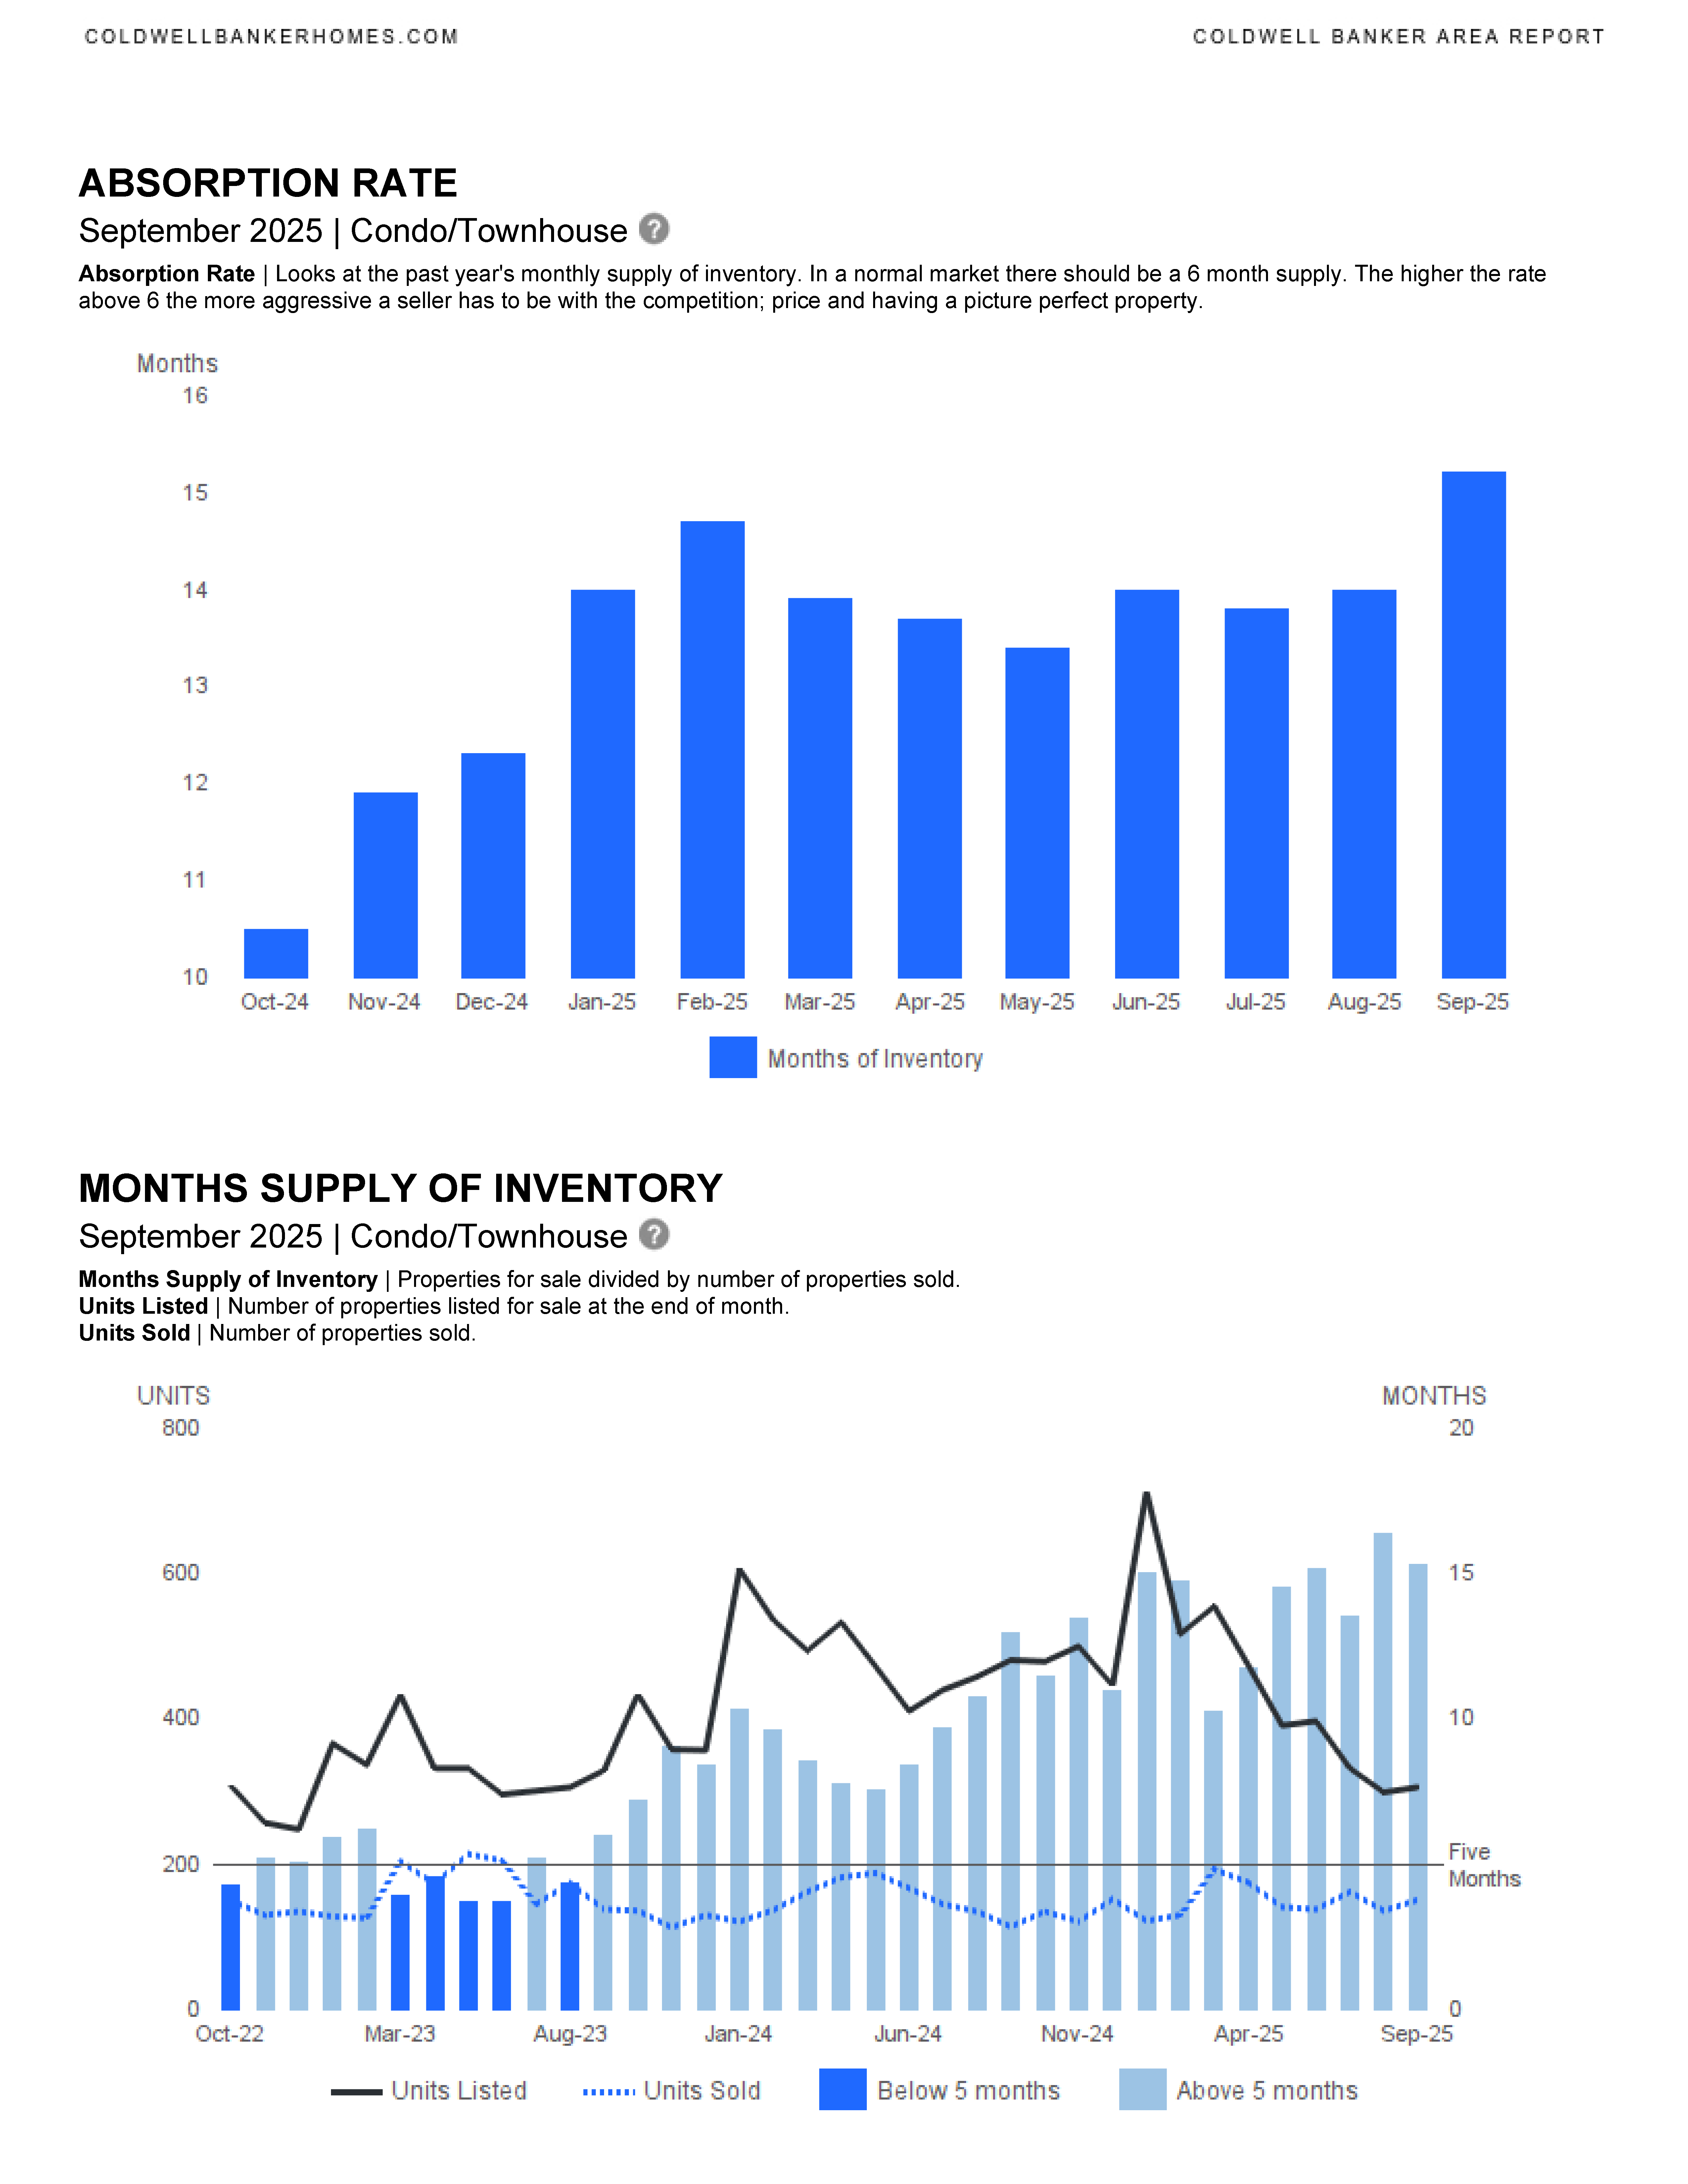
- Absorption Rate: well above 6 months, suggesting slower turnover and more competition.
- Historical Context
- Sold volume fell to $836M from $1.16B.
- Listing volume dropped to $3.09B from $4.47B.
- Median sale price decreased to $413K from $445K.
Additional Metrics:
- Absorption Rate: Indicates market competitiveness based on inventory supply.
- Months Supply of Inventory: Reflects the balance between properties for sale and sold properties.


We are in a new housing market in SE Florida. This is the time to work with an experienced and knowledgeable real estate professional. Please contact me if you would like to be sent updated market reports for YOUR specific neighborhood, Fort Lauderdale, or another SE Florida city. We can discuss the market, current trends and how we can work together to accomplish your real estate goals. I am here to help.
CONTACT ANNETTE
Let’s start working together!
Annette Dammeyer, REALTOR®, ABR®, AHWD®
Coldwell Banker Realty
901 E Las Olas Blvd STE 101, Fort Lauderdale, FL 33301
808.747.3686
SL 3535792
Fort Lauderdale August 2025 Area Report
Fort Lauderdale August 2025 real estate statistics have been published.
Fort Lauderdale Area Reports
Single Family Homes
Condominium & Townhouses
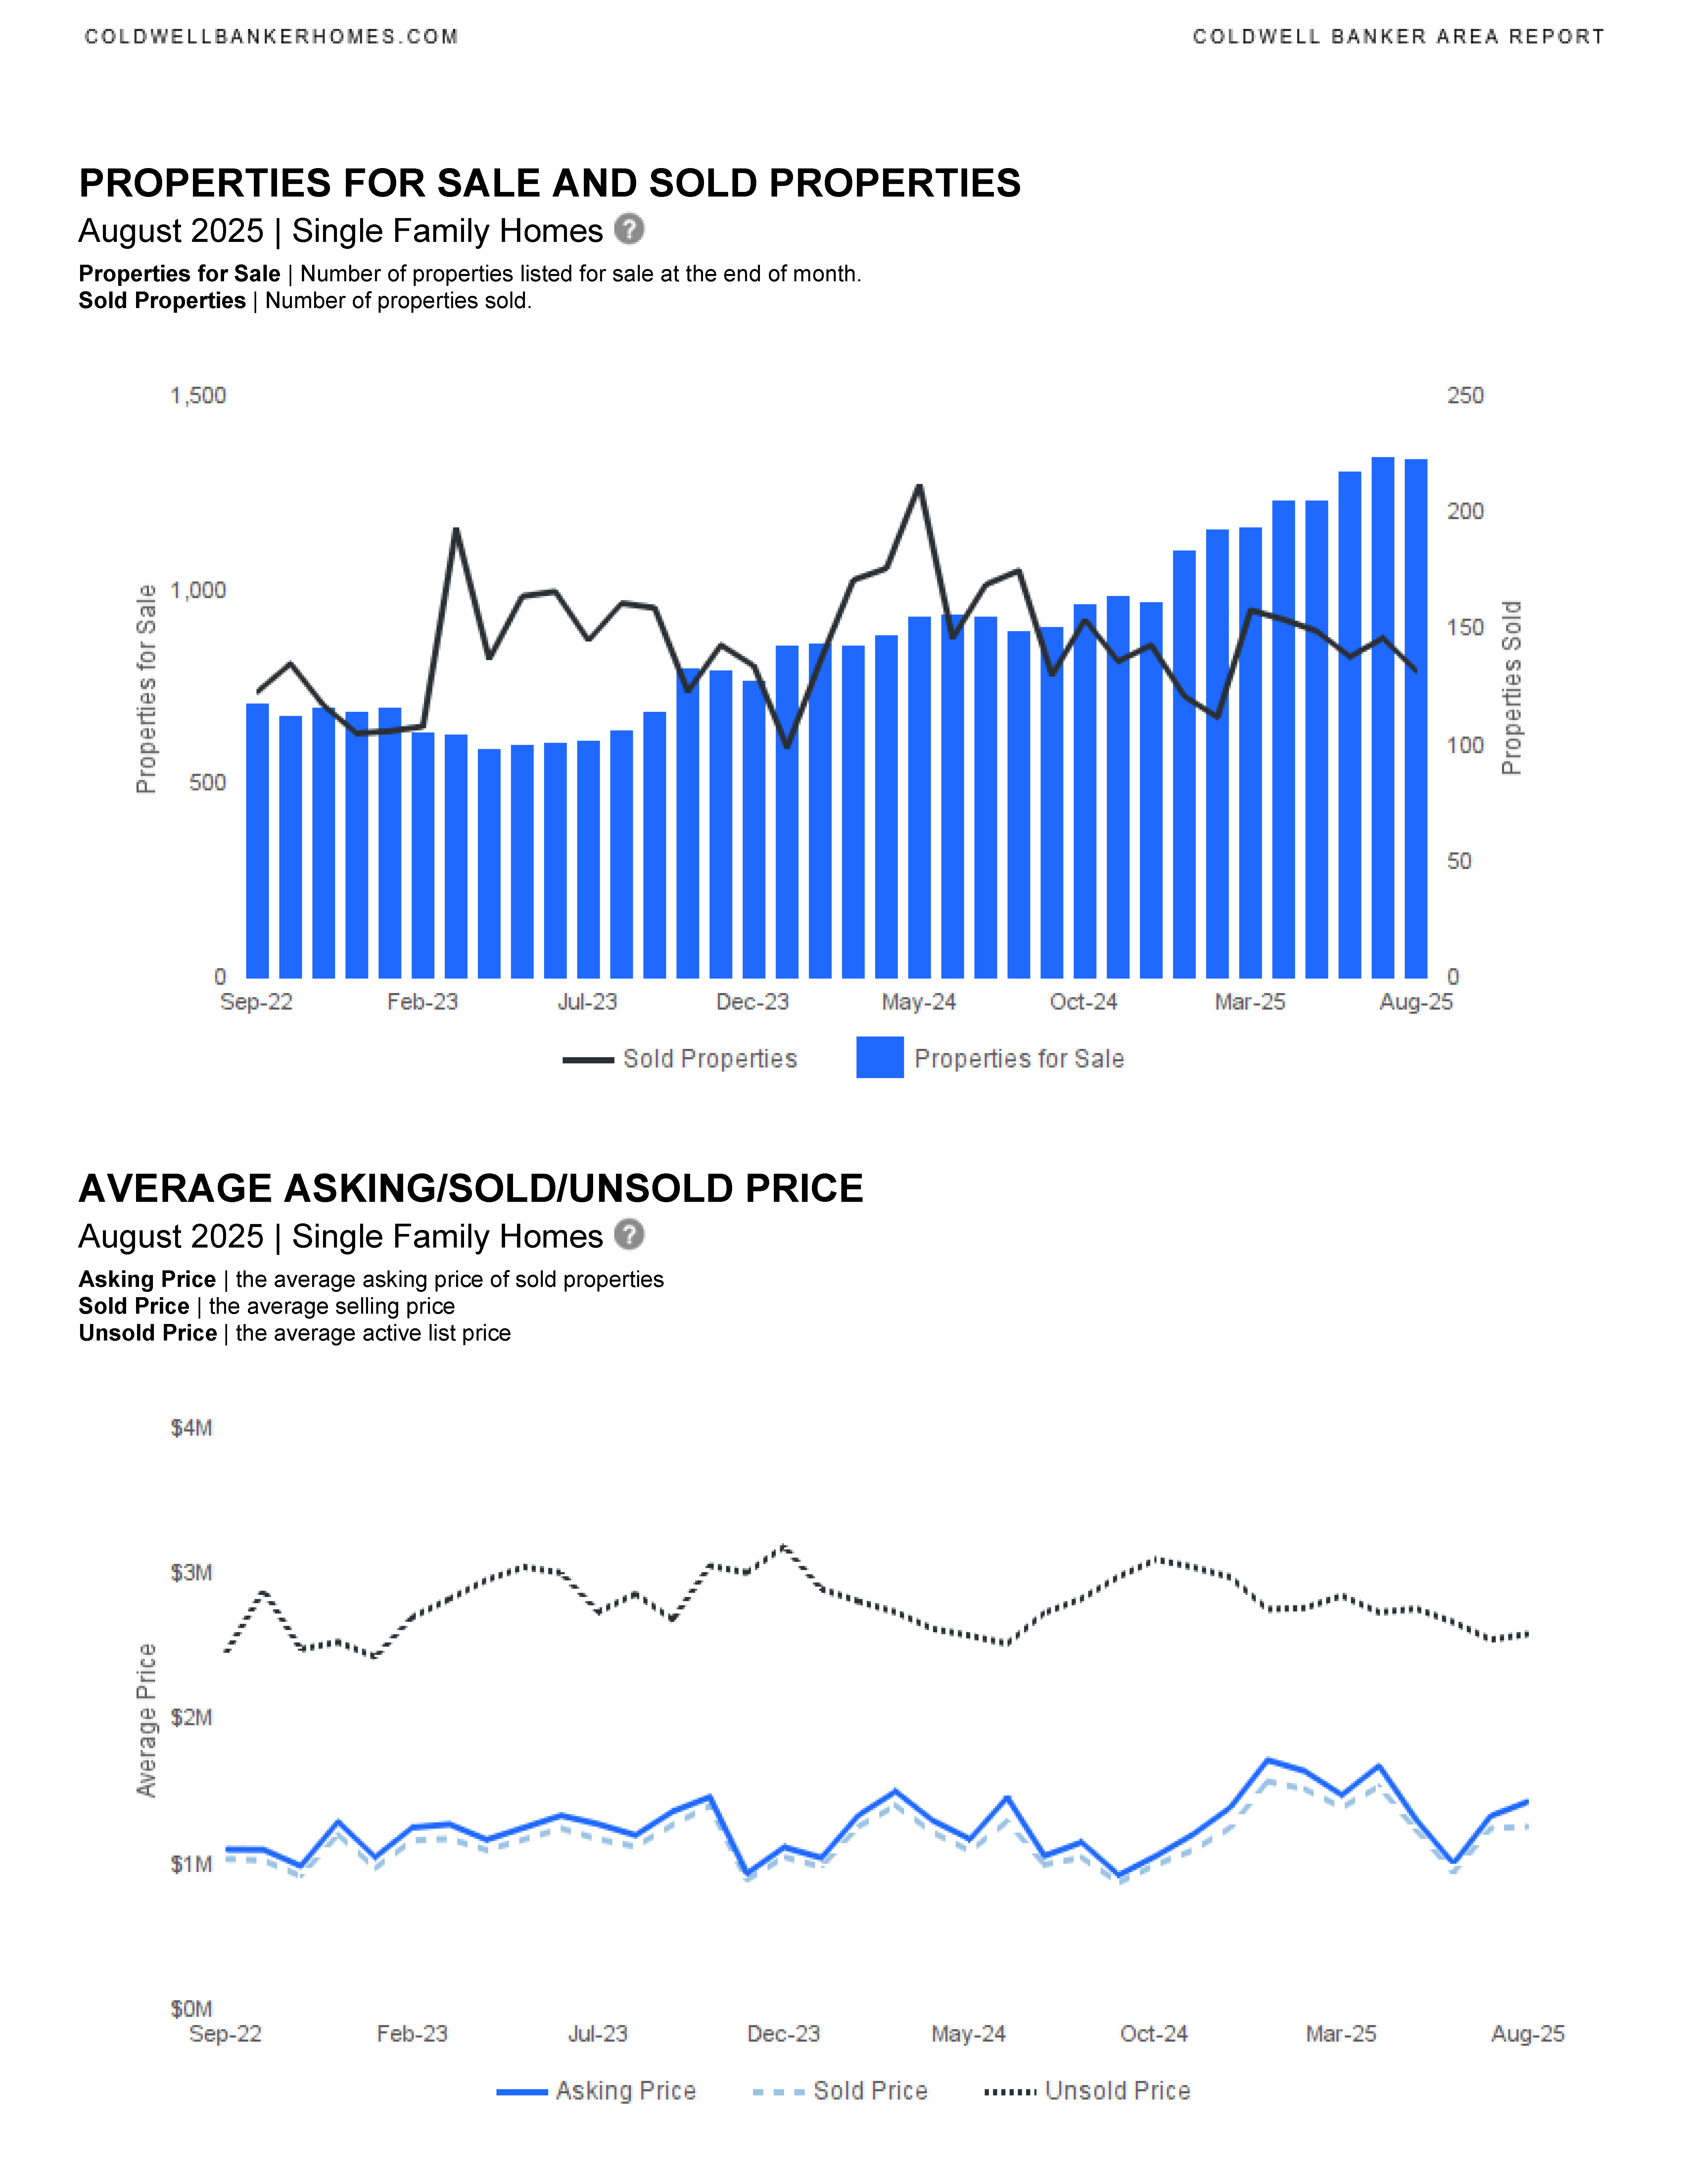
This report provides an overview of residential real estate sales activity and trends in Fort Lauderdale for single-family homes and condos/townhouses. It includes detailed statistics comparing August 2025 to August 2024 and year-to-date (YTD) data for both years.
Key Highlights:
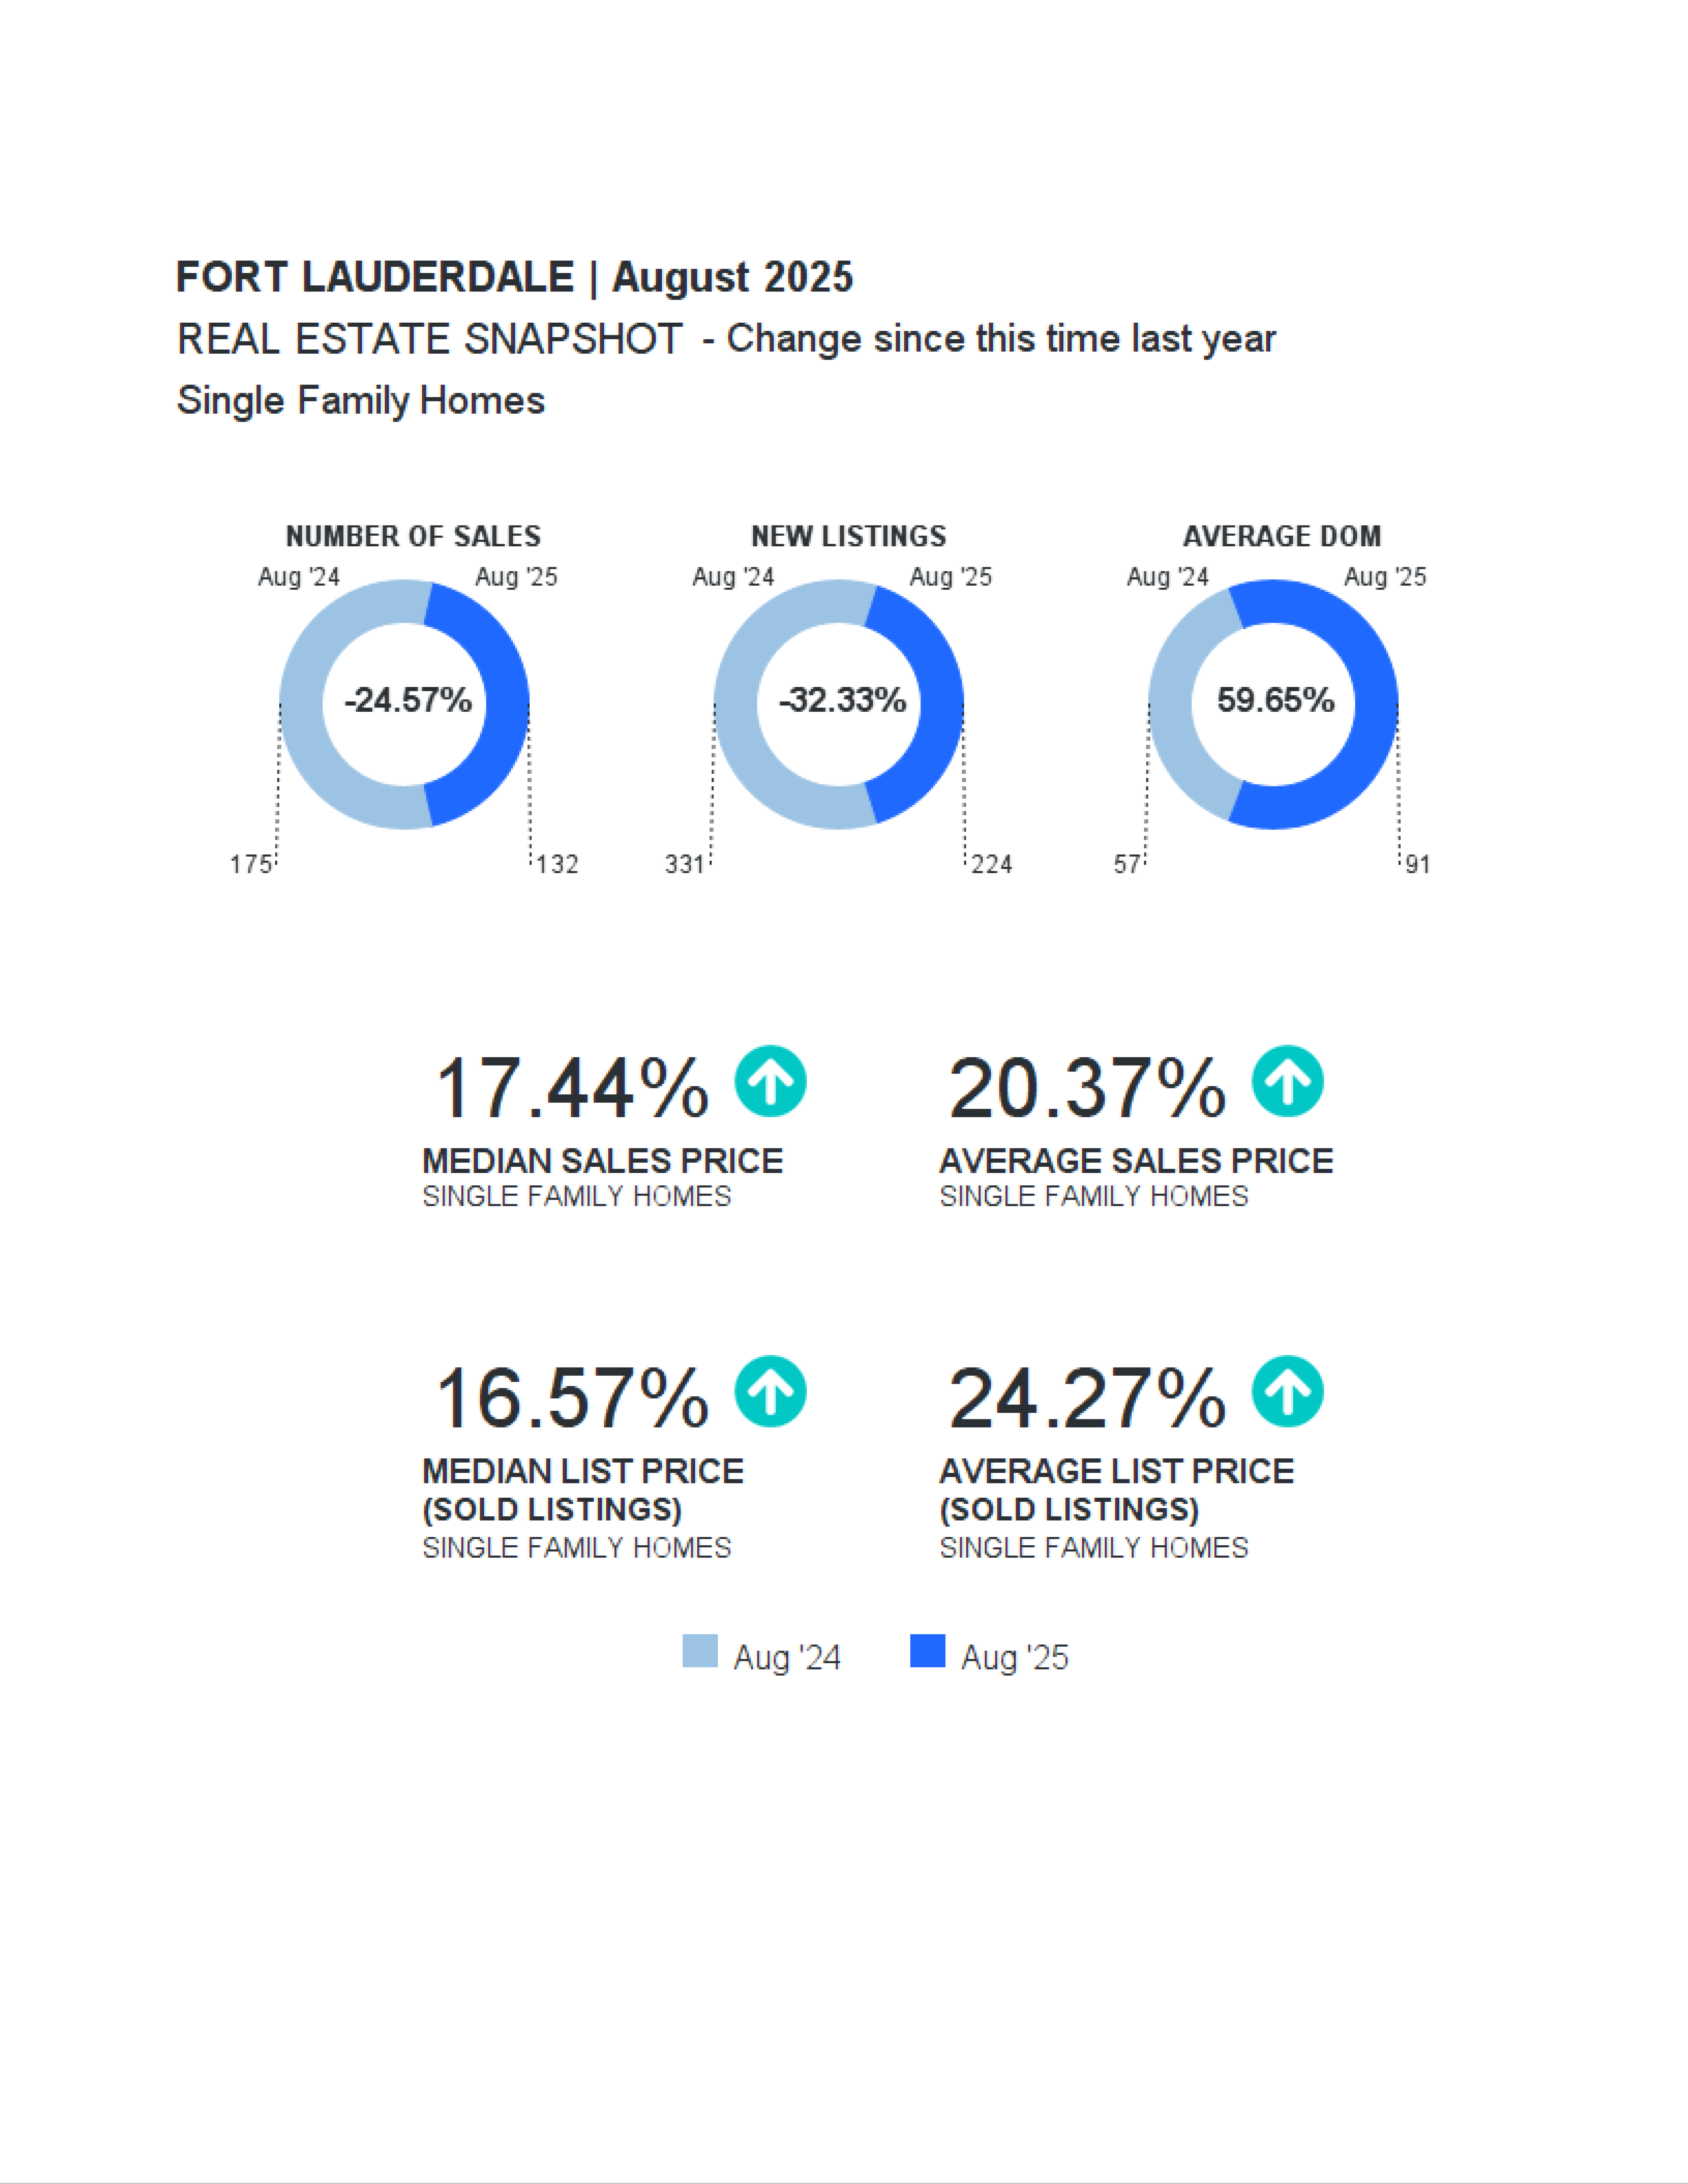
Single-Family Homes:
- New Listings: Down 32.33% month-to-date and 3.46% YTD.
- Sold Listings: Decreased by 24.57% month-to-date and 13.55% YTD.
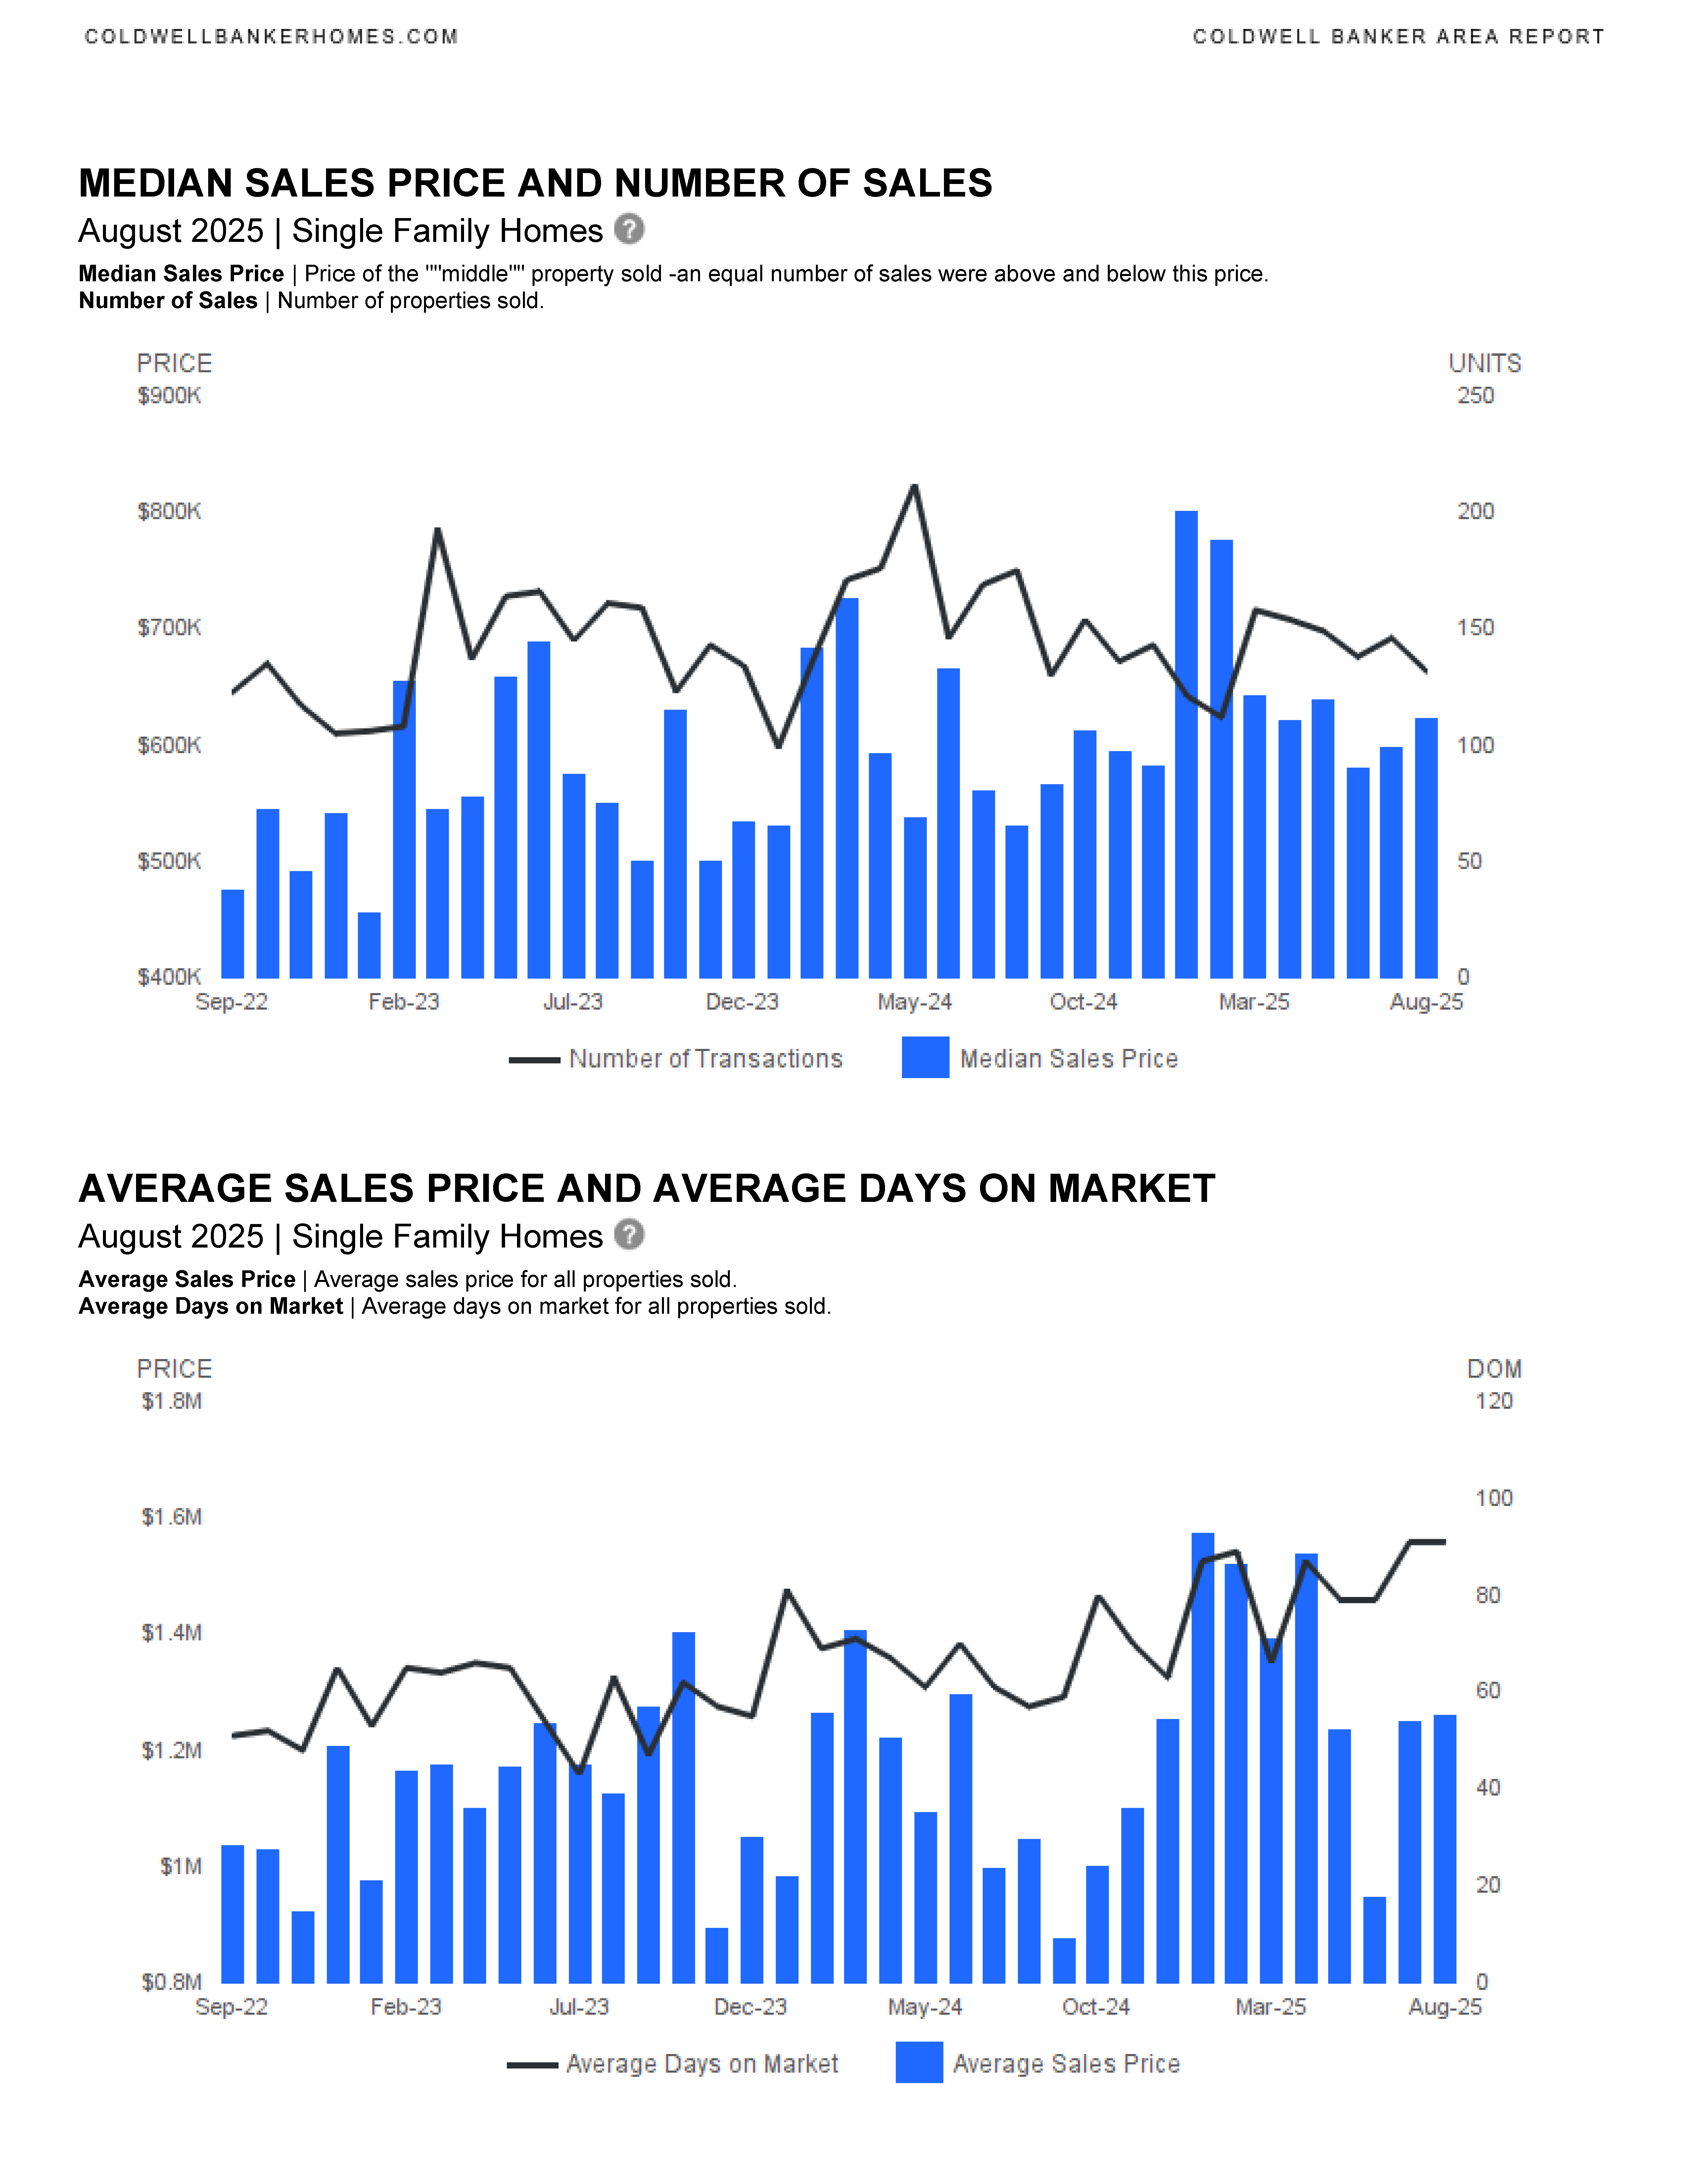
- Median Sold Price: Increased by 17.44% month-to-date and 9.66% YTD.
- Average Sold Price: Up 20.37% month-to-date and 14.41% YTD.
- Median Days on Market: Increased by 60.47% month-to-date and 25.58% YTD.
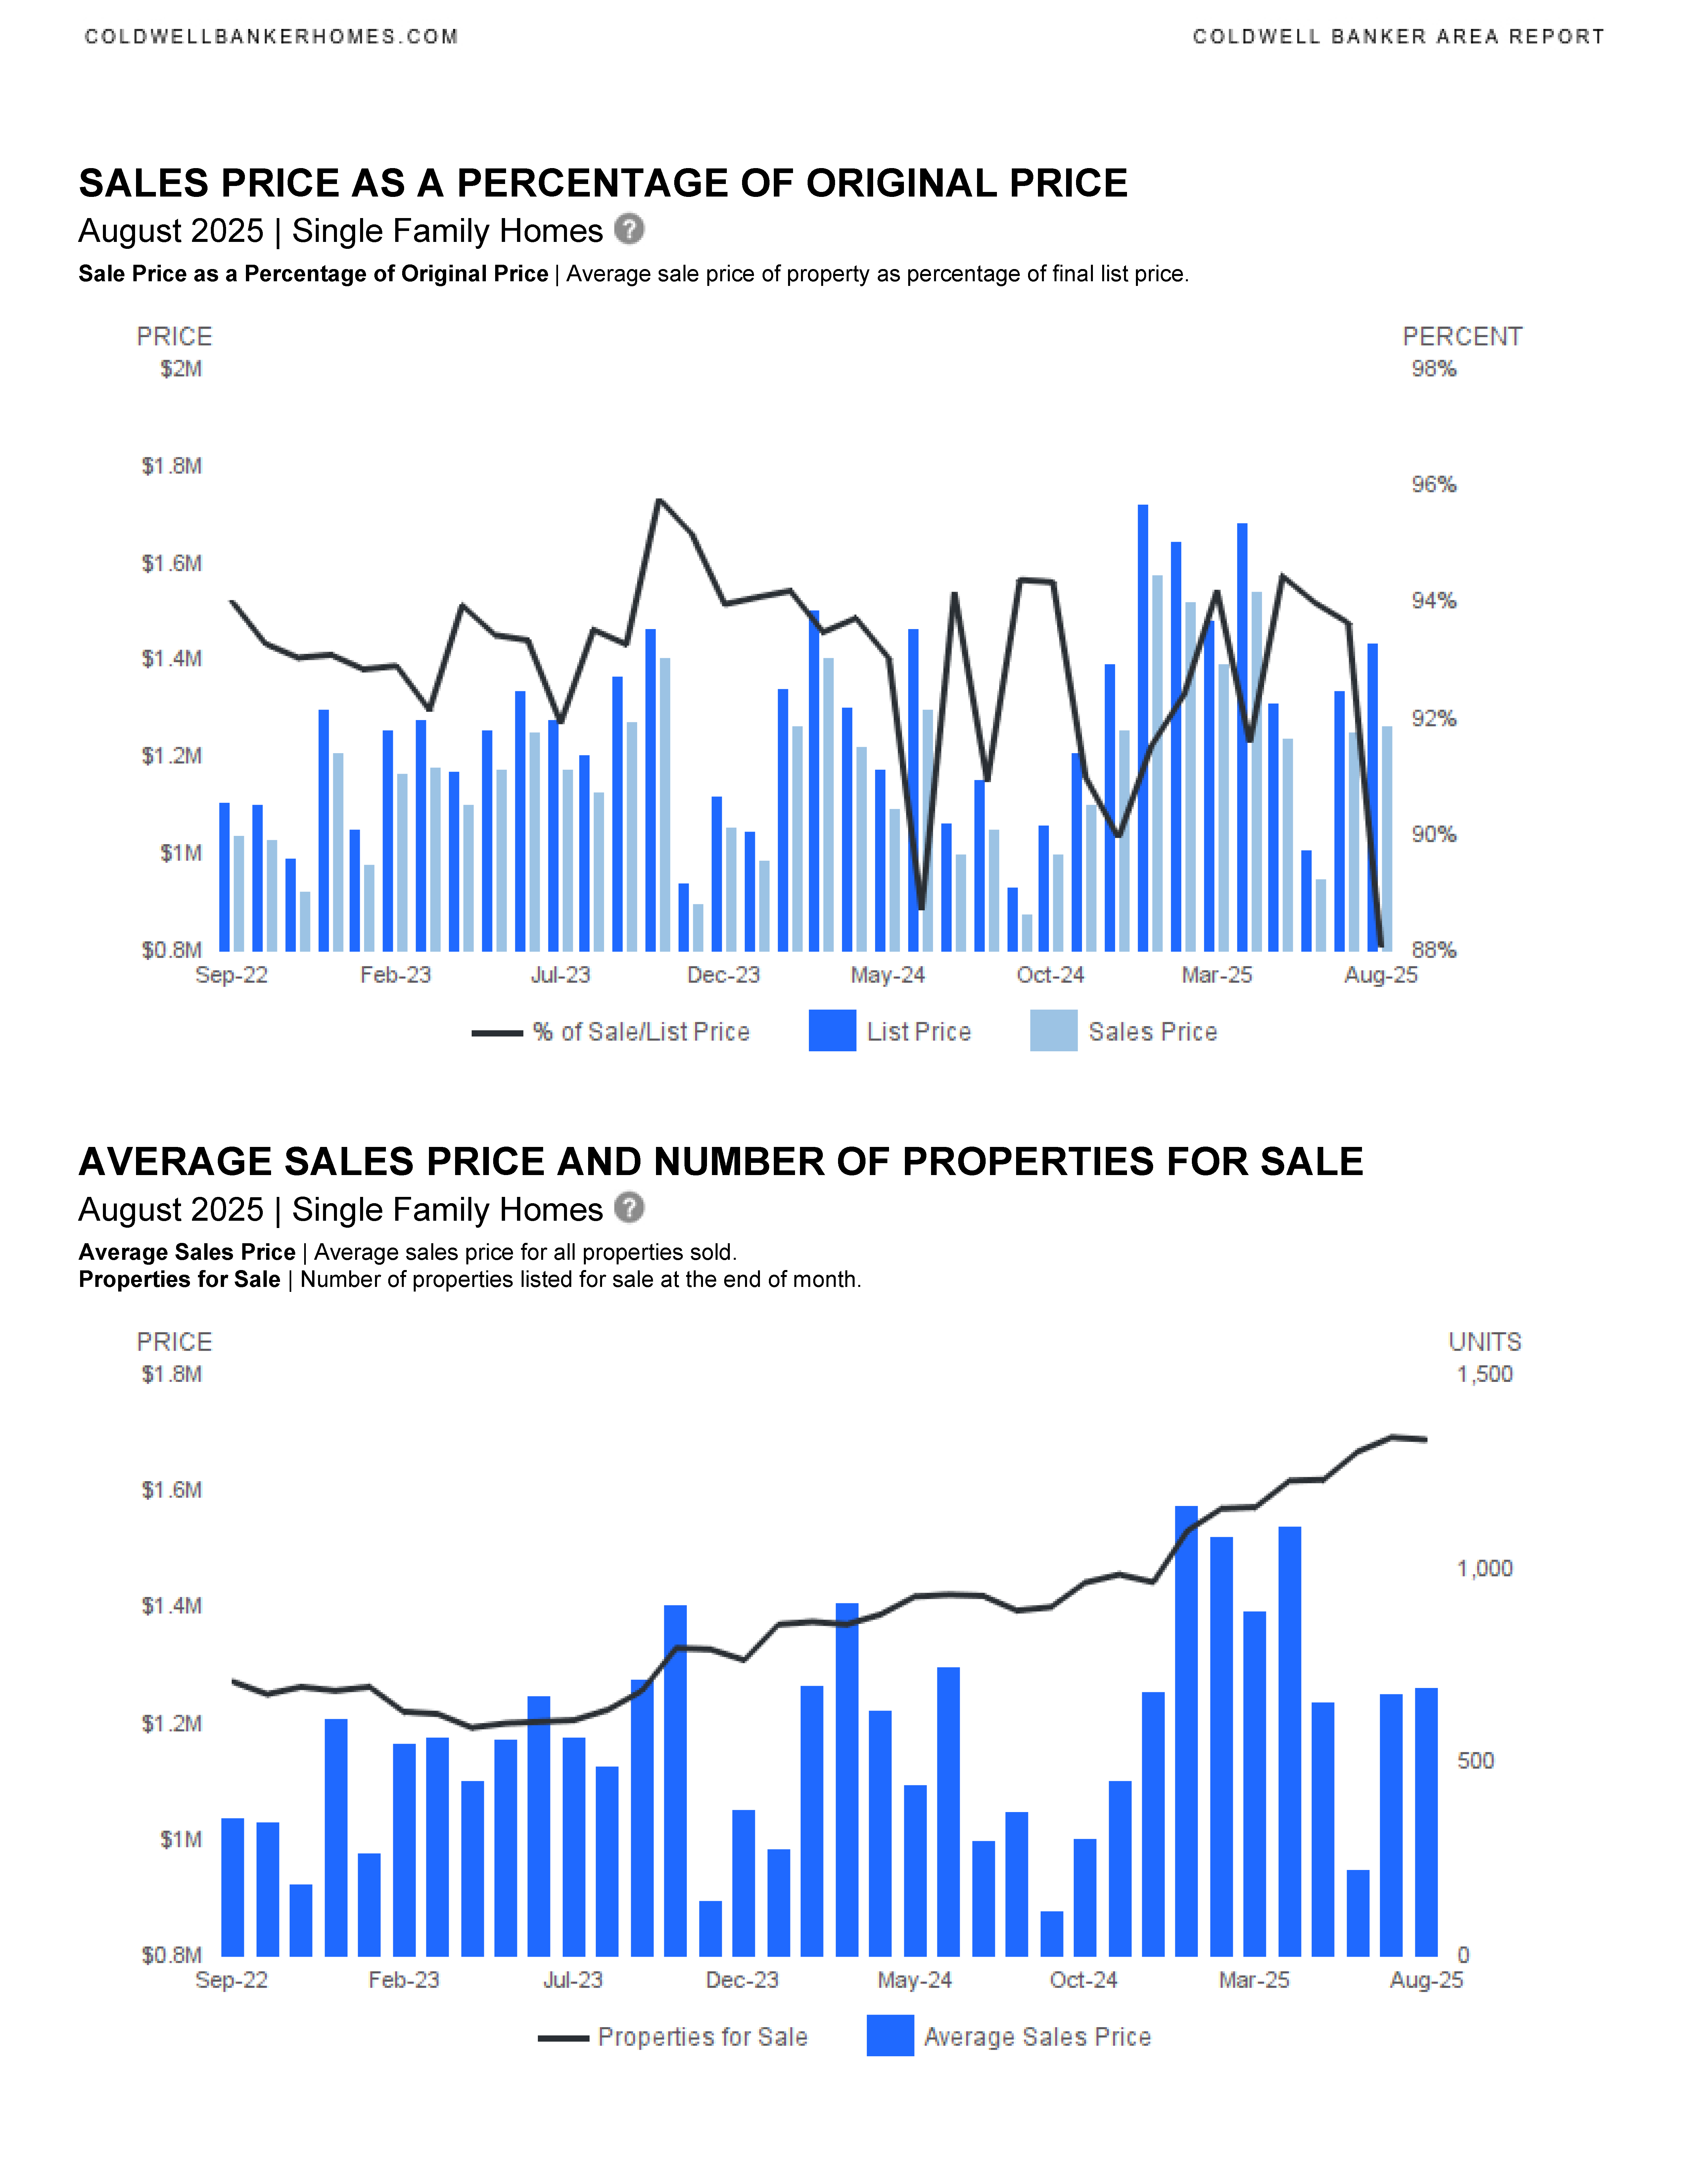
- List/Sold Price Ratio: Slight decrease (-0.33%).
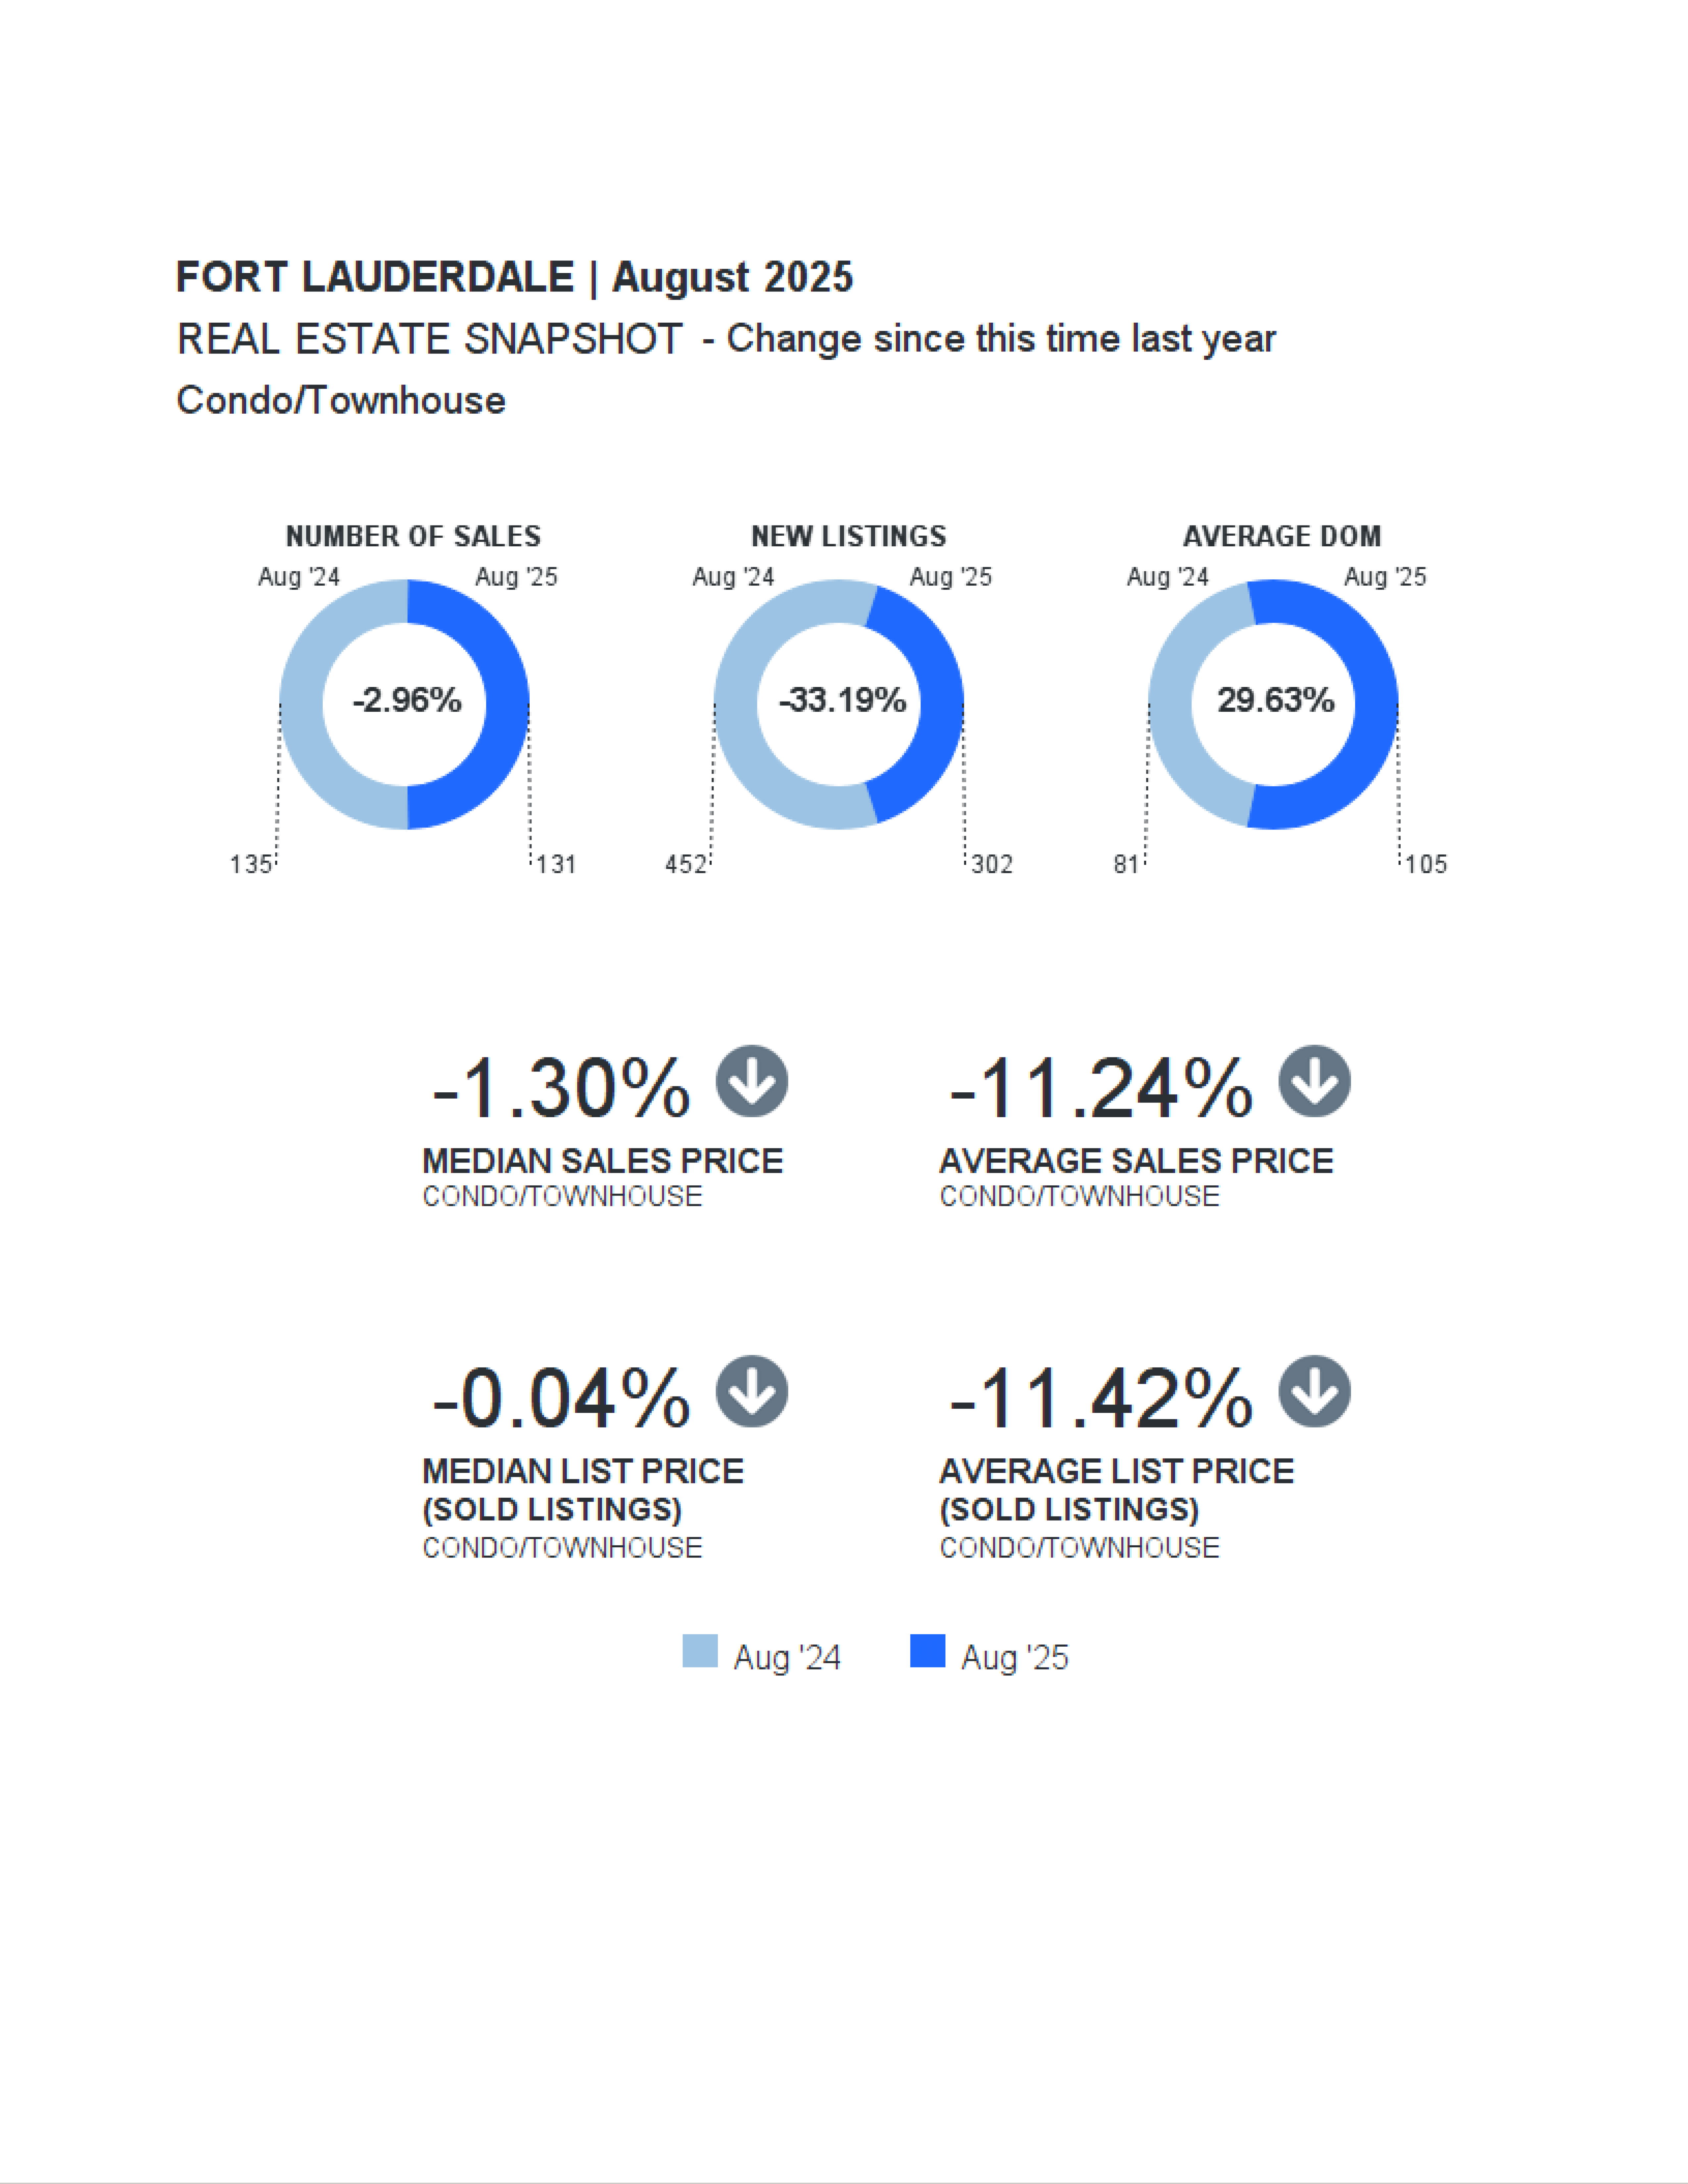
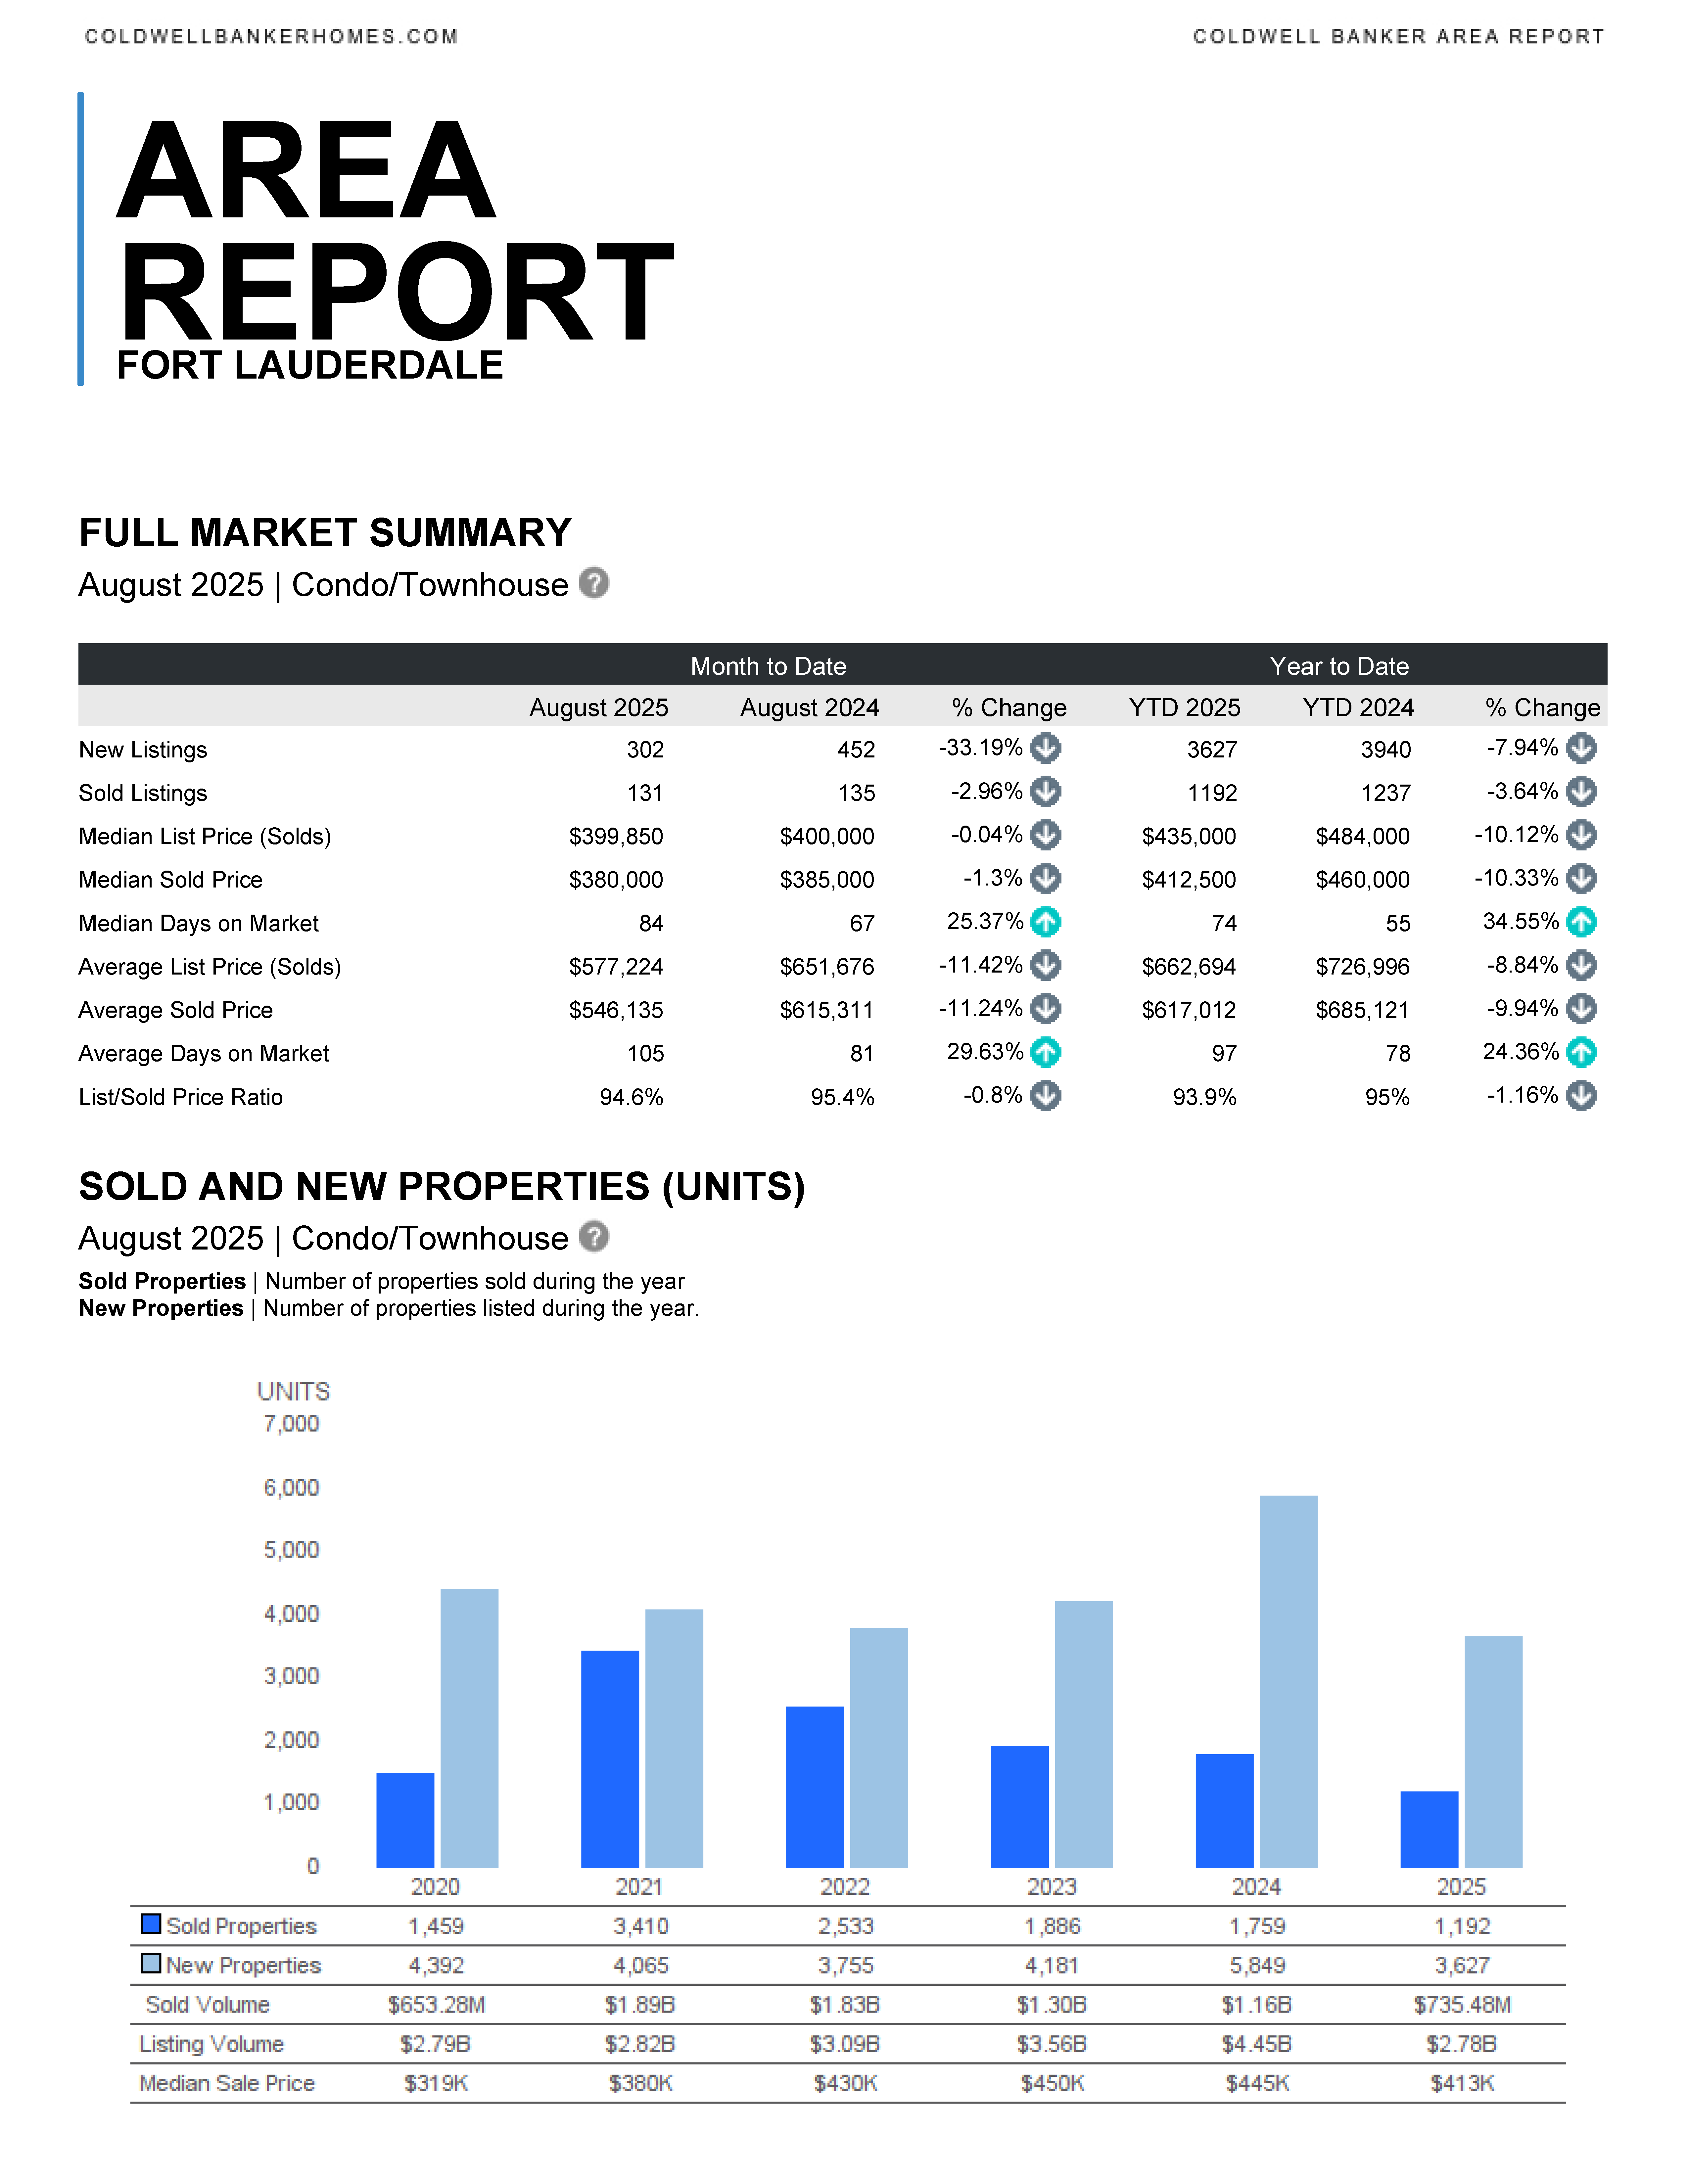
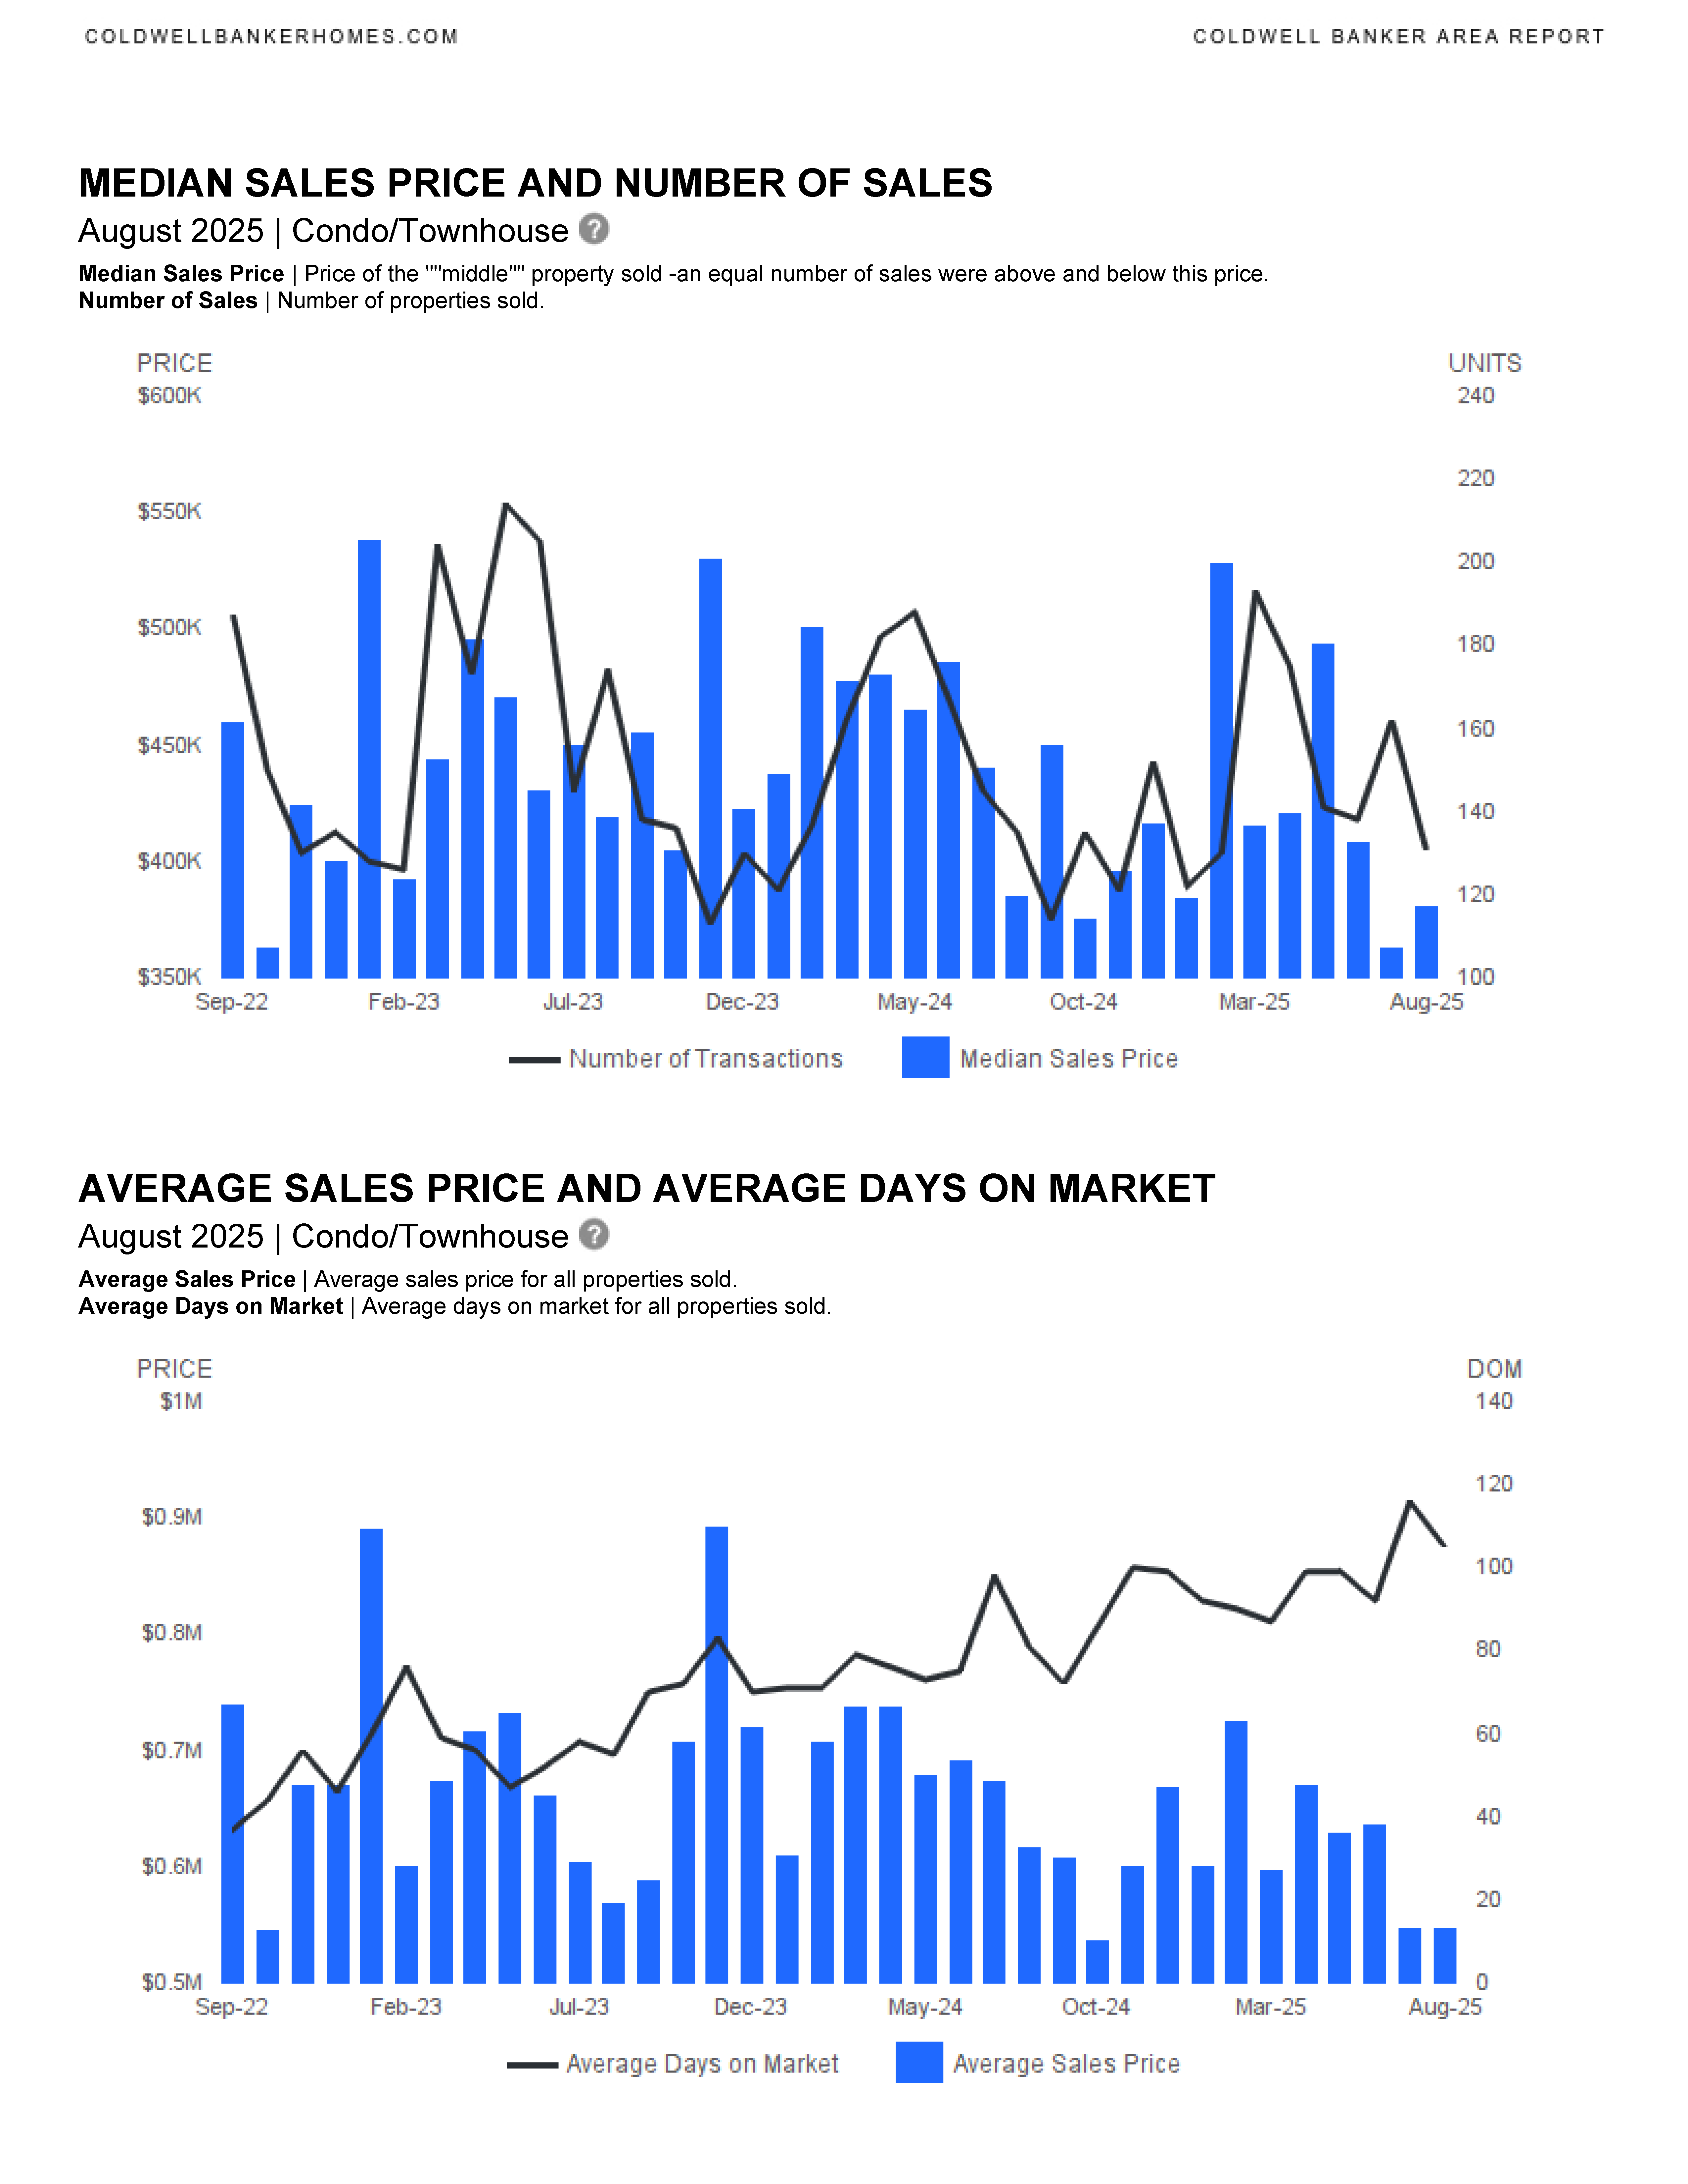
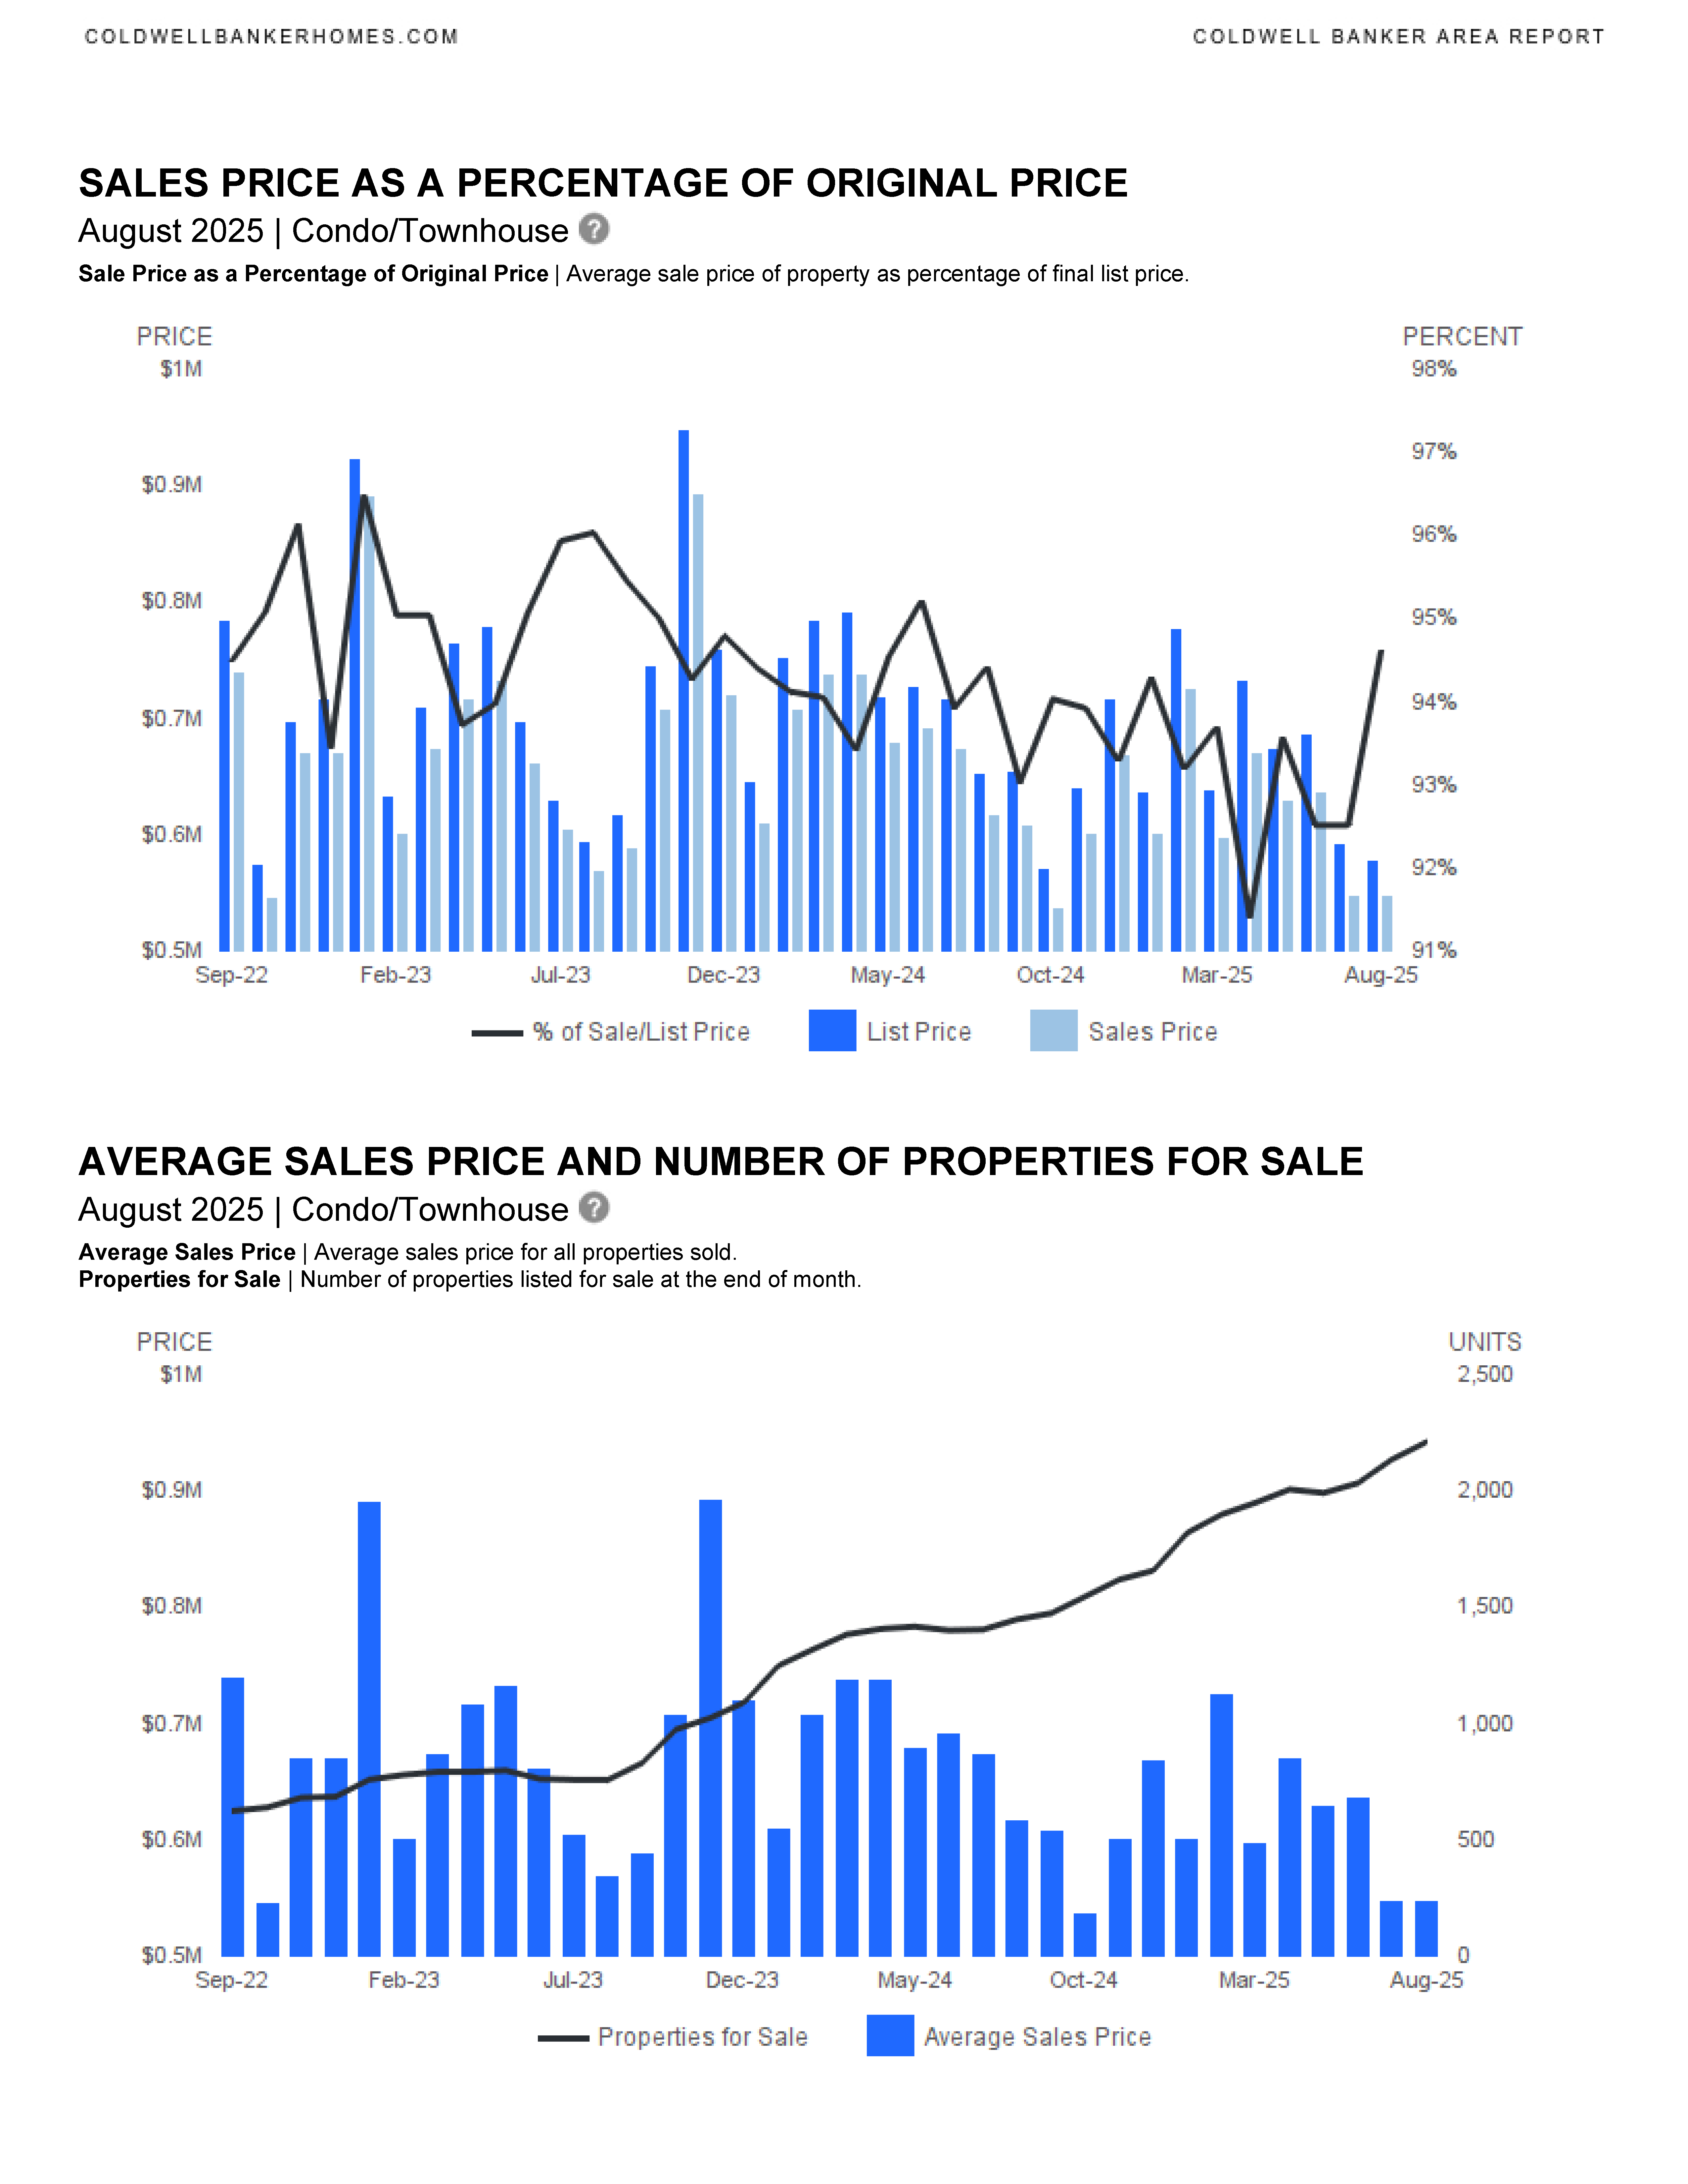
Condos/Townhouses:
- New Listings: Down 33.19% month-to-date and 7.94% YTD.
- Sold Listings: Slight decrease of 2.96% month-to-date and 3.64% YTD.
- Median Sold Price: Decreased by 1.3% month-to-date and 10.33% YTD.
- Average Sold Price: Down 11.24% month-to-date and 9.94% YTD.
- Median Days on Market: Increased by 25.37% month-to-date and 34.55% YTD.
- List/Sold Price Ratio: Slight decrease (-0.8%).
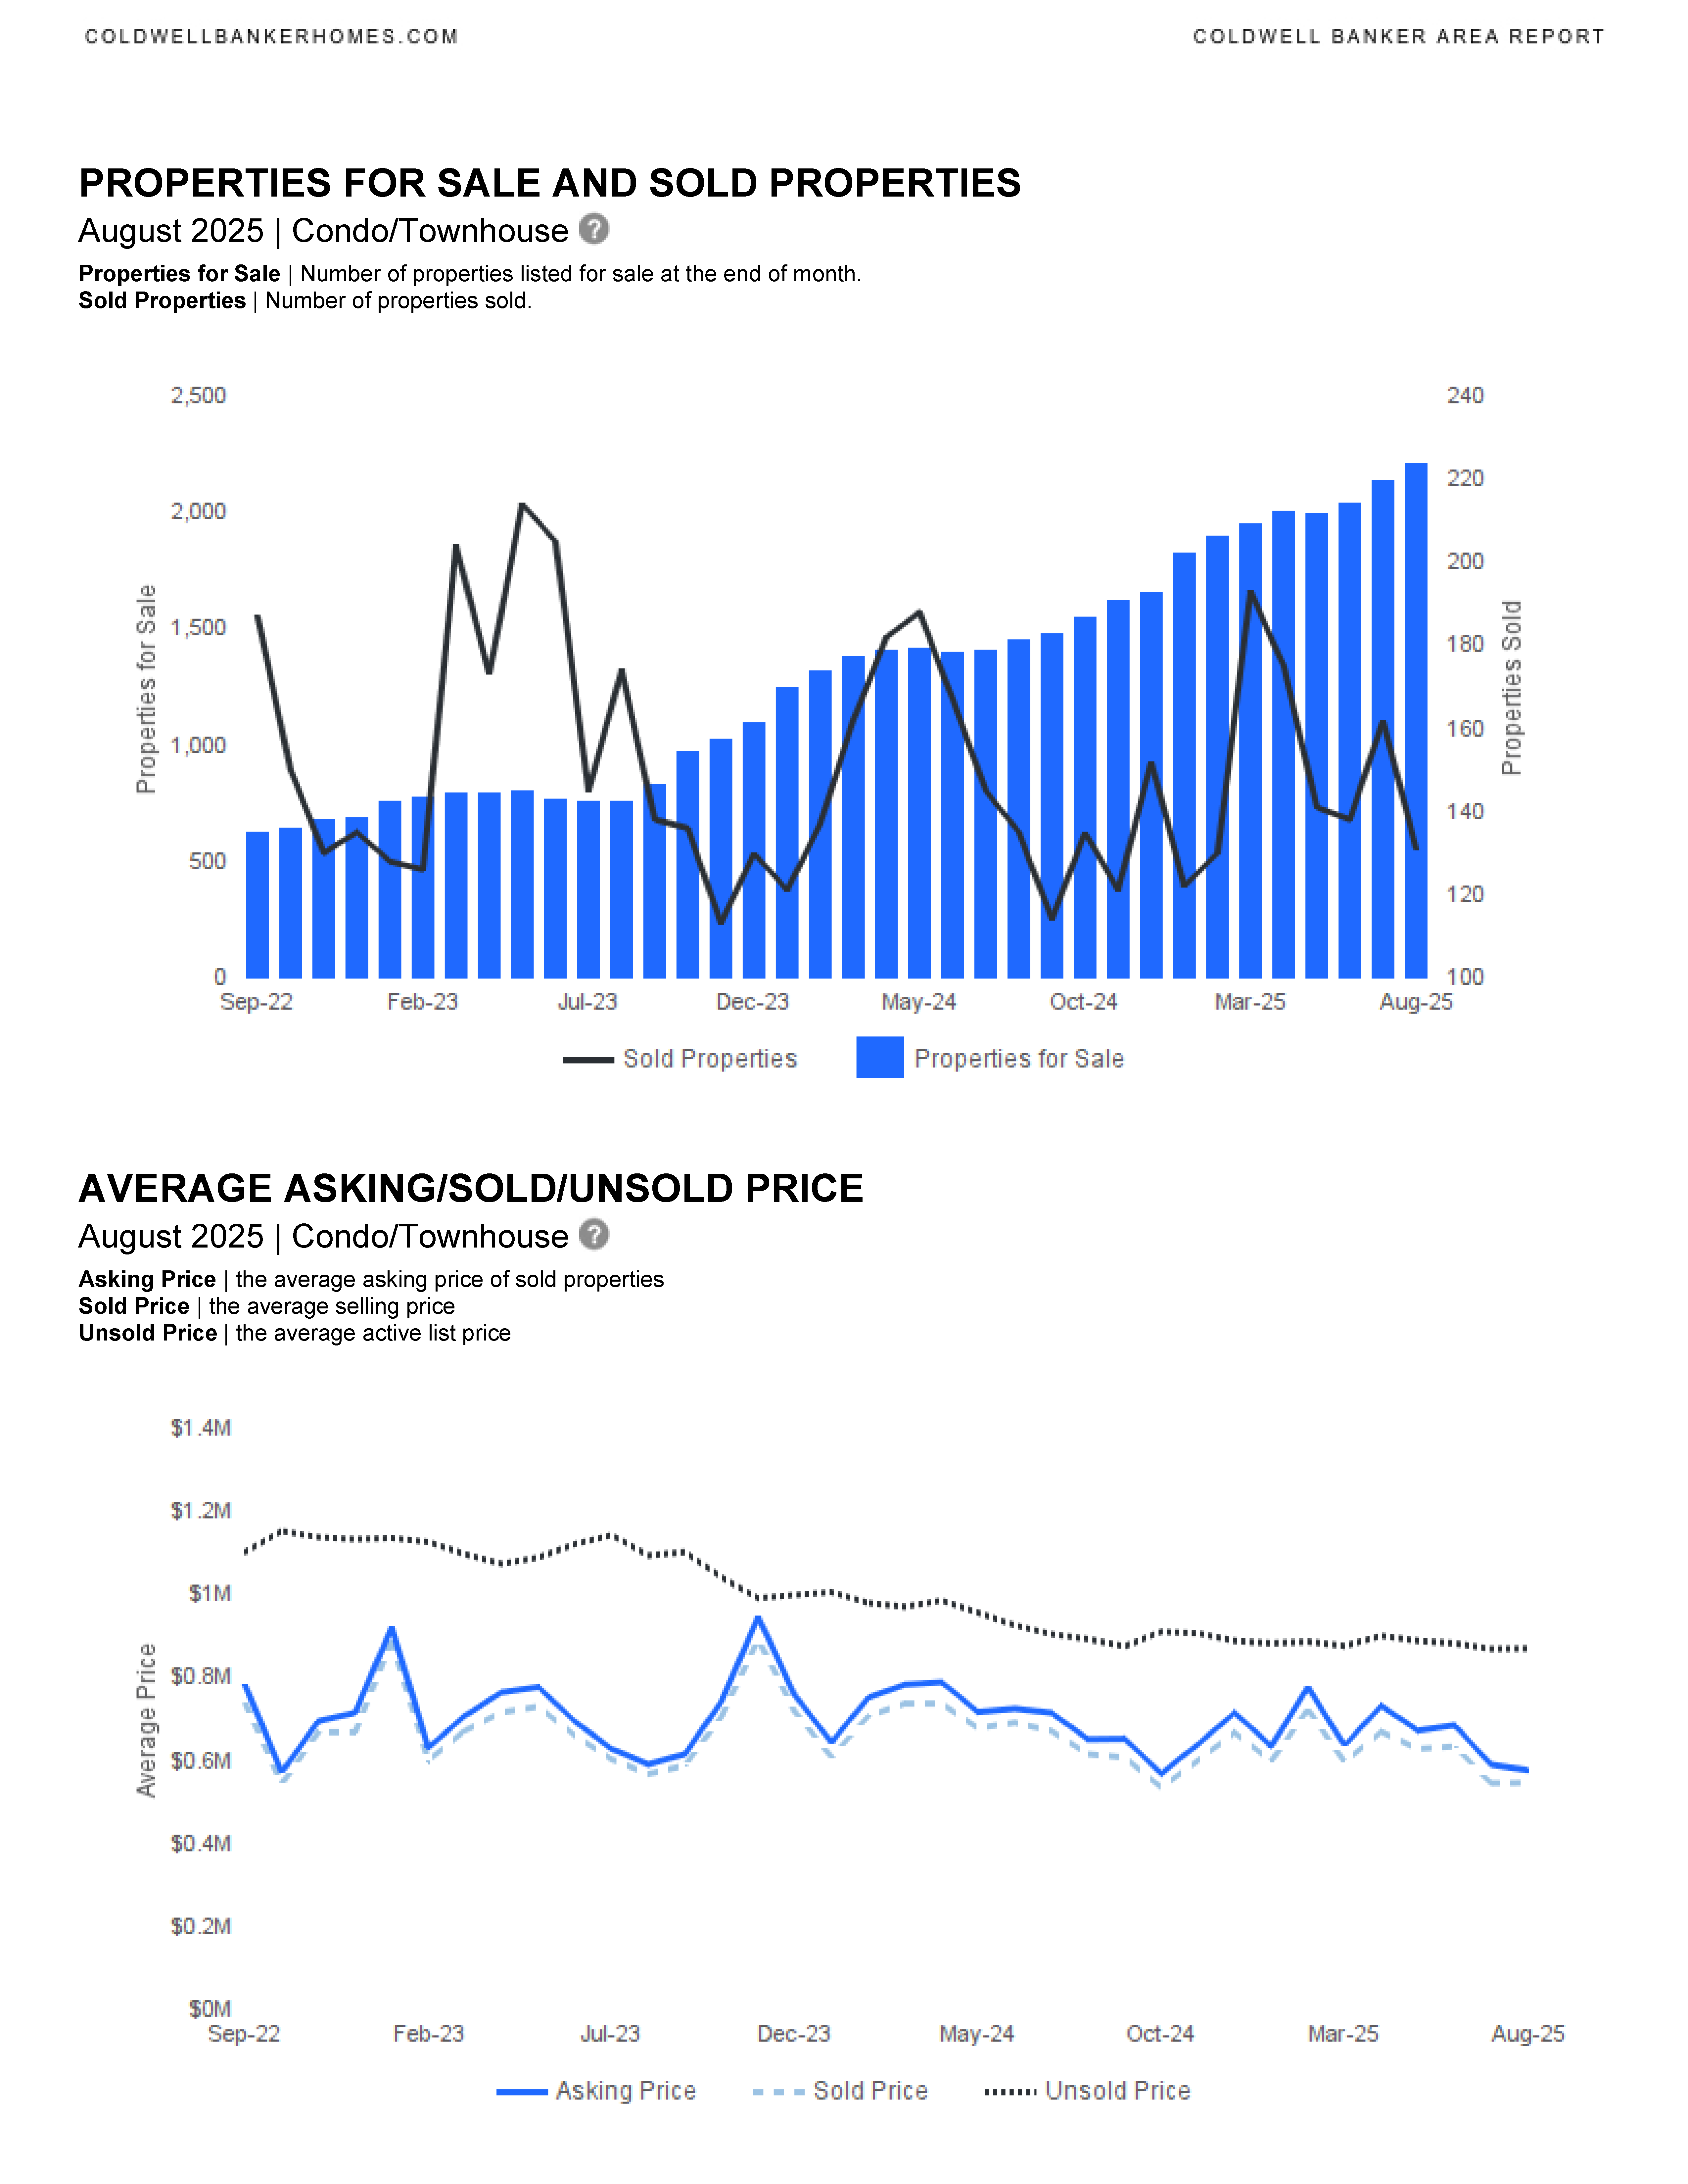
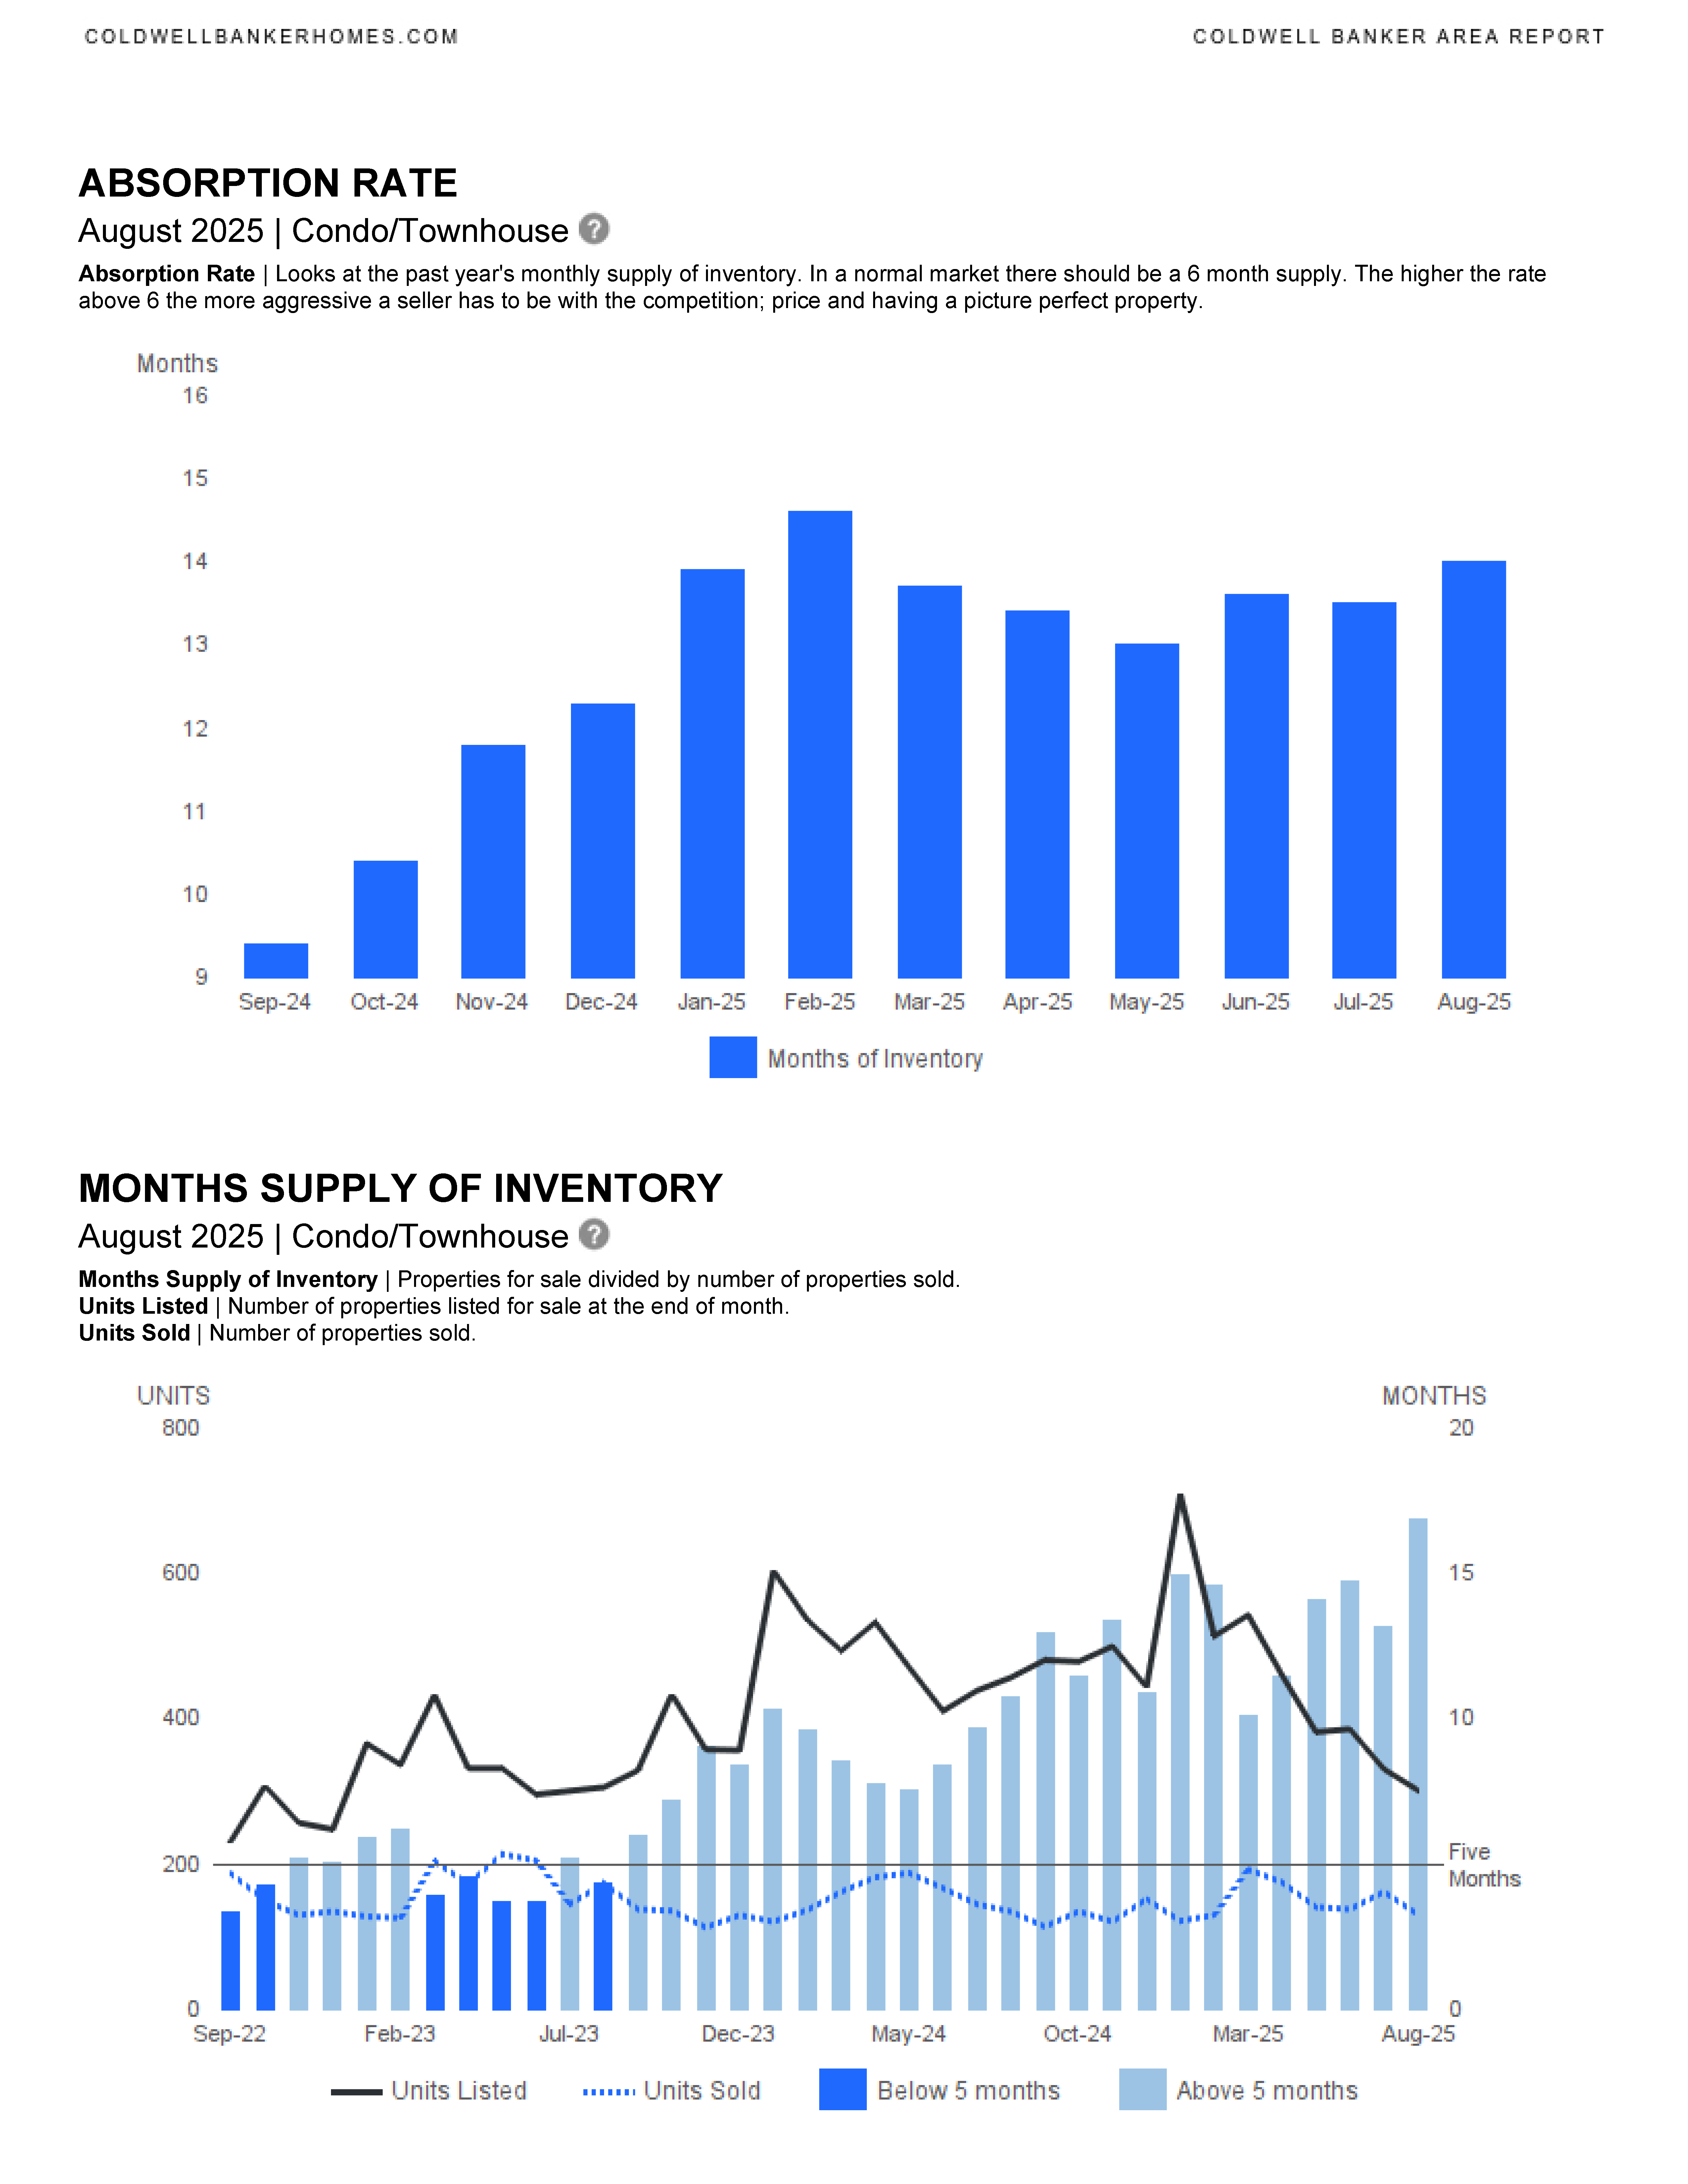
Additional Metrics:
- Absorption Rate: Indicates market competitiveness based on inventory supply.
- Months Supply of Inventory: Reflects the balance between properties for sale and sold properties.
The report emphasizes trends such as declining new and sold listings, rising prices for single-family homes, and longer days on market for both property types. It provides insights for buyers and sellers to understand market conditions and make informed decisions with the experienced assistance from your local real estate advisor, Annette Dammeyer.


We are in a new housing market in SE Florida. This is the time to work with an experienced and knowledgeable real estate professional. Please contact me if you would like to be sent updated market reports for YOUR specific neighborhood, Fort Lauderdale, or another SE Florida city. We can discuss the market, current trends and how we can work together to accomplish your real estate goals. I am here to help.
CONTACT ANNETTE
Let’s start working together!
Annette Dammeyer, REALTOR®, ABR®, AHWD®
Coldwell Banker Realty
901 E Las Olas Blvd STE 101, Fort Lauderdale, FL 33301
808.747.3686
SL 3535792


